Prices aligned downwards
An overview of current trends in the commodity landscape
Published by Luca Sazzini. .
Conjunctural Indicators Commodities Financial WeekThe first week of October 2023 was characterised by a continuation of the downward trend in the price of copper and by a collapse in the price of oil. The price of copper on the London Metal Exchange is now back under $8,000 per tonne; the price of Brent under $85 per barrel.

These dynamics are an indirect sign of a weakening global economic cycle, in all countries except the US, where the economy finds support in a still clearly growing labour market. The US private non-farm payrolls released on Friday, 6 October far exceeded market expectations. The data showed an increase in US payrolls and employment; in September alone, the US managed to create 336,000 jobs. These new data are causing financial traders no small amount of concern about a further rate hike by the Fed. Before Friday, the money markets were predicting with an 80% probability that the FED would decide to keep rates unchanged next month, but with the new payroll results this probability could change dramatically. Any further increase in US rates would further aggravate the economic cycle in the rest of the world.
Falling oil prices
On Wednesday, the ICE-listed Brent crude price dropped more than $5, the largest daily drop in more than a year. The following day saw another drop, bringing the price of Brent to levels below 85 dolars per barrel.
The collapse in oil prices is again due to a strong concern about the demand outlook.
According to JP Morgan commodity analysts, US gasoline consumption is at its lowest level in 22 years. The 30 per cent increase in fuel prices in the third quarter of this year has depressed US demand, already exhausted by the presence of storm 'Ophelia' and floods that flooded several cities including New York.
Despite the manoeuvre implemented by OPEC+ to prevent prices from falling, the demand side seems to have managed to prevail over the supply side. On Wednesday 4 October, crack spreads, the indicators of refining margins, fell below $20 per barrel, the lowest level for about a year and a half.
High prices and current interest rates have contributed to lower crude oil stocks and increased the likelihood of a recession, which would in turn lead to a further drop in demand.
ENERGY
The following graph shows the aggregate price index in US dollars of energy products quoted on the various world stock exchanges.
The index dropped sharply due to the fall in oil prices.
PricePedia Financial Index of energy prices in dollars

Below is the heatmap of energy product prices in euro, to see the weekly changes in individual prices. As is evident, the decline is generalised across most energy prices.
HeatMap of energy prices in euro

PLASTIC MATERIALS
Due to the closure of the Chinese stock exchanges, there was no update on the prices of plastics listed in China.
FERROUS
The following graph shows only the financial index of ferrous metal prices in US dollars on the European market.
These prices also declined.
PricePedia Financial Indices of ferrous metal prices in dollars

The heatmap below provides an overview of ferrous metal price trends, expressed in euro.
The biggest declines were in European hot coil prices and the price of molybdenum.
HeatMap of ferrous metal prices in euro

NON FERROUS
The graph below shows the financial index of non-ferrous metal prices in US dollars as quoted on the London Metal Exchange.
The Chinese holidays kept the SHFE market closed and therefore the relevant financial index is not updated.
From the dynamics of the LME index, the weekly decline in non-ferrous metal prices is evident.
PricePedia Financial Indices of non-ferrous metal prices in dollars

From the heatmap below, it can be seen that the biggest declines were in tin (-4%) and silver (-5%) prices.
HeatMap of non ferrous metal prices in euro

FOOD
The following graph shows the PricePedia indexes of financial prices in dollars of food products divided into 3 categories: cereals, tropicals and oils.
The cereals index is the only one to show relative stability, while the tropicals and oils indices are in line with the downward trend in prices of other commodities.
PricePedia Financial Indices of food prices in dollars

CEREALS
The heatmap below gives an overview of the development of cereal prices in euro.
Looking at the heatmap, it can be seen that the most intense weekly changes in the three-day moving average were in the soybean meal price (-4%) in one direction and the maize price (+2%.) in the opposite direction.
HeatMap of cereal prices in euro

TROPICAL FOOD
From the heatmap below, one can see a general decline in all tropical food prices on PricePedia, but at modest rates.
HeatMap of tropical food prices in euro

OILS
The heatmap shows a reduction in the prices of all oils.
HeatMap of oil prices in euro

You may be interested in:

Transfer of US-China tensions from trade to financial flows
Published by Luca Sazzini. .
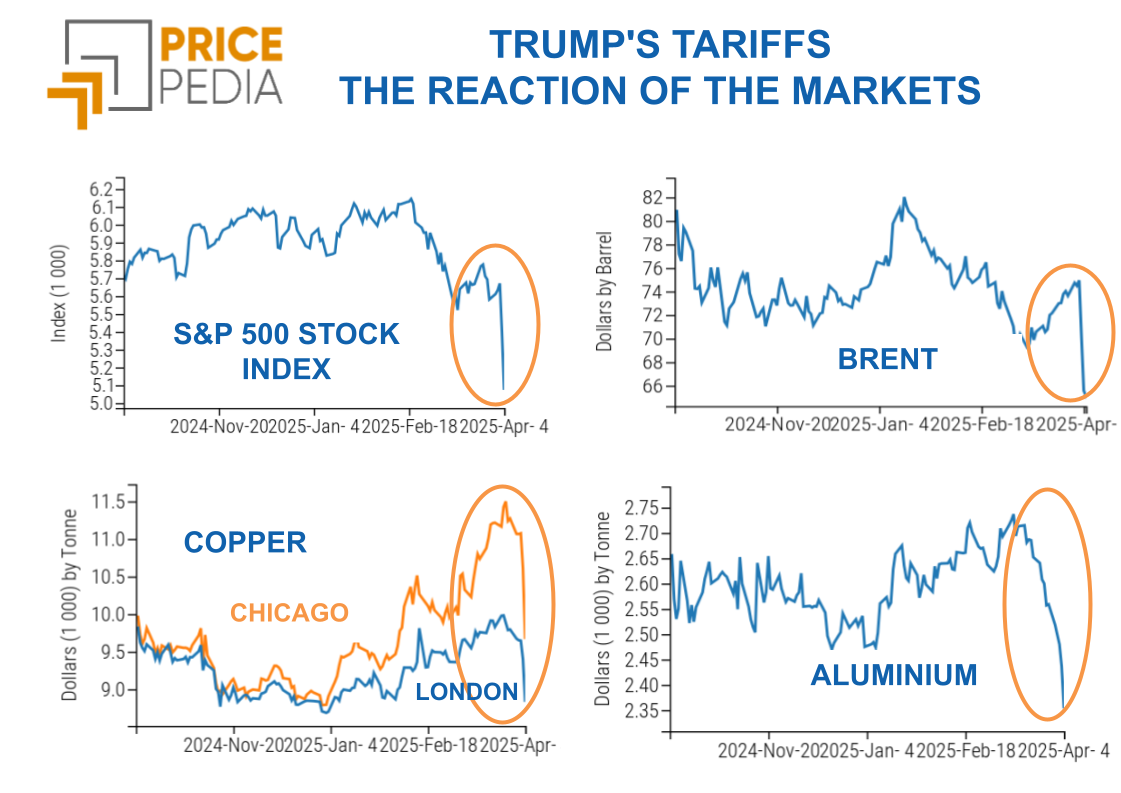
Conjunctural Indicators Commodities Financial WeekMarkets under stress: how Trump's tariffs affect financial price fluctuations [ Read all ]
Liberation or Ruination Day? A storm of tariffs on commodity markets
Published by Luca Sazzini. .
Conjunctural Indicators Commodities Financial WeekFinancial markets fail U.S. protectionist policy [ Read all ]

Commodities in check since Trump's annnucials
Published by Luca Sazzini. .
Conjunctural Indicators Commodities Financial WeekFaced with uncertainty, investors find refuge in gold [ Read all ]