Reaction of financial markets to the attack on Israel
Financial markets take refuge in gold and the Swiss Franc
Published by Luca Sazzini. .
Conjunctural Indicators Commodities Financial Week
Last Saturday at 6am, Hamas attacked Israel. The attack was fierce with 1,200 civilians and soldiers killed and over 150 Israelis and foreigners taken hostage and brought to the Gaza Strip. Fifty years ago, in October 1973, an Arab coalition, consisting mainly of Egypt and Syria, attacked Israel by surprise, putting its army in a difficult position. Thanks to the intervention of the United States and the Soviet Union, the war ended
after three weeks, with no particular military outcome.
It did, however, disrupt the world economy, with the price of oil rising from $2.7 to $4.1 per barrel during the course of the conflict, only to jump to $13 in the following months.
All commodity prices were affected resulting in the largest increase in commodity prices since the post-war period to the present.
The reminder of the war 50 years ago has brought back the oil nightmare, but the oil market situation is completely different from 50 years ago. Back then, the US was heavily dependent on Arab oil.
Today, the US, thanks to shale oil, is by far the world's leading oil producer and net exporter.
This week, the financial markets' response to last Saturday's attack was limited, as can be seen from the graphs listed here.
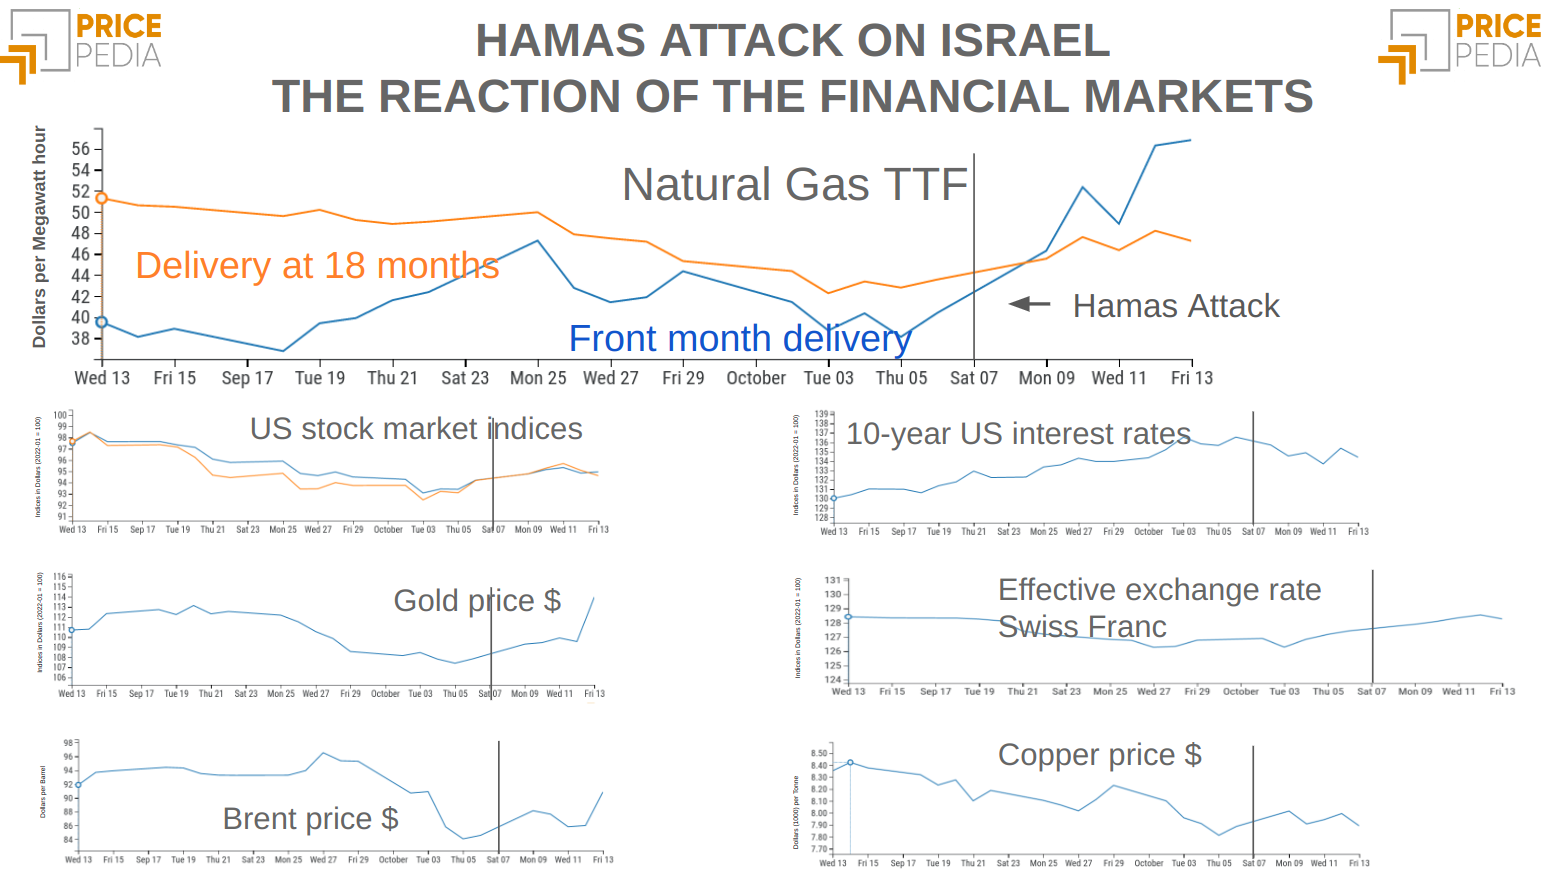
American stock market indices have risen, continuing the trend reversal started at the end of September.
At the same time, the drop in interest rates of US 10-year bonds, signalling the confidence of financial markets in the effectiveness of US monetary policy to control inflation.
The strongest reaction concerned the gold price which rose sharply. Also the Swiss Franc, the safe currency par excellence. QThese dynamics signal an increase in uncertainty among financial players and a shift to assets that can provide some hedging against possible adverse events.
Overall, the reaction of the oil market was limited. The Brent price had closed the previous week at 84.6 $/barrel. On Monday, the Brent price crude rose to over 88.2 $/barrel. The rise of the oil price was, however, a short-lived fluctuation as the price of crude oil fell again in the following days.
Despite the apparent calm in the market, investors' concern in the oil market remains high due to fears of the possible involvement of Iran, an ally and supporter of Hamas.
The copper price remained broadly stable, breaking the downward trend that had characterised September.
The price that has risen sharply this week is that of Natural Gas TTF.
Initially, the rally in natural gas was probably due to the Hamas attack and rising oil prices, but later on, additional supply risks occurred which helped to strengthen the bullish trend. The main events that worried investors are:
- the resumption of the strike by Australian workers at Chevron's LNG plants, starting on 19 October;
- Israel's closure of the Tamar offshore gas field;
- a leakage detected along the Balticconnector.[1]
Confirmation that this week's gas price increases are not a reaction to the new conflict in the Middle East is provided by the relative stability of the 18-month delivery price. The increase in the price of gas mainly concerned short-term maturities, signalling that the market reaction concerns events that should be resolved in the short term. It is difficult, unfortunately, to think that what is happening in the Gaza Strip can be resolved in the short term.
ENERGY
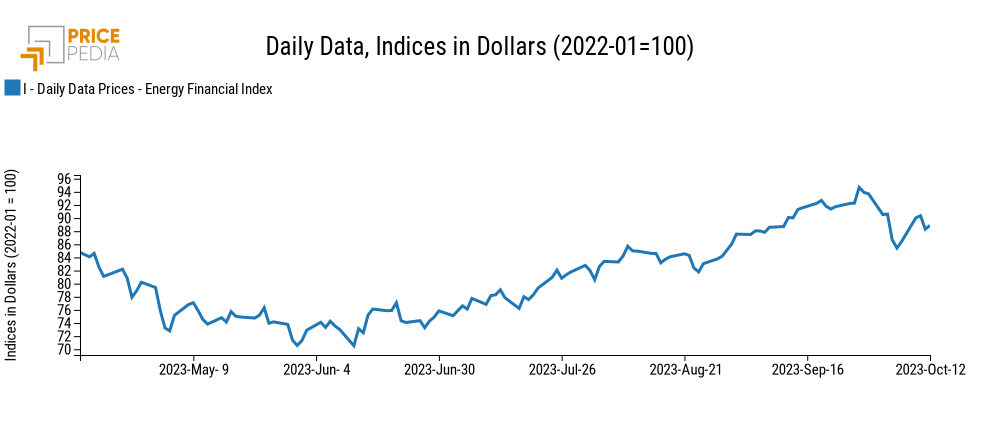
The energy index, after falling in recent weeks, rose sharply, supported by rising gas prices.
PricePedia Financial Index of energy prices in dollars
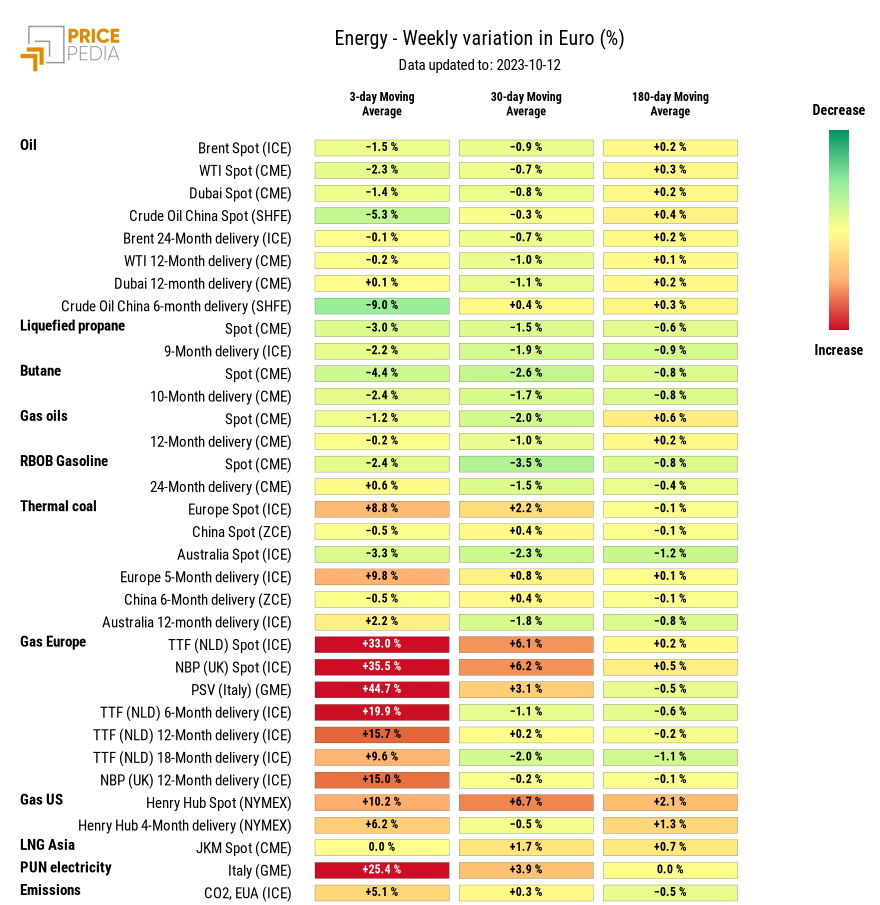
The Heatmap of energy commodities highlights the strong increase in gas prices, which recorded a weekly change in the three-day moving average well above 30%, with a peak for gas traded at the Italian PSV, which recorded an increase close to 50%.
HeatMap of energy prices in euro
PLASTIC MATERIALS
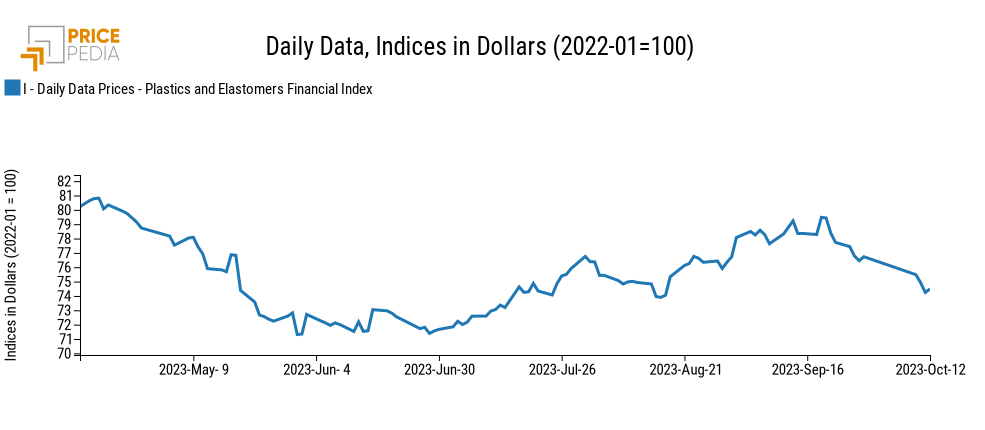
When the Chinese stock exchanges reopened, the China plastics financial index continued its downward trend throughout the week.
PricePedia Financial Index of Plastics in dollars.
The heatmap below shows the euro prices of the plastics contained in the index.
HeatMap of plastics prices in euro
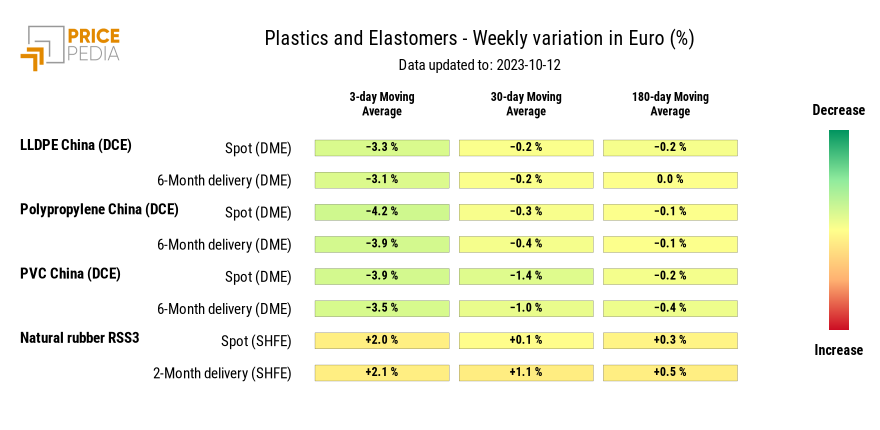
The heatmap shows a general drop in plastics of more than 3%, with the exception of natural rubber RSS3, which shows an increase in the weekly change of the three-day moving average of 3%.
FERROUS
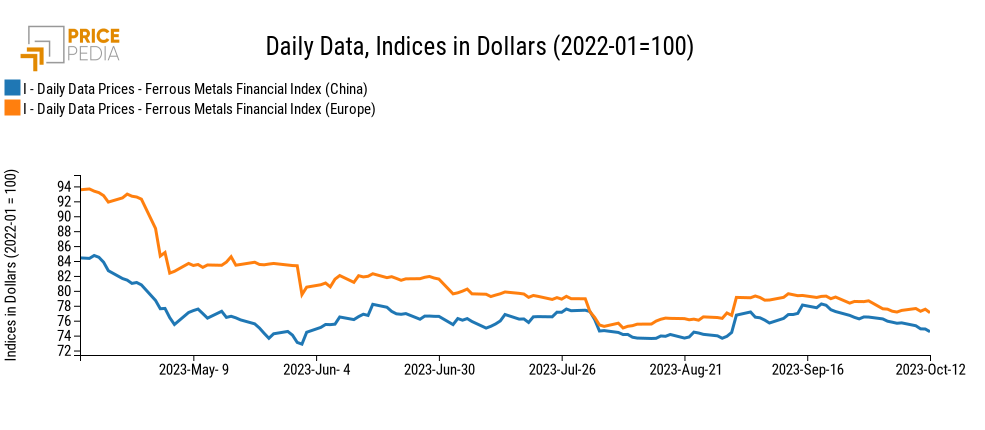
This week a slight drop also affected the financial indices of ferrous prices.
PricePedia Financial Indices of ferrous metal prices in dollars
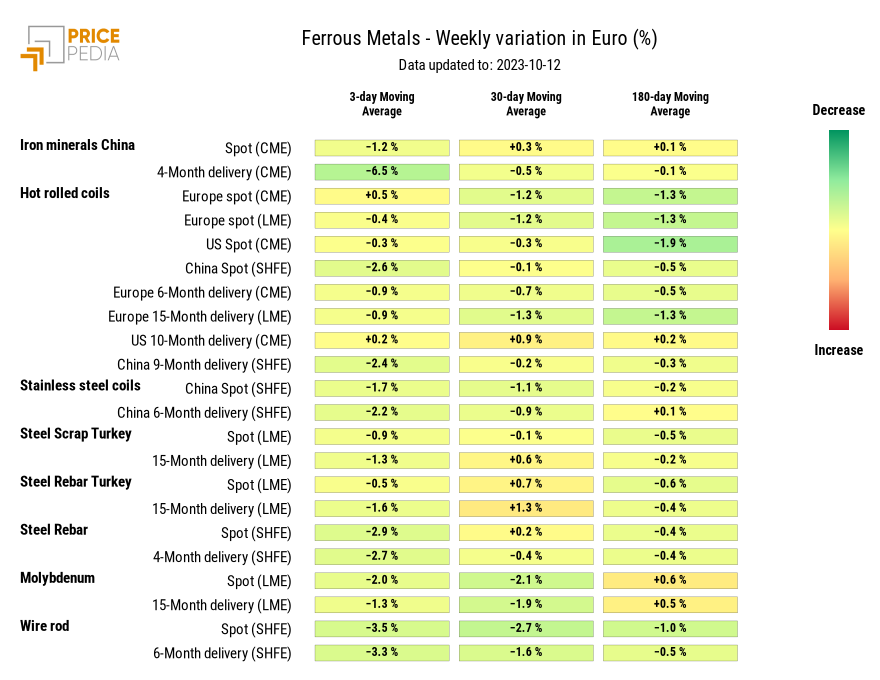
The heatmap below provides an overview of ferrous metal price trends, expressed in euro.
Looking at the heatmap, one can see that almost all the changes in the three-day moving averages are negative.
The biggest declines were in China iron ore futures and the spot price of molybdenum.
HeatMap of ferrous metal prices in euro
NON FERROUS
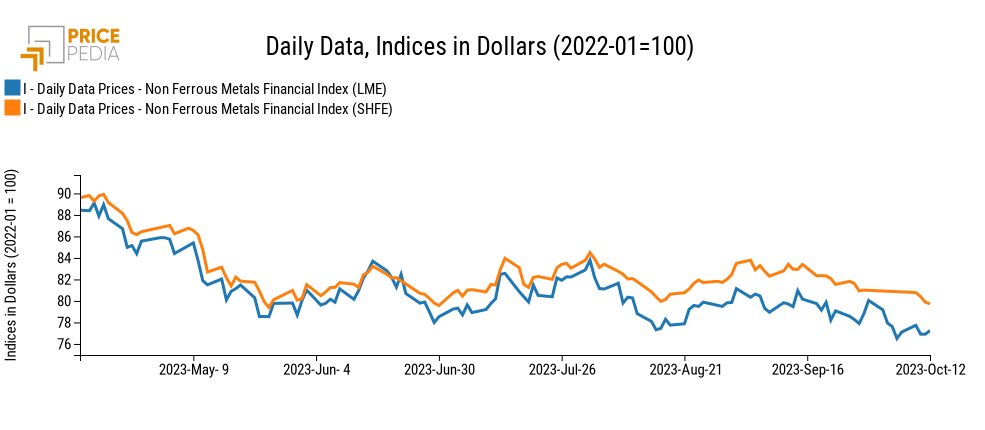
Non-ferrous indices also showed a downward trend.
PricePedia Financial Indices of non-ferrous metal prices in dollars
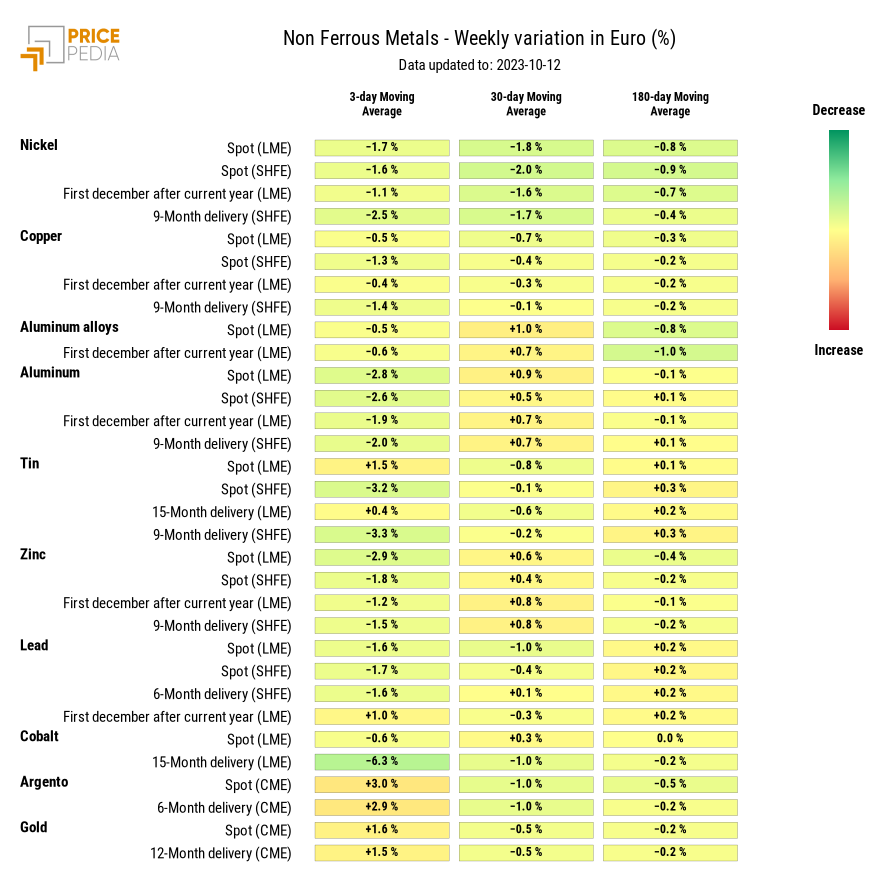
The heatmap below shows the rising price of precious metals, against a declining trend in industrial metals.
HeatMap of non ferrous metal prices in euro
FOOD
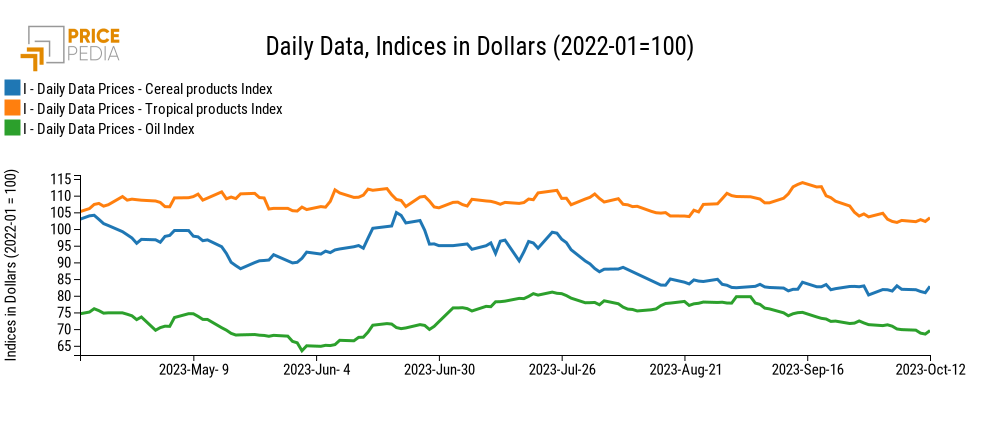
All financial indices of food prices fell at the beginning of the week and recovered in the last few days.p>
PricePedia Financial Indices of food prices in dollars
CEREALS
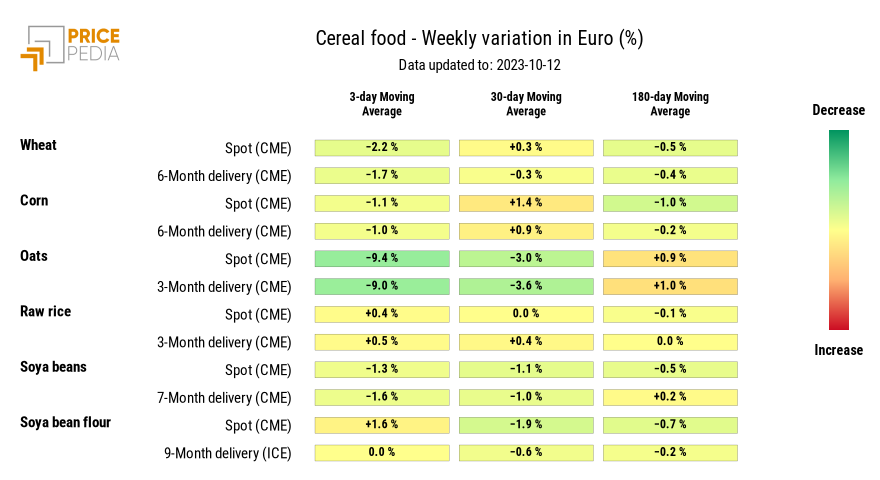
The heatmap below shows the sharp weekly decline in oat prices, whose three-day moving average fell by by 10%.
HeatMap of cereal prices in euro
TROPICAL FOOD
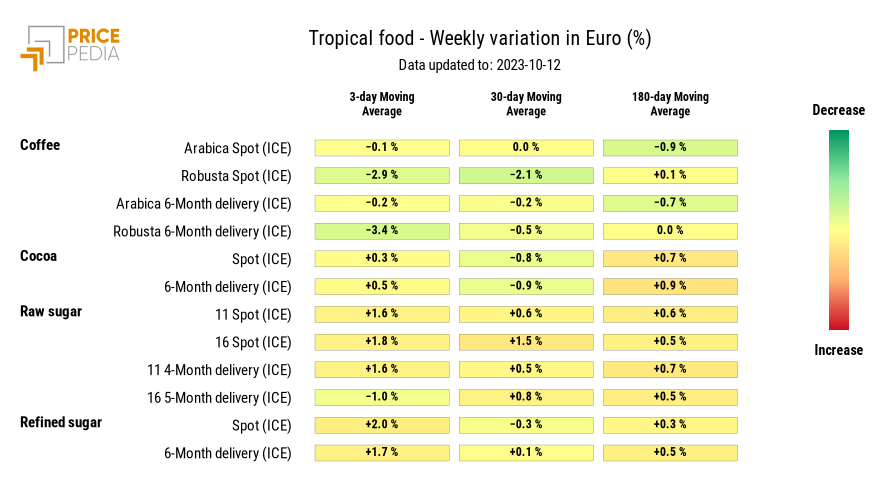
The heatmap below shows the changes in tropical food prices.
HeatMap of tropical food prices in euro
FOOD OILS
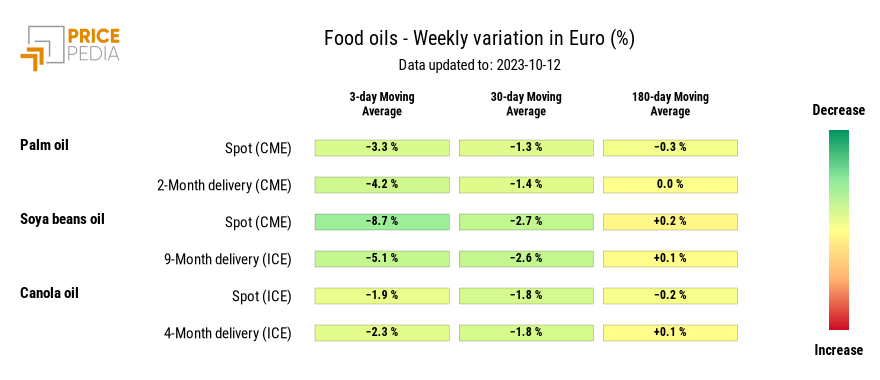
From the reported heatmap, a general reduction in oil prices emerges, particularly for soybean oil, which shows a weekly change of -6%.
HeatMap of oil prices in euro
[1] Gas pipeline built to transport gas from Finland to Estonia across the North Sea in the Gulf of Finland.

