Weak signs of rising industrial metal prices
Commodity prices supported by US growth and supply uncertainty
Published by Luca Sazzini. .
Conjunctural Indicators LME Weekly Analysis
The ECB Governing Council meeting, on 26 October in Athens, ended with the decision to leave the three ECB benchmark rates unchanged. President Cristine Lagarde stated that future choices regarding a rate hike are not ruled out regardless, while choices regarding a possible lowering of rates are considered premature.
The Governing Council was adamant in maintaining the current interest rates to ensure a timely return to the 2% inflation target. The ECB's decisions were in line with those of analysts, who expect a rate cut in the future starting in the third quarter of next year.
Other important news of the week is the acceleration of the US GDP growth, which rose by +4.9% annualised in the third quarter compared to the second quarter. This above-expected growth was driven by a strong increase in government spending and consumption.
News of US growth and the ECB's decision to stop raising rates led to an appreciation of the dollar against the euro.
Signs of increases in industrial metals
As far as the commodity markets, the leading commodities this week were US hot coils and, to some extent, copper. Both of these commodities increased in price due to a drop in supply.
Strikes by the United Auto Workers (UAW) union increased the delivery time for HRCs (Hot Rolled Coils) from 6.9 to 8 weeks. This resulted in a recovery of hot coil prices, which, according to the manufacturers, had long since reached price levels that were too low.
The rise in copper prices, on the other hand, relates to Southern Copper Corporation's declaration of a lowered copper production forecast for 2023 and 2024. The downward revision is mainly related to the Peruvian people's protest against the Mexican-US mining company Southern Copper Corporation's 'Tía Maria' copper project. However, this is not the only fact that has worried copper market participants. In fact, a further protest recently started in Panama against the underground exploitation of Central America's largest open-pit copper mine. These fears combined with previous downward revisions by other suppliers, including Teck Resources and Anglo-American, have pushed copper prices up.
| HRC USA & LME COPPER TRENDS | |
| Hot-rolled coils USA spot (CME) | Copper spot (LME) |

|

|
ENERGY
This week there was a stop in the rise of prices in the energy sector, which continues to remain a rather unstable sector due to the conflict in the Middle East.
PricePedia Financial Index of energy prices in dollars

The energy commodity heatmap shows a general decline in prices with the exception of PSV gas, which experienced a weekly increase of +5%. In contrast, the PUN price of electricity in Italy shows a weekly decrease in the three-day moving average of -12%. Yesterday, the PUN price for this weekend's supply of electricity fell back below 110 euro/MWh, more than 20 euro below last weekend's prices.
HeatMap of energy prices in euro

PLASTIC MATERIALS
This week, the chinese index of plastics turned slightly upwards.
PricePedia Financial Index of Plastics in dollars.

The heatmap below shows the euro prices of the plastics contained in the index.
HeatMap of plastics prices in euro

The heatmap does not show any significant price changes.
FERROUS
The China ferrous index starts slightly up, while the Europe ferrous index remains more stable.
PricePedia Financial Indices of ferrous metal prices in dollars

The heatmap shows the strong increase in US hot rolled coils, with a weekly increase in the 3-day moving average of +21%.
HeatMap of ferrous metal prices in euro

NON FERROUS
This week both non-ferrous indices moved upwards at the end of the week.
PricePedia Financial Indices of non-ferrous metal prices in dollars

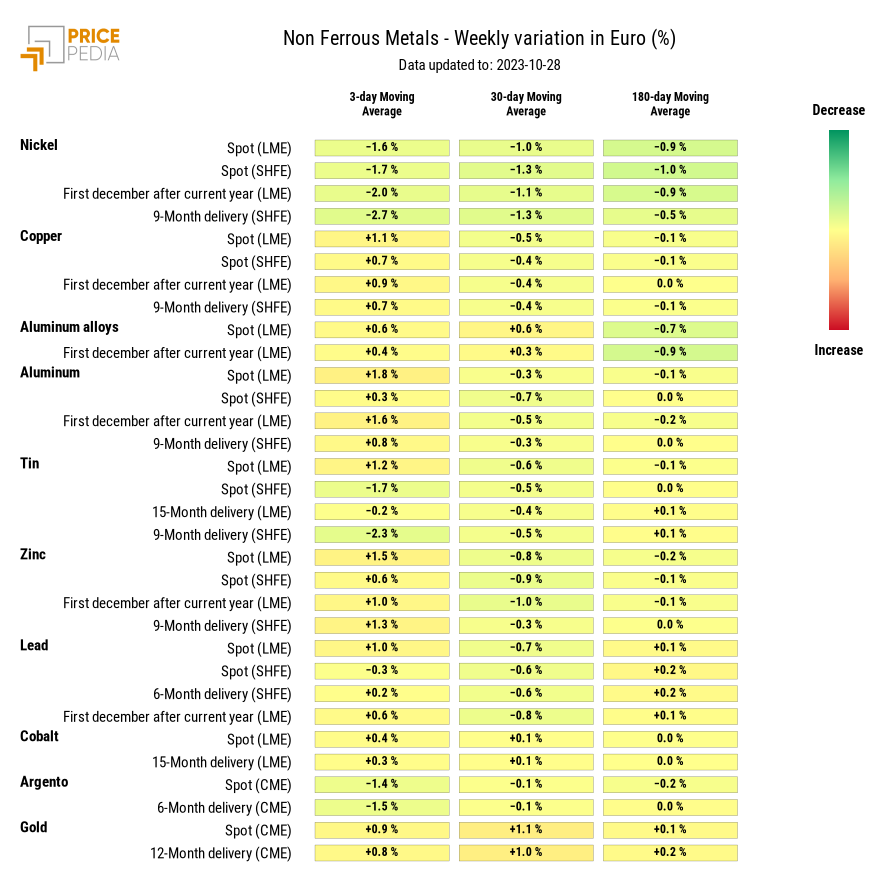
The heatmap shows no prices that have changed significantly.
HeatMap of non ferrous metal prices in euro

FOOD
This week saw a drop in the cereals and oils index and fluctuations in the tropicals index.
PricePedia Financial Indices of food prices in dollars

CEREALS
The heatmap shows a decrease in corn prices against an increase in oat prices.
HeatMap of cereal prices in euro

TROPICAL FOOD
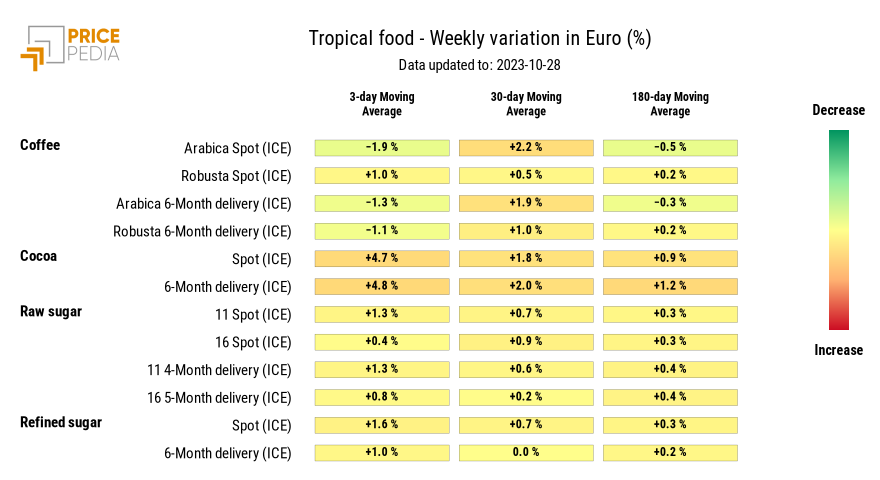
The heatmap shows an increase in the 3-day moving average of cocoa prices.
HeatMap of tropical food prices in euro

FOOD OILS
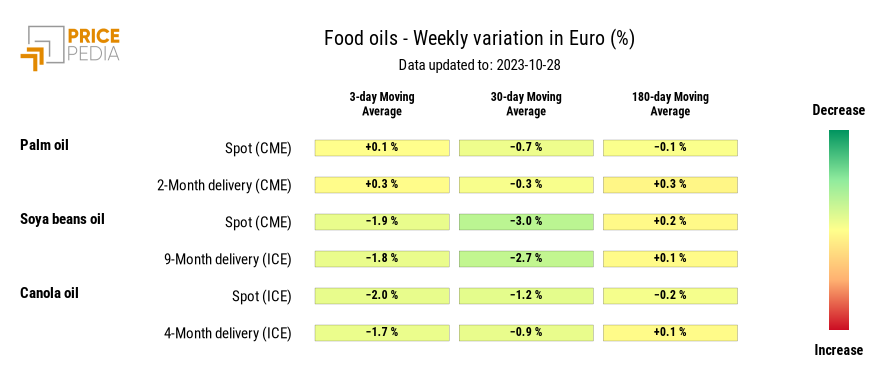
Heamap shows a decrease in oil prices, particularly for soya bean oil and canola oil.
HeatMap of oil prices in euro


