Inflation and commodity prices
Inflation falls, but too slowly to have any effect on commodity markets
Published by Luca Sazzini. .
Conjunctural Indicators Commodities Financial Week
New US inflation data signalled a stronger slowdown in price growth than expected by analysts.
The Consumer Price Index (CPI) rose by 3.2% year-on-year, lower than the experts' forecast of 3.3%.
On a monthly basis, the CPI remained unchanged, against 0.1% of analysts' expectations.
The core rate, i.e. the consumer price index adjusted for the most volatile goods such as energy and food, increased by +0.2% month-on-month and 4% year-on-year, against expectations of +0.3% m/m and 4.1% y/y.
This lowering of the infaltion is mainly caused by the drop in energy prices in October, while, according to Senior Market Strategist Filippo Diodovich, the decrease in the core index can be attributed to falling prices for used machines and services in the medical field.
Other important news concerns Great Britain's falling inflation, where prices fell again above expectations.
The consumer price index recorded its smallest increase since October 2021 at 4.6%, down sharply from 6.7% in September. The services CPI now stands at 6.6% year-on-year, below the BoE's forecast of 6.9%.
This information further strengthened expectations of the end of restrictive monetary policies, generating a rise in the main stock market indices. However, as far as the commodity market is concerned, there was no particular change in the face of lower inflation.
Once again this week, the front of greatest uncertainty concerns the price of oil.
The uncertainty of oil prices
This week, energy markets were put under pressure by the volatility of the price of Brent crude, which started the week at $82.5/barrel before collapsing on Thursday to $77.5 and recovering significantly the following day.
The main driver behind these oil price movements seems to be the increase in US inventories, which rose by 3.59 million barrels in the last week to just over 439 million barrels, the highest level since August 2023.
The erratic dynamics of oil prices seem to have worried OPEC members, particularly Saudi Arabia.
The likelihood of a Saudi proposal for a cut of 1 million barrels per day early next year
seems, therefore, increasingly likely.

A comparison of the spot and futures price shows a backwardation situation, so oil prices are expected to fall in the future by the end of 2025, with the price possibly dropping below $75.br> Financial markets therefore do not seem to express much confidence in OPEC+'s ability to follow through on its objective of a target oil price of $85 per barrel.
ENERGY
This week, falling oil prices dragged down the energy price index.
PricePedia Financial Index of energy prices in dollars

The energy commodity heatmap shows a general price decline, which affected oil and thermal coal prices the most.
In contrast, the three-day moving averages of the PSV and PUN prices continue to remain on the rise, although they show much less change than they did last week.
HeatMap of energy prices in euro

PLASTIC MATERIALS
This week, the plastics financial index returned to growth.
PricePedia Financial Index of Plastics in dollars.

The heatmap below shows the euro prices of the plastics contained in the index.
HeatMap of plastics prices in euro

The heatmap shows an increase in RSS3 natural rubber prices.
FERROUS
The European ferrous dollar indices continue to register sideways price movements, while signs of growth are coming from the Chinese ferrous index.
PricePedia Financial Indices of ferrous metal prices in dollars

Given the appreciation of the euro against the dollar,
the euro prices shown in the heatmap below do not show significant price changes.
Among the decreasing prices, the decrease in molybdenum prices is worth mentioning.
HeatMap of ferrous metal prices in euro

NON FERROUS
Both non-ferrous indices remained stable this week, realising insignificant changes.
PricePedia Financial Indices of non-ferrous metal prices in dollars

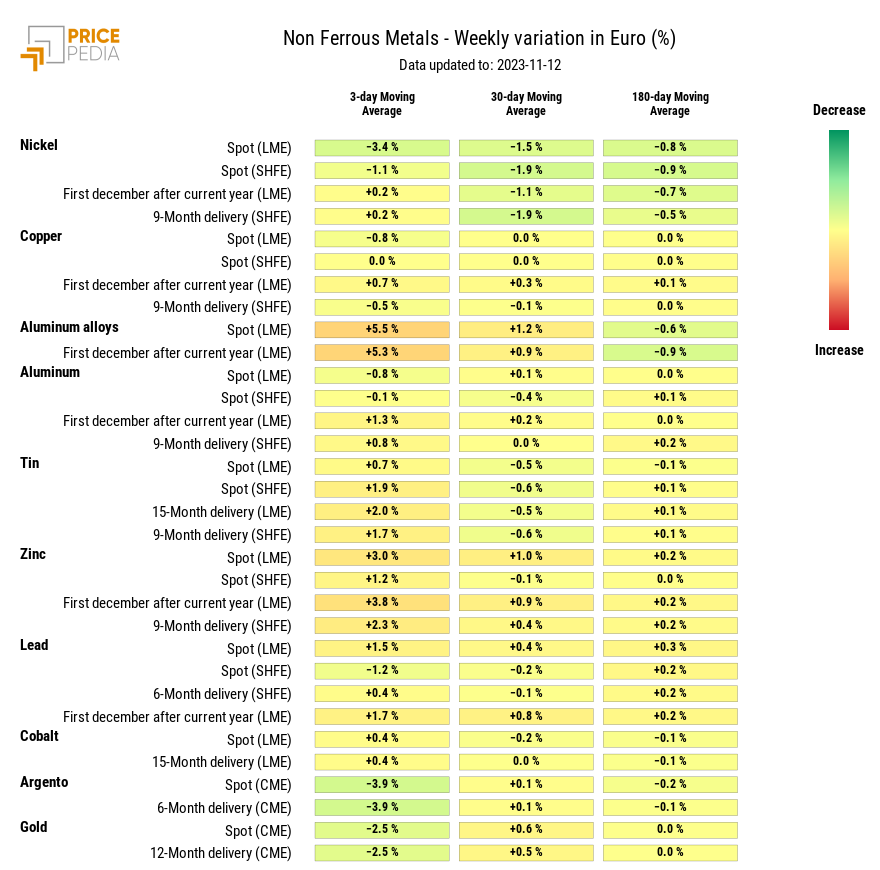
The heatmap shows a decrease in nickel and aluminium prices, while silver prices increased.
HeatMap of non ferrous metal prices in euro

FOOD
This week saw signs of a slight increase in the oils and tropicals dollar index, while the cereals index continued on its stable path since mid-August.
PricePedia Financial Indices of food prices in dollars

CEREALS
The heatmap shows a reduction in wheat prices.
HeatMap of cereal prices in euro

TROPICAL FOOD
The heatmap shows a slight decrease in sugar prices, while coffee futures increased slightly.
HeatMap of tropical food prices in euro

FOOD OILS
The oil heatmap shows a small increase in prices, but at very modest rates.
HeatMap of oil prices in euro


