The effects of the economic slowdown on commodity prices in 2024 and 2025
PricePedia Scenario December 2023
Published by Pasquale Marzano. .
Last Price Forecast
The PricePedia scenario has been updated with the information available as of December 6, 2023. The current weakness of the global economic cycle continues to be reflected in the dynamics of European commodity prices, although in November 2023 positive signs emerged from inflation in Europe (+2.4 % in November slowing down from +2.9% in October).
The global industrial cycle index, a proxy for global demand for raw materials, is illustrated below.
Global Industrial Cycle Scenario (2022-01 = 100)

The global industrial cycle is expected to remain at the levels of November 2023 also in the first part of 2024. On the annual average, 2024 is lower than the levels of the previous year by almost one percentage point (-0.9%). The real change in direction of this dynamic occurs in the final part of 2024 and continues into the following year. In annual terms, in 2025 there will be growth in the industrial cycle equal to +2.5% compared to the values of the previous year. However, the 2025 levels are still lower than the average values of 2019 by -0.4%.
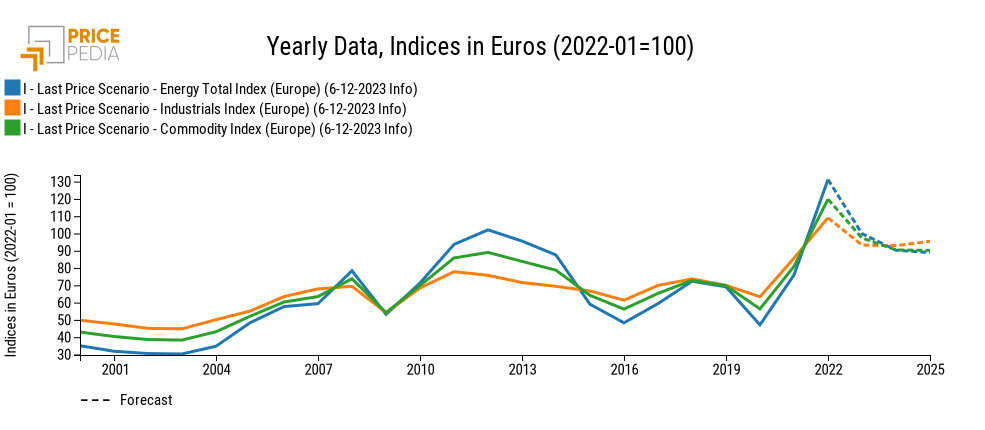
The effects of this dynamic on the prices of raw materials and basic goods are illustrated in the following graph, which shows the trend of commodity price indices for various product aggregates (Industrial [1], Total commodities[2] and Energy).
Commodity prices forecast, indices in Euro (2022 = 100)

Energy commodities continue their decline from the anomalous levels recorded in 2022, until arriving, on average in 2025, at values slightly lower than those of October 2021.
As regards industrial commodities, however, 2023 represents a price floor, as reported in a previous article. In aggregate terms, on average in 2024, prices do not differ significantly from the values of the previous year. In 2025, the prices of industrial goods tend to grow more markedly, influenced by the recovery of the global industrial cycle.
In order to document the effects of the deterioration of the global economic cycle, it may be useful to compare the December 2023 forecast scenario and the one previously published. The following table shows the annual percentage changes for the two scenarios in 2023 (pre-estimate), 2024 and 2025.
PricePedia Scenario: estimates and forecasts compared
| 2023 | 2024 | 2025 | ||||
|---|---|---|---|---|---|---|
| Estimate Oct-'23 (%) |
Estimate Nov-'23 (%) |
Scenario Nov-2023 (%) |
Scenario Dec-2023 (%) |
Scenario Nov-2023 (%) |
Scenario Dec-2023 (%) |
|
| Total Commodities | -18.4 | -18.2 | -4.6 | -7.1 | -3.4 | -0.3 |
| Industrial Commod. | -13.6 | -14.2 | +1.6 | -0.4 | +1.6 | +2.7 |
| Energy Commodities | -24.2 | -23.3 | -5.1 | -9.6 | -5.4 | -1.5 |
For all three aggregates considered, the comparison highlights how the December scenario, compared to the previous publication, is weaker in 2024. The main determinant of the observed change is an accentuation of the negative phase of the world industry (especially European).
A further determinant, especially for the dynamics of energy raw materials, is the price of oil which in the most recent scenario presents a lower level, closing 2025 just below 80 dollars a barrel.
Faced with a more downward trend in 2024, the December scenario is also characterized by a more intense recovery in 2025 for industrial commodities and more contained decreases for energy raw materials.
1. The PricePedia Industrial index results from the aggregation of the indices relating to the following product categories: Ferrous, Non-Ferrous, Wood and Paper, Chemicals: Specialties, Organic Chemicals, Inorganic Chemicals, Plastics and Elastomers and Fibers Textiles.
2. The PricePedia Total Commodity index results from the aggregation of indices relating to industrial, food and energy commodities. Pasquale Marzano
Economist and data scientist. At PricePedia he deals with the analysis of commodity markets, forecasting models for raw material prices and management of reference databases.


