Hot-rolled Coils USA: Future Continous
Analysing the individual contracts underlying the continous future reveals the expectations of traders
Published by Luca Sazzini. .
Hot-Rolled Coils HRC Price DriversIn this article, we will analyze the determinants that have caused significant price variations in US hot-rolled coils (HRC) within the one-month continuous futures market.
One-month continuous futures are indices constructed by combining futures contracts with one-month delivery over time. Once the current month's futures contract reaches its expiration date, the continuous index will take on the value of the next month's futures contract. This contract rollover could lead to significant price variations in the continuous index, both positive and negative.
In the one-month continuous futures of US hot-rolled coils, this aspect is particularly evident. In the recent period, there have been several high-intensity variations once the contract expiration date is reached.
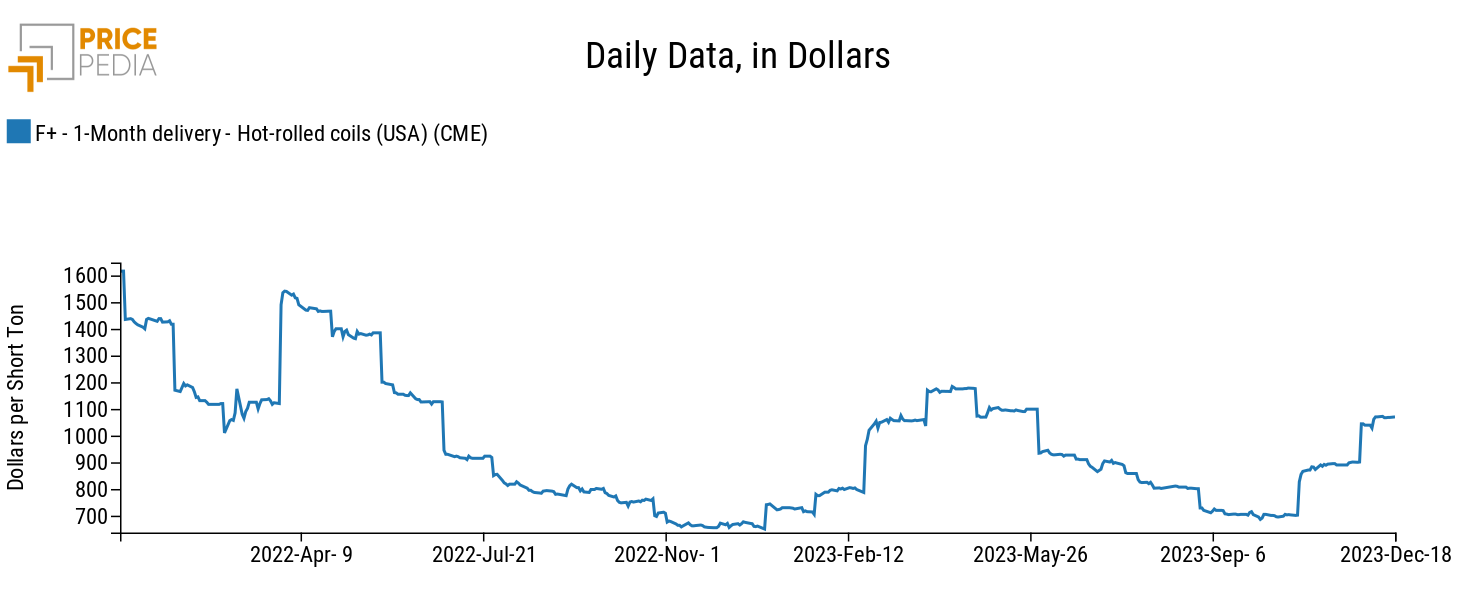
For example, from January 27 to January 28, 2022, with the replacement of the January futures with February futures, there was a price variation of -17%. Similarly, from March 28 to March 29, 2022, there was a positive variation of 32.5% due to the replacement of the March contract with that of April in the index.
Below is the chart of the one-month continuous futures on US hot-rolled coils to show the daily trend of the contract over the past two years.

Recently, the continuous index recorded a significant variation during the transition from the November 2023 futures contract to the December contract. On November 28, this change led to an increase in the continuous index by 15.87%. This highlights the approximation of continuous futures contracts, as they attribute an economic event to November 28 that actually pertained to the month of October. For this reason, in addition to continuous futures, it is essential to analyze the performance of individual futures contracts because they provide a better explanation of price variations within the continuous index.
To this end, it can be helpful to examine the dynamics of the two contracts over the past few months, as outlined below.
As observed in the graph, it is evident that the price of the December 2023 delivery contract increased much more rapidly than that of the November 2023 delivery contract. However, this did not happen on November 28 but rather consistently from the month of September. Analyzing individual futures contracts allows for a more precise dating of the phenomena governing coil prices in the American market.
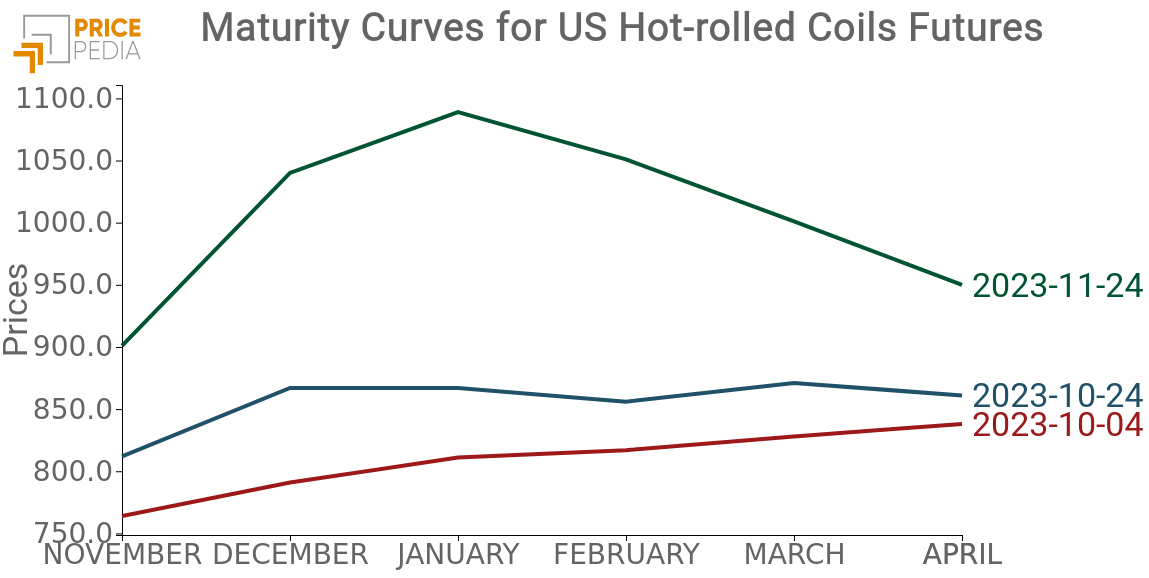
To delve deeper into this aspect, we have constructed the curve for the expiration of futures contracts. This curve depicts the expiration dates of the various contracts on the x-axis and their respective prices on a specific observation date on the y-axis.

Observing the above graph, you can see how the trend of futures contracts changes based on the date under consideration. Until October 4, 2023, the expiration curve is positively sloped, with prices of contracts with later expiration dates higher than those with closer expiration dates. From October 24, the expiration curve begins to change, eventually showing a particularly unusual shape. Prices of futures contracts rise until the January contract and then decline for the subsequent months. The graph clearly indicates that market participants anticipate an increase in coil prices for the last months of the year, followed by an expected decline. This shift signals that some significant event occurred in the American market between October and November, significantly altering financial market expectations.
We now proceed with the reconstruction of what happened on each of these dates to understand the factors that influenced the expiration curves of HRC futures.
On October 4, 2023, there was an increase in demand due to Cleveland-Cliffs' announcement of future increases in the prices of hot-rolled steel (Source: GMK Center). During this period, producers had already filled their order books with large volumes at prices considered too low (around $650/ton). Additionally, a strike by the United Auto Workers (UAW) against Ford, General Motors (GM), and Stellantis was ongoing. Order fulfillment times had increased to 7.2 weeks compared to the previous 5 weeks.
These factors caused the expiration curve of futures contracts to take on a positive slope.
On October 24, 2023, Argus published the following article: US HRC: Mills secure price increases, noting that some mills would not be able to supply materials for the rest of the year. However, steel mills remained confident in fulfilling their coil orders by the end of the year. Other details in this article include the completion of maintenance shutdowns, which had reduced production in September and October, and the expectation of coil exports from South Korea between late January and February 2024.
These details align perfectly with the new trend in the expiration curve on October 24 (blue curve) described earlier.
On November 24, 2023, the expiration curve began to exhibit two much more pronounced dynamics compared to those recorded at the end of October – one bullish and the other bearish. The coil prices continued to rise until January, followed by a sharp decline. The significant price increase was caused by further deterioration in delivery times, leading financial market participants to believe that mills would not be able to meet demand by December. The subsequent price decline was due to the arrival of new exports to the U.S. market from South Korea, expected to be sufficient to meet the demand for coils.
Conclusions
This analysis reveals how the dynamics of increasing prices for hot-rolled coils in the U.S. market are linked to a short-term dynamic characterized by a temporary supply shortage.
Since the price of European coils tends to follow that of the USA, this analysis suggests that recent increases in coil prices in Europe could also be temporary and may experience a decline during the upcoming spring.


