Contrasting drivers in commodity markets
Weak demand for commodities mitigates the effects of geopolitical tensions
Published by Luca Sazzini. .
Conjunctural Indicators Commodities Financial Week
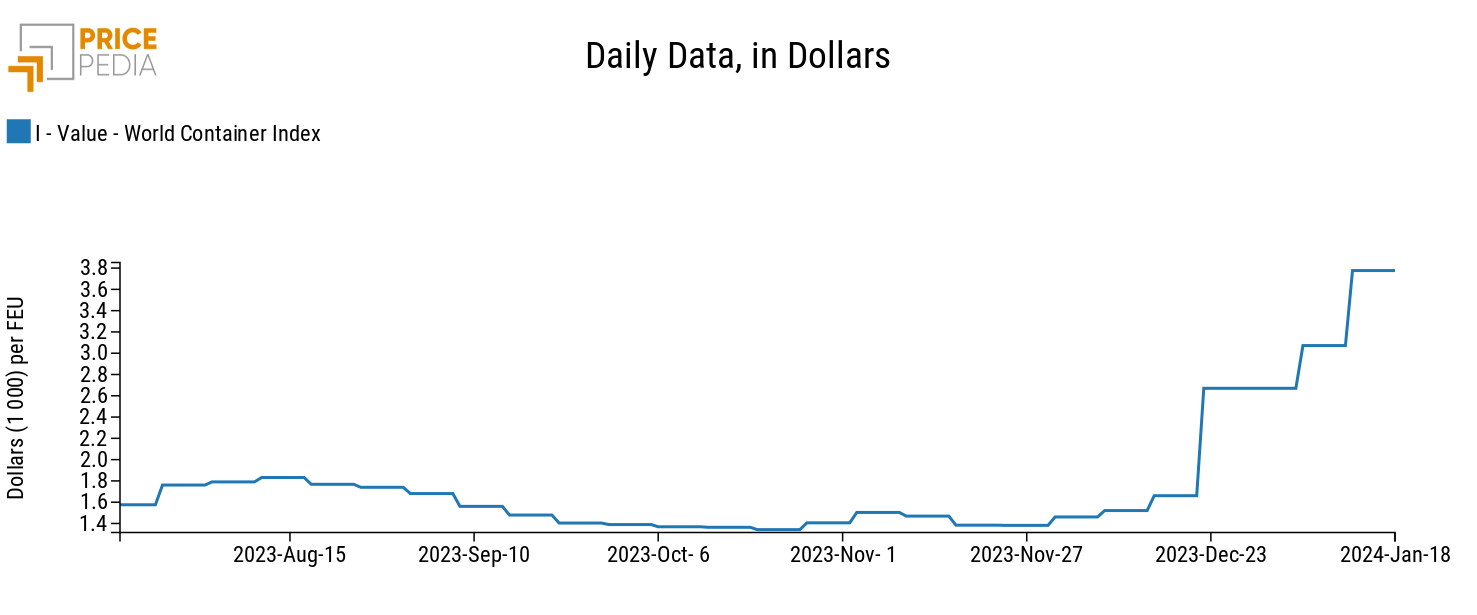
The escalation of the crisis on the Red Sea is worsening week by week, with new Houthi attacks on American ships. This strong geopolitical crisis continues to increase the prices of naval freight for container ships passing through the Red Sea.
The World Container Index, the index most followed by economist analysts on the global dynamics of maritime transport costs, continues to grow with very strong dynamics, reporting 30-day variations of 127%.
World Container Index
Below is also a table with the monthly changes in prices of the main commercial routes departing from Shanghai.

Source: PricePedia calculations based on Drewry data
The table shows that in the last month the prices of the Shanghai-Rotterdam and Shanghai-Genoa routes, those most affected by the Houthi attacks, have more than doubled their prices. Also the Shanghai-Los Angeles route, which does not pass through the Red Sea, however in the last month it has undergone a variation of more than 40% due to the worsening of logistics worldwide.
These continuous attacks on ships reduce the security of raw materials, especially energy ones, creating the conditions for their possible increase.
Currently the prices of raw materials, albeit with some fluctuations, remain fairly stable due to the drop in demand due to the current economic weakness. However, uncertainty remains high in the commodity market, also increased by current weather data which significantly influences energy consumption and the supply of food goods.
Commodity market performance
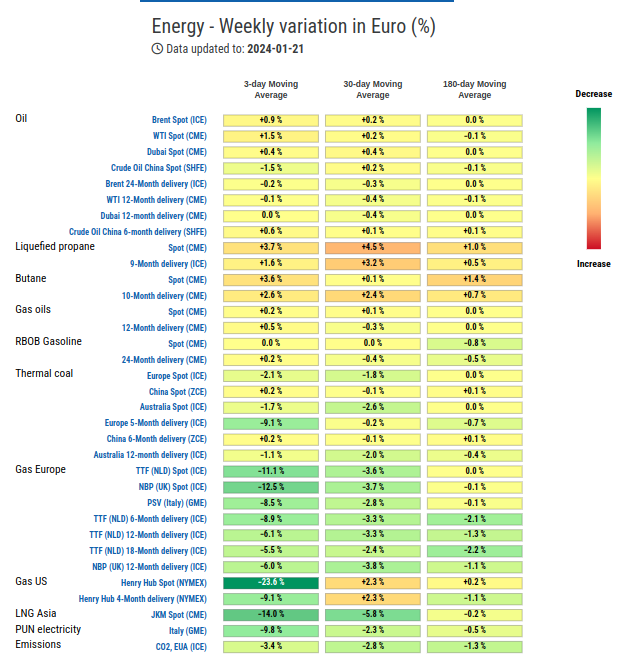
The energy sector is currently characterized by contrasting price dynamics: on the one hand there is a slight increase in the price of oil and its derivatives, on the other there is a reduction in the prices of natural gas.
Although the current economic weakness continues to prevent significant growth in oil prices, the greater geopolitical risks combined with the interruption of oil production in the Bakkern in North Dakota, due to the current freezing climate in the United States, have contributed to generating of slight positive fluctuations over the course of this week.
European natural gas prices (TTF Netherlands) and American gas prices have recorded weekly drops of more than 10% due to better weather forecasts predicting milder weather at the end of January.
The prices of ferrous metals remain relatively stable, while non-ferrous metals continue their current trend of price reduction.
Different price dynamics continue to be recorded among food products: tropical foods continue to grow, while the prices of some cereals, such as corn, record a decline due to the new upward production estimates provided by the USDA (United States Department of Agriculture).
Weak GDP Growth in China
According to the National Bureau of Statistics, China's GDP grew "only" 5.2% in 2023.
The figure appears to be above the government's objective, which had set a GDP growth objective of 5%, but is below the analysts' estimate, who expected growth of 5.3%, and, above all, confirms a China's economic recovery is still weak.
ENERGY
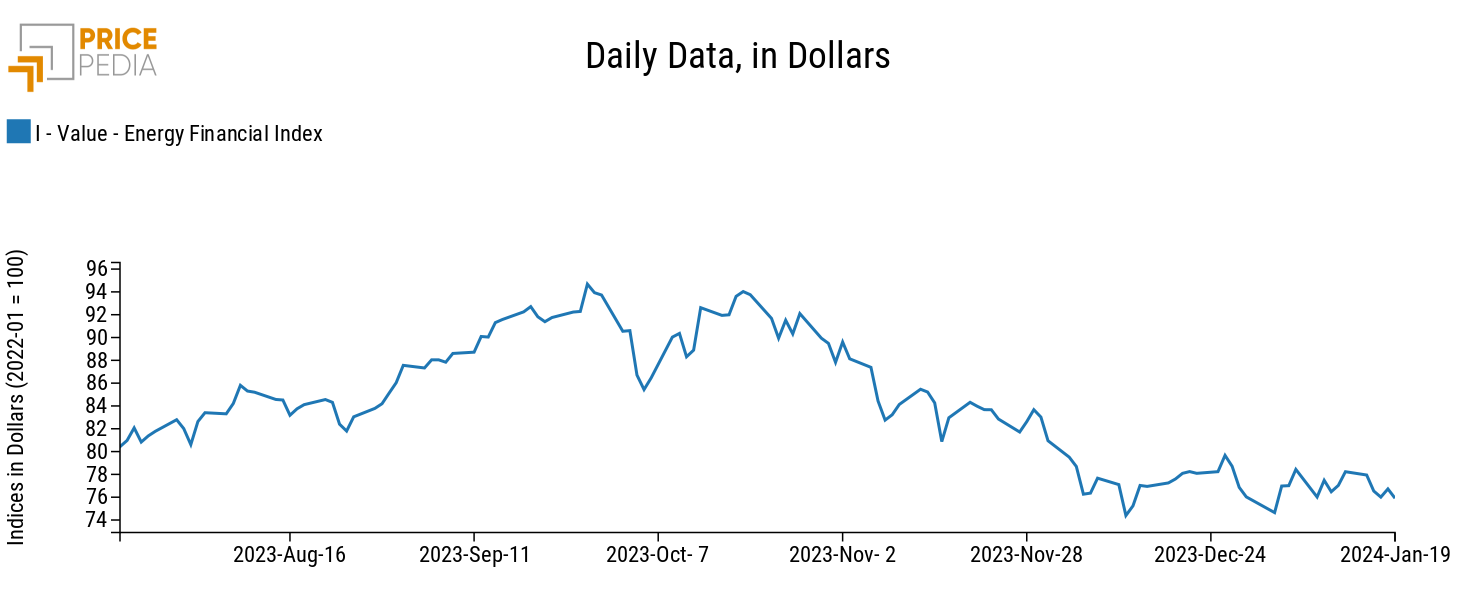
This week the PricePedia energy financial index continues its sideways movement.
PricePedia Financial Index of energy prices in dollars
The heatmap of energy products signals on the one hand the increases in the three-day moving averages of oil prices and on the other the collapse in gas prices.
HeatMap of energy prices in euros
PLASTIC MATERIALS
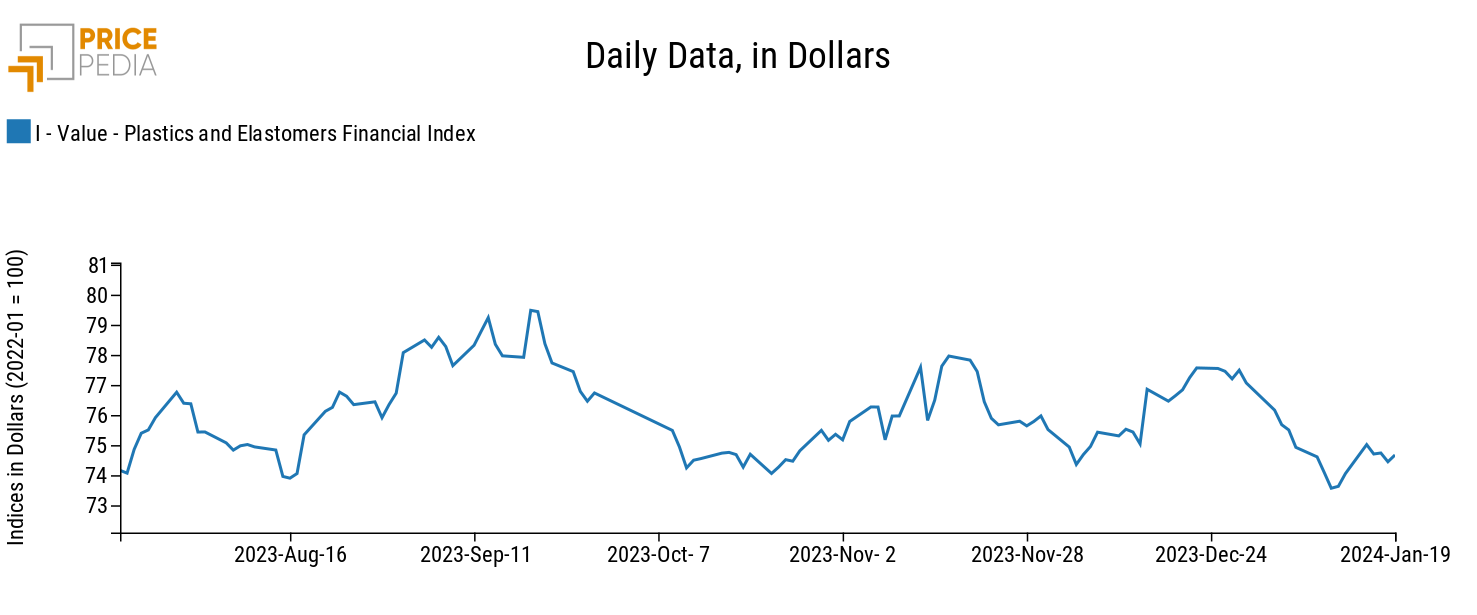
After a rise in prices between last weekend and Monday, the financial index of plastic materials listed in China returns to stabilise.
PricePedia Financial Index of dollar prices of plastic materials
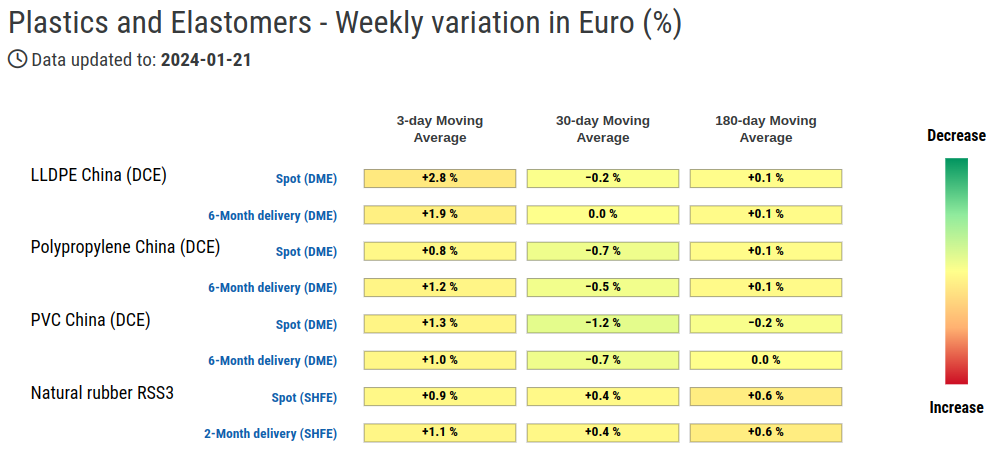
The heatmap below shows the changes in euro prices of the plastic materials contained in the index.
All prices contained in the index recorded an increase caused by the recent recovery that occurred between last Thursday and Monday.
HeatMap of plastics prices in euros
FERROUS METALS
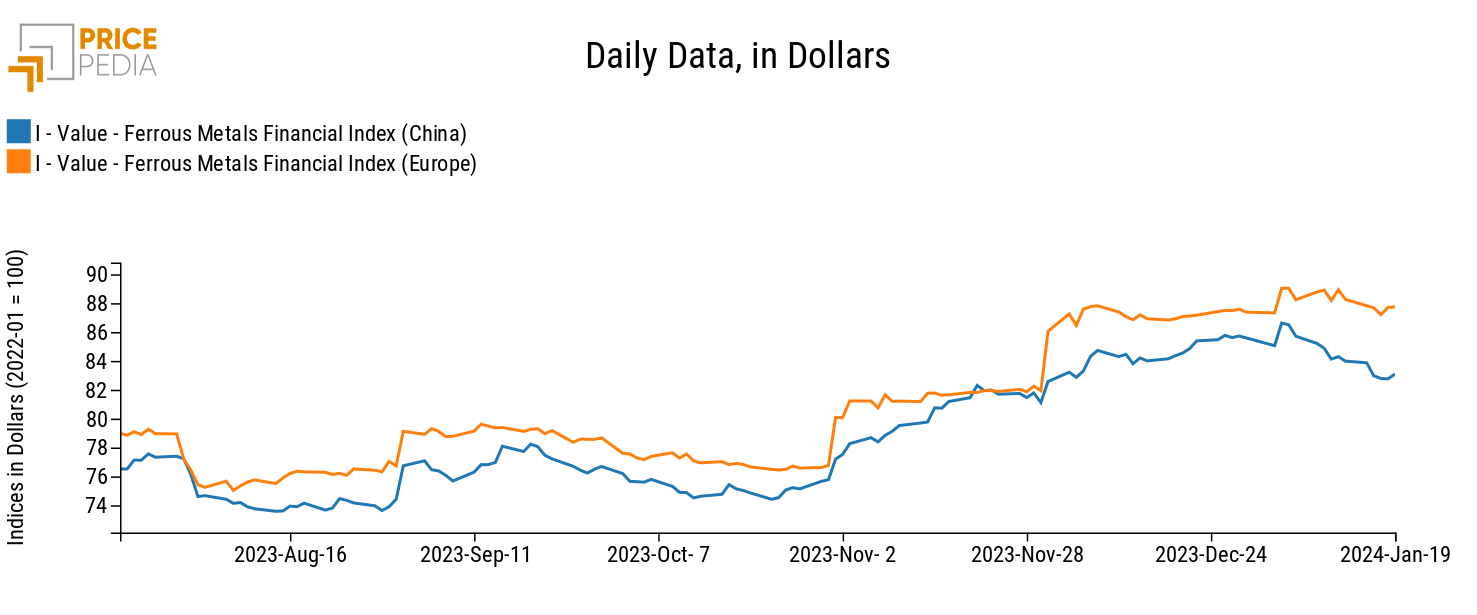
The two financial indexes of ferrous products continue to move apart, with the Chinese ferrous index recording a greater drop in prices.
PricePedia Financial Indices of dollar prices of ferrous metals
INDUSTRIAL NON-FERROUS
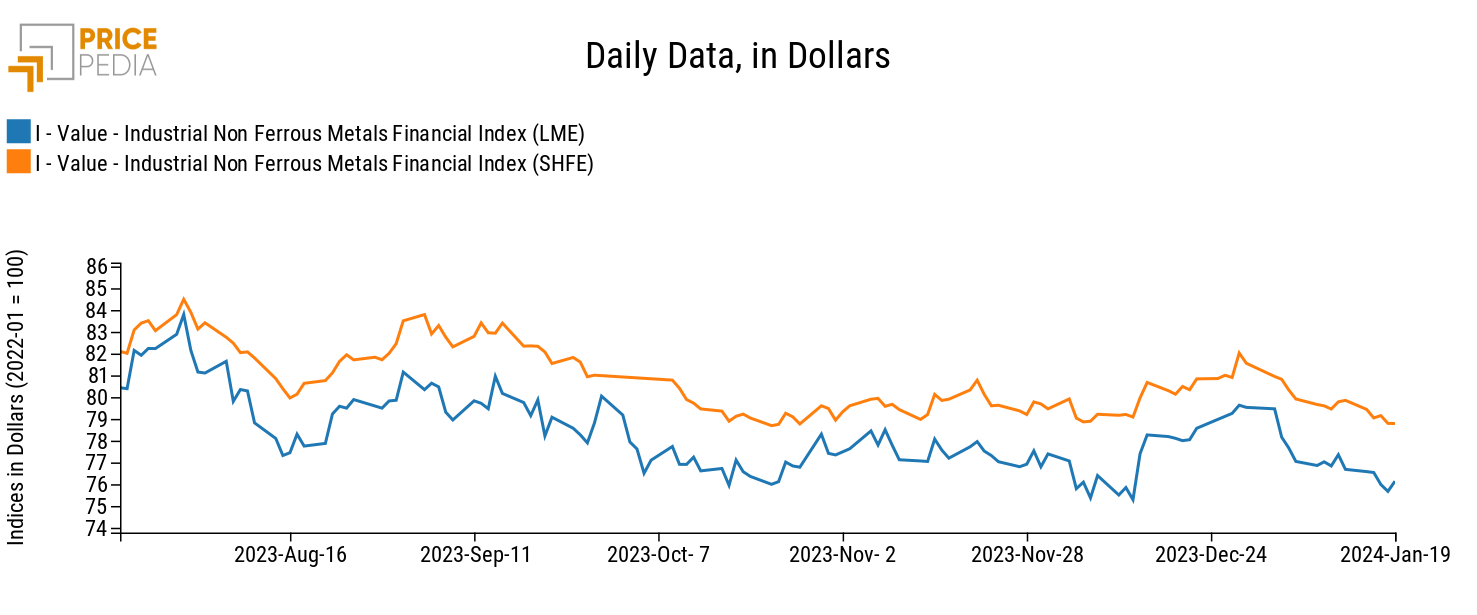
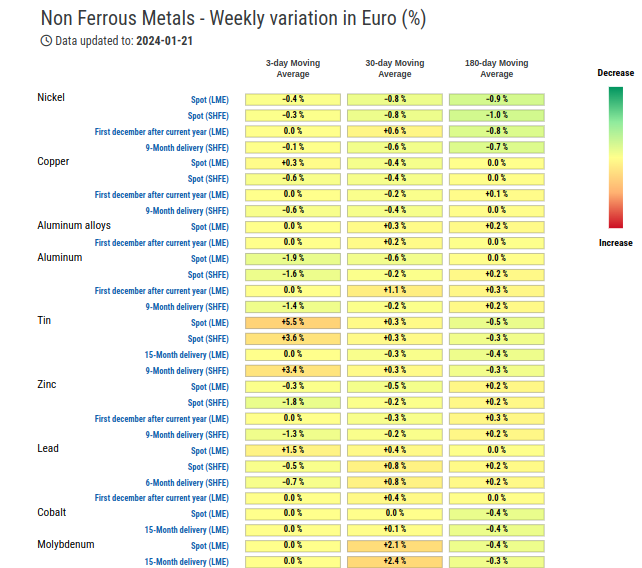
Both industrial non-ferrous indexes record a phase of price decline driven mainly by aluminum prices. Data from the National Bureau of Statistics (NBS) recorded China's primary aluminum production rising 3.7% year-on-year to a record 41.59 tonnes in 2023, leading to a drop in prices.
On last Wednesday, copper prices also began to decline due to new data from China which continues to underline the current phase of economic weakness. According to analysts, copper demand will not be able to recover by the second quarter of 2024, a period in which a possible rate cut by the main central banks can be expected.
PricePedia Financial Indices of dollar prices of industrial non-ferrous metals
The heatmap shows an increase in tin prices compared to a drop in aluminum prices.
HeatMap of industrial nonferrous metal prices in euros
FOOD
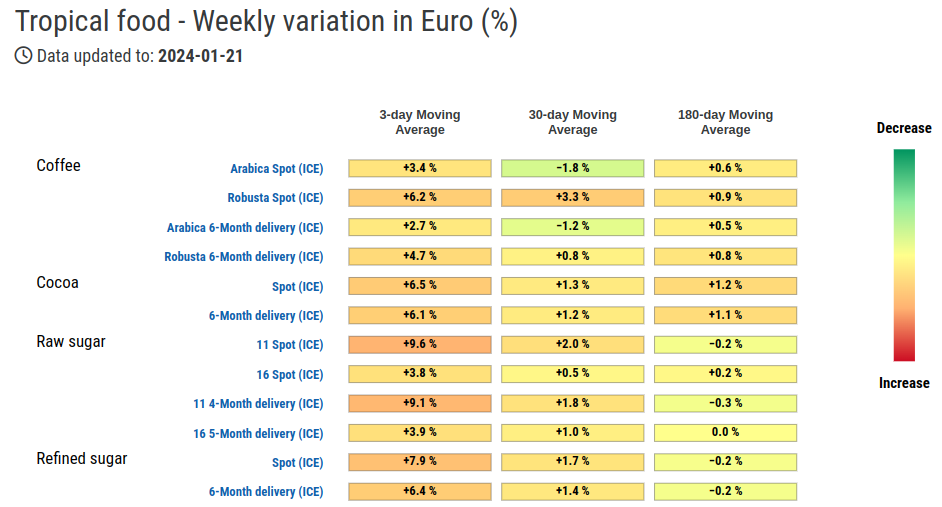
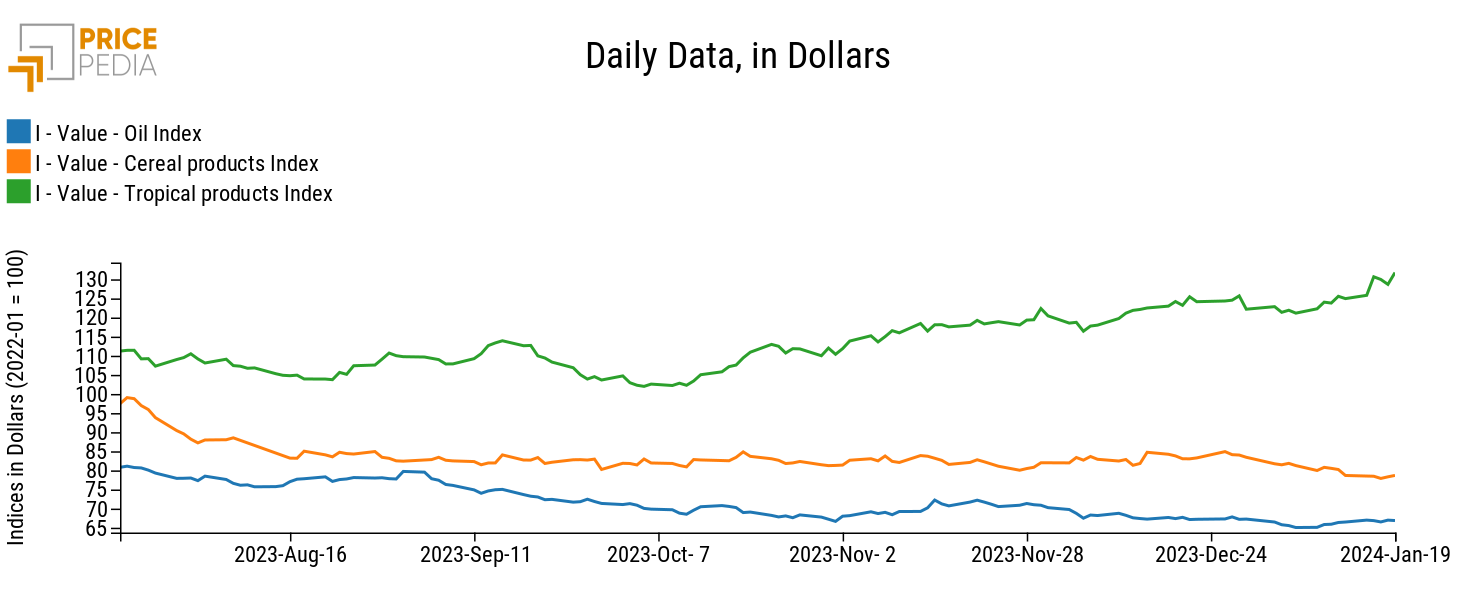
The cereal index is characterized by a phase of decreasing prices, while the tropical index does not deviate from its upward trend, albeit with a slight decline towards the weekend.
The oil index records small price fluctuations that do not outline a well-defined dynamic.
PricePedia Financial Indices of food prices in dollars
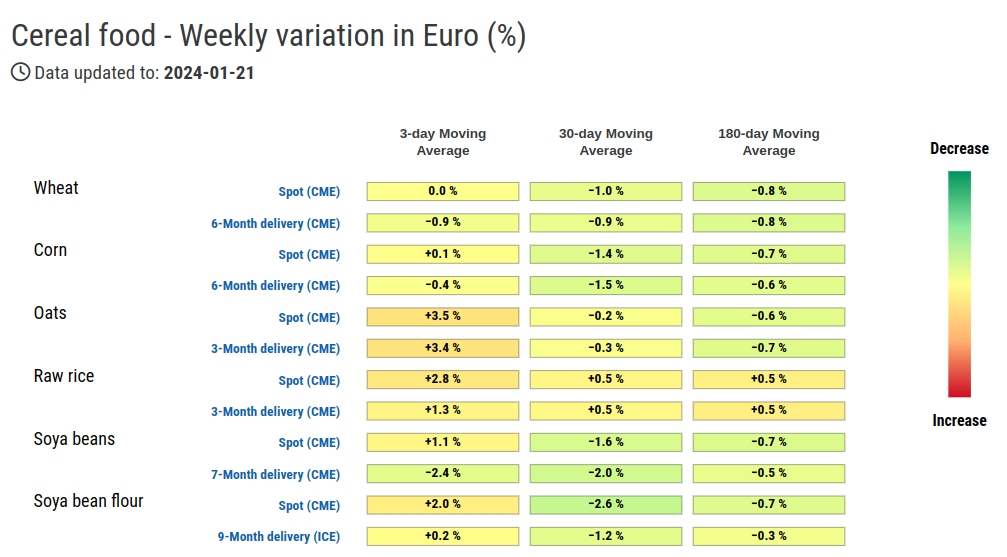
The cereal heatmap reports negative weekly variations for the prices of wheat, corn and oats, compared to a positive variation for the price of rough rice.
HeatMap of cereal prices in euros
All prices in the tropical food heatmap show an increase in the moving average except for the spot price and the 6-month future on Arabica coffee.
HeatMap of tropical food prices in euros
