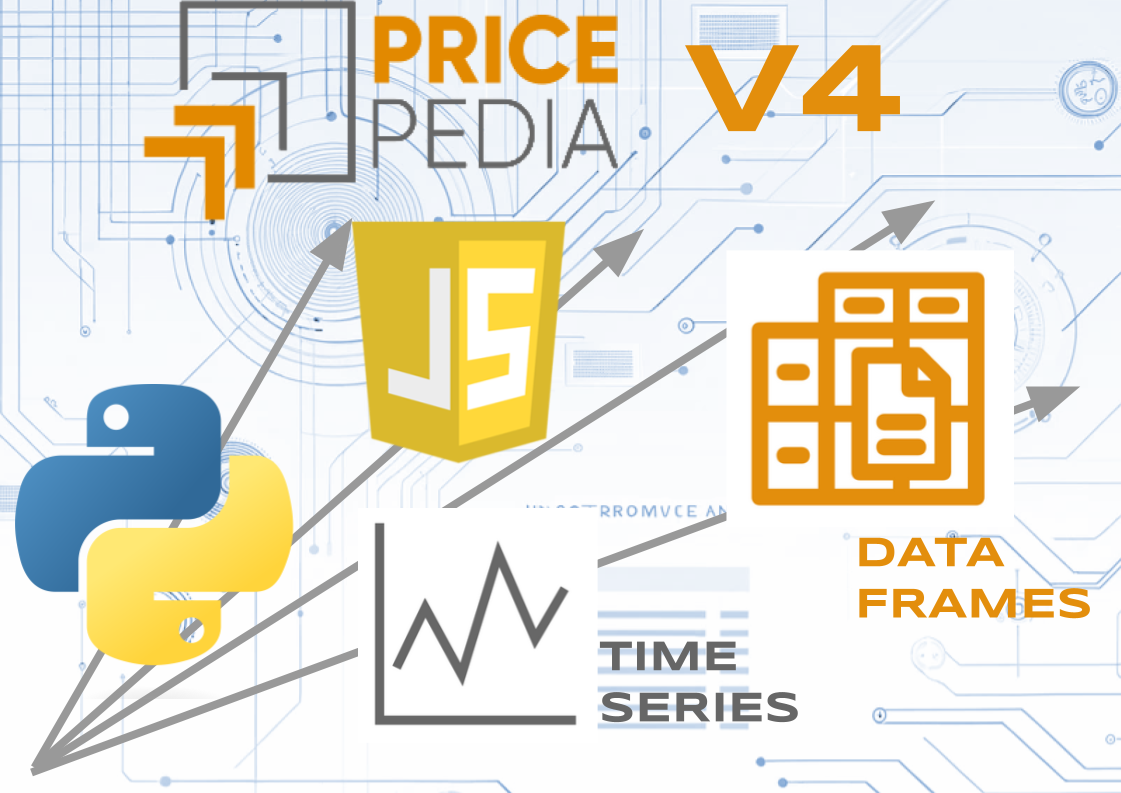
Technological development of PricePedia V4
The basis of the new version are a more efficient data structure and the wider use of JavaScript
Published by Luca Surace. .
Strumenti Analysis tools and methodologiesIn the transition from the V3 version to the V4 version, PricePedia not only expanded the database made available to users and added new functionalities, but also profoundly changed the technology used, creating the prerequisites for a long development path. The changes mainly concerned two areas[1]:
- the transition of the basic data structure from time series to dataframes;
- the use of the JavaScript programming language not only to manage the dynamic aspects of the platform but also for data processing, partially replacing the Python language.

From time series to data frames
Time Series
A time series is a chronologically organized sequence of data, typically used to analyze the trends of a variable over time. It is structured with a time index, representing an ordered sequence of time periods (for example, days, months, years), and a series of numerical values, representing the observations or measurements taken in each of these periods. This structure allows for the observation of trends, patterns, and anomalies over time, facilitating statistical analysis and future forecasting based on historical data.
One limitation is that it does not allow for associating multiple related measurements with the same observation. Consider, for example, futures prices with different maturities for the same underlying asset, like futures on Brent crude oil prices. If one wishes to store in files, separate for each time series, the various daily price observations of the dozens of futures by maturity quoted on the IntercontinentalExchange (ICE), it is necessary to define a file for each future. This solution is not scalable for two reasons. The first, of a computational nature, concerns the cost that the multiplication of files has in terms of data management and access speed. The second, more important, concerns the user experience, with the proliferation of available choice options, increasing the complexity of the search system.
The Dataframe structure allows this limitation to be overcome.
Data Frames
A DataFrame is an advanced tabular structure for organizing data, in which each row is identified by a unique index (similar to the index of a time series), and each column is also labeled with a specific index. This structure allows for the efficient representation and management of different variables collected in the same time period. The key to this structure is the ability to keep information aligned by date of observation. It facilitates data exploration, manipulation, and analysis, making it an indispensable tool in the field of data analysis and statistics.
In the case of Brent futures prices, a single DataFrame is sufficient to manage the data of all futures prices, identified by different columns.
This simplifies the computational management of data, but above all, it simplifies the user's search for individual data. It can occur in two subsequent steps: first, the product "Brent crude oil" is identified, and only afterwards are the futures of interest selected.
The possible applications of DataFrames are numerous. Columns can be used to collect different measurements of the same price, such as the Last Price EU or the Historical EU within the context of customs source prices, or the recording of prices of the same phenomenon made in different countries, such as the production prices from Eurostat sources related to various European countries.
From Python to JavaScript
Python is widely recognized as an excellent programming language for data processing and analysis. However, running Python directly in the browser requires technologies that are not fully mature. As a result, Python-based features on a website require communication between the user's browser and a dedicated server. This client/server architecture, although effective, has limitations: managing communication between client and server can lead to high wait times and, moreover, by not leveraging the computing capacity of the user's device, there is a risk of overloading the server during traffic spikes on the platform. In the V4 version of PricePedia, many data processing functions, such as currency conversion or the transformation from level to index of time series, have been transferred from the server to the user's browser. However, since the most commonly used browsers do not directly interpret commands in Python language but natively execute commands in JavaScript, the functionalities originally written in Python have been converted to JavaScript, taking advantage of the wealth of libraries and the flexibility that the use of this language entails. This approach significantly reduces the need for client/server communications and improves the responsiveness of the application.
This change, along with the adoption of DataFrames, has opened up many development possibilities, as demonstrated by the new Table feature in the PriceData section, accessible from the View menu in the top navigation bar
Conclusions
The primary mission of PricePedia is to enable procurement offices to easily access all the useful information for their decisions, obtainable through the processing of available data. Until now, the improvement of PricePedia has consisted of a gradual expansion of the available data and the growth of increasingly effective functionalities for collecting and organizing information: from simple statistical elaborations, to the visualization of data in various types of graphs; from data transformation to the construction of explanatory tables; from univariate forecast analysis to dynamic specification forecasting models.
With version V4, PricePedia has overcome some limitations that could have slowed down the improvement process, entering a space, almost unlimited, of possible developments.
[1] For a fuller description of the V4 version of PricePedia, see the article PricePedia V4: more data and new tools.


