Flat start for commodity prices at the beginning of the year
PricePedia's Monthly Update for February 2024
Published by Pasquale Marzano. .
EU Customs Global Economic Trends
The monthly price update of PricePedia commodities for February 2024 paints an uncertain picture compared to the initial weak growth signals observed in January. From the perspective of the current global economic cycle, the signals are indeed conflicting: positive for the American market, yet negative or stagnant for the European and Chinese markets (see the weekly update Commodities recovery still seems far off).
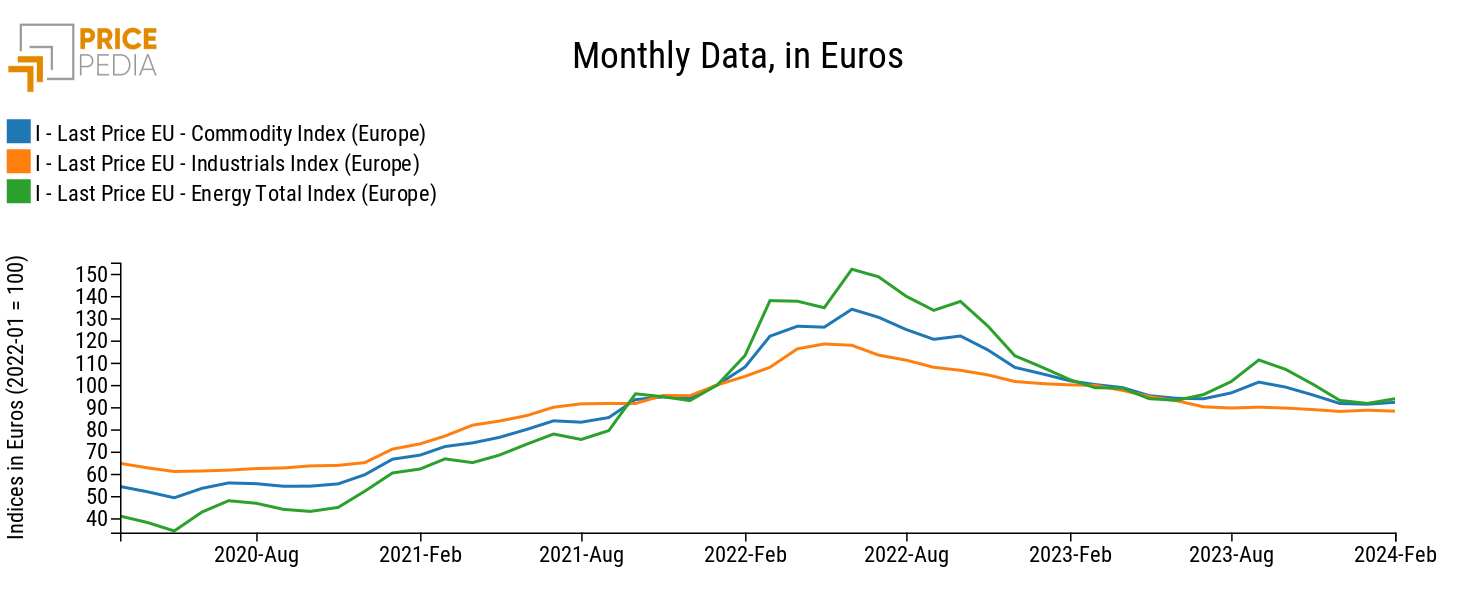
In this context, European commodity prices are fluctuating, experiencing alternating increases and decreases around the levels recorded in recent months. The following chart shows the Commodity[1], Industrials[2], and Energy aggregated PricePedia indices.

The Commodity index shows a slight increase in February 2024, below +1%. However, the average levels remain lower than those in the summer of 2023, when the declining trend in prices partially halted, coinciding with increases in crude oil prices. During that phase, OPEC+ countries had voluntarily reduced crude oil supply to support prices. Nevertheless, weak demand rendered this strategy futile, and oil prices resumed their decline in the following months.
As for core industrial commodities, since the summer of 2023, there has been a "sideways" movement in prices. As described in the November 2023 update (see Fifth month of stability in the physical prices of industrial commodities), this price dynamic suggests that a price floor has been reached given the current conditions of the global industry.
This is particularly evident in the following table, which shows the month-on-month percentage changes in euros for the three aggregated indices.
Table 1: Indices, in euros, Monthly Changes (%) compared to the previous month, August 2023 - February 2024
| 2023-08 | 2023-09 | 2023-10 | 2023-11 | 2023-12 | 2024-01 | 2024-02 | |
|---|---|---|---|---|---|---|---|
| I-Last Price EU-Commodity Index (Europe) | +2.79 | +5.05 | −2.20 | −3.61 | −3.99 | −0.37 | +0.96 |
| I-Last Price EU-Industrials Index (Europe) | −0.60 | +0.43 | −0.46 | −0.76 | −0.94 | +0.62 | −0.46 |
| I-Last Price EU-Energy Total Index (Europe) | +6.10 | +9.58 | −3.76 | −6.33 | −7.22 | −1.46 | +2.32 |
The table highlights the stability of the Industrials index: since August 2023, it has recorded changes consistently below 1% in absolute terms.
On the other hand, the Energy index shows greater volatility, affecting the Commodity index. The latter marks a +1% increase in February compared to the previous month.
Do you want to stay up-to-date on commodity market trends?
Sign up for PricePedia newsletter: it's free!
Commodity Prices by Category
Conjunctural dynamics
The chart below illustrates the month-on-month changes in February 2024 compared to January 2024 for prices in euros related to the aggregated indices of PricePedia categories.
Graph 2: February 2024, variations (%) in euro with respect to January 2024
Source: PricePedia
The month-on-month price changes for individual categories confirm what indicated by the Industrials index. In absolute terms, there are contained variations below 3%.
The decreasing trend in raw material prices, which began at the end of 2022, seems to have come to an end, giving way to a period of stability.
Trend Analysis
However, it is worth noting that the price levels reached are still well above the pre-pandemic levels of 2019.
The percentage changes in the average prices of individual categories, compared to the 2019 average, are shown below.
Graph 3: February 2024, variations (%) in euro with respect to 2019 average
Source: PricePedia
Compared to 2019, Food prices have the largest gap (over +45%), followed by Inorganic Chemicals, Iron and Steel, Energy, and Non-Ferrous Metals (over +35%). The remaining categories, except for Textile Fibers, which show a relatively contained gap of +5.8%, range between +25.4% for Precious Metals and +14.4% for Plastics and Elastomers.
1. The PricePedia Commodity index is the aggregation of Industrials, Food and Energy indices.
2. The PricePedia Industrials index is the aggregation of indices related to the following categories: Ferrous Metals, Non-Ferrous Metals, Wood and Paper, Chemicals: Specialty, Organic Chemicals, Inorganic Chemicals, Plastics and Elastomers, and Textile Fibers.
Pasquale Marzano
Economist and data scientist. At PricePedia he deals with the analysis of commodity markets, forecasting models for raw material prices and management of reference databases.


