Price supercycle and theoretical market model
Modifications to the theoretical market model necessary to account for the supercycle
Published by Matteo Nascone. .
Supercycle Analysis tools and methodologiesThe objective of the energy transition foresees significant increases in the consumption of many commodities in the coming years. Many analysts tend to associate, uncritically, a new commodity price supercycle with these increases. However, this scenario falls within the realm of possibilities, while its likelihood depends on many factors that warrant further investigation[1].
The term supercycle refers to the period from 2003 to 2008 when there was a prolonged phase of commodity price growth, driven by a high, and partly unexpected, demand in China, with no swift adjustment on the supply side. As we will see later, the theoretical model explaining the evolution of a commodity market does not inherently provide an explanation for prolonged phases of price increases. Therefore, it can be useful to analyze the necessary modifications to the theoretical market model to account for a supercycle, with reference to the period from 2003 to 2008.
Theoretical model of the commodity market
In the economic literature, the most commonly used model to describe the global market of a commodity is that of perfect competition or pure competition.
The main characteristics of the perfect competition model are as follows:
- Multiple sellers and buyers: in a competitive market, there are typically numerous producers and consumers participating, meaning that no single firm has significant control over the price or quantity exchanged (absence of market power). Additionally, there are no significant barriers to entry or exit from the market.
- Product standardization: the perfect competition model is also characterized by the presence of homogeneous products, meaning standardized goods, much like commodities.
- Perfect information: buyers and sellers have access to complete and transparent information about prices and market conditions. Exchanges play a prominent role in this context by making transaction prices public. Furthermore, the absence of informational asymmetries allows for the formation of a unique market price.
- Absence of significant transaction costs: costs associated with buying and selling commodities are generally low.
In a perfect competition model, one can distinguish between short-term and long-term equilibrium to understand how economic variables adapt and evolve over time. In the short term, some variables may be fixed or inelastic, meaning they cannot easily be adjusted to changes in market conditions. For example, the production capacity of firms might be limited, and they may not be able to immediately alter their production in response to price or demand fluctuations. These observations suggest that in the short term, an increase in demand may not result in increased production but rather in higher prices.
Conversely, in the long term, variables that were fixed in the short term become flexible. Firms can adjust their production capacity, enter or exit the market, allowing the market to fully adapt to demand and supply conditions. In the long term, unlike the short term, increases in demand primarily lead to an increase in supply rather than prices.

These final considerations are useful for explaining the behavior and dynamics of prices over time and contribute to the formation of a sinusoidal price dynamics. The sinusoidal shape of historical price series is indeed determined by the intersection of a long-term curve, where the price is fixed, with short-term equilibriums where the price increases due to rising demand.
This price dynamics, characterized by a sinusoidal shape, has been a feature of most individual prices in various periods from the post-war era to the present day, including the aggregate prices of commodities, as depicted in the graph below.

The chart displays the year-on-year percentage changes (y/y) in the total prices of commodities in dollars from 1961 to the present, adjusted for changes in consumer prices in the United States. Naturally, when the histograms are positive, it indicates that commodity prices increased more during that phase than consumer prices; conversely, negative histograms signify a decrease in commodity prices relative to consumer prices.The chart clearly highlights the alternating phases of price increases and decreases. There is only one period in the last 60 years where prices systematically increased over an entire five-year span. This is the period from August 2003 to July 2008, known as the supercycle.
The following table also presents the monthly percentage changes in PricePedia customs prices for the total commodities during the period related to the supercycle.

If we examine the period of the supercycle in terms of monthly percentage changes, we can observe that between August 2003 and July 2008, in 45 out of the 60 included months, prices experienced a positive variation, totaling an overall growth of over 100%.
Changes to the theoretical model
We have seen that according to the theoretical model of competitive markets, in the long term, in response to a change in demand, it is supply that varies and not prices. Generally, an increase in demand initially results in a price increase, followed by an adjustment in supply, the growth of which tends to bring prices back to their equilibrium value. In the context of perfect competition, certain determinants can distort this theoretical model and potentially contribute to a price supercycle. These determinants may include:
- Repeated external shocks: unforeseen events (socio-political, wars, pandemics) can impact the supply side. The reduction in supply, unable to meet demand, will consequently lead to an unexpectedly intense price growth.
- Structural market changes: the introduction of entry barriers or the adoption of other protectionist policies can reduce competition and maintain high prices for an indefinite period. Government interventions could thus influence business behavior and trigger a supercycle.
- Expectations and uncertainty: in the presence of informational asymmetries, firms with privileged information may adopt opportunistic strategies affecting supply, preventing the attainment of long-term equilibrium. Moreover, if the expectation of demand growth occurs with a certain degree of uncertainty, a potential increase might not be met with a corresponding supply growth, resulting in particularly high prices.
Commodity markets during the supercycle
The commodity price supercycle, which occurred between 2003 and 2008, represents a period of significant global increases in commodity prices. The driving force behind the sharp price surge was the boom in the Chinese industry. During this period, China experienced unprecedented economic growth, with an average GDP growth rate of around 10% annually. China assumed a leading role, exerting a significant impact on the demand for various commodities on an international scale.
Chinese imports of raw materials in the decade from 2001 to 2011 tripled, leading to a 30% increase in global commodity demand. In the peak period of the global cycle, between the summer of 2003 and the summer of 2008, Chinese industrial activity levels rose at annual growth rates approaching 20%.
China, with its rapid economic growth and massive urbanization, was a fundamental catalyst in shaping the commodity supercycle. The increasing demand for resources, fueled by infrastructure construction, industrialization, and improved living standards, exerted significant pressure on global supply, leading to a rise in commodity prices.
While Chinese demand was growing rapidly, the commodity industry struggled to keep pace, hindered by structural constraints, lack of investment, and logistical obstacles. Another contributing factor was financial speculation that helped keep prices high. Investors and traders saw the rising prices as a profit opportunity, further fueling demand and maintaining elevated price levels.
Finally, dollar prices were affected by the depreciation of the dollar, dropping from 1.11 dollars per euro in August 2003 to 1.58 dollars per euro in July 2008.
The consequences of this supercycle have been complex and varied. On one hand, commodity-exporting countries benefited greatly from unexpectedly high profits, while on the other hand, importing countries faced economic challenges and inflation. Moreover, the inability to adjust the supply promptly to growing needs amplified the effect of the supercycle, making commodity markets more vulnerable to fluctuations and crises.
Do you want to stay up-to-date on commodity market trends?
Sign up for PricePedia newsletter: it's free!
Conclusions
In conclusion, the commodity price supercycle between 2003 and 2008 was largely fueled by China's insatiable demand, but the lack of synchronized supply contributed to creating instability that had global repercussions. This historical episode highlighted the possibility of prolonged imbalances between demand and supply in commodity market dynamics.
From an analytical point of view, it is only through a thorough understanding of the factors affecting demand and supply that one can explain why commodity prices increased over the long term with such intensity.
[1] For an analysis of the impact of the energy transition on commodities, see the article "Will the energy transition process generate a new super cycle in commodity prices?".
You may be interested in:
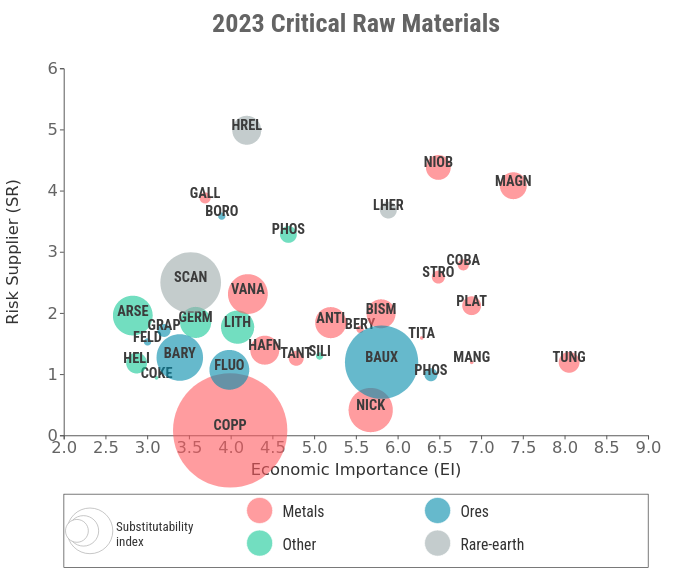
Critical Raw Materials: the importance of substitutes
Published by Matteo Nascone. .
Supercycle Critical raw materialsSubstitutability also plays an important role in determining the criticality of a raw material [ Read all ]

Will the energy transition process generate a new super cycle in commodity prices?
Published by Luca Sazzini. .
Supercycle Analysis tools and methodologiesIn market analyses, experts are scrutinizing the dynamics of supply and demand in the commodity sector. They're pinpointing factors that could disrupt the market balance, leading to notable price fl}... [ Read all ]

Supercycle or just in case
Published by Luigi Bidoia. .
Forecast Supercycle ForecastBoth factors appear to have contributed to the strong rise in commodity prices [ Read all ]