Different dynamics of commodity prices pending news on monetary policy
Rising likelihood of interest rate cut delay
Published by Luca Sazzini. .
Conjunctural Indicators Commodities Financial WeekDynamics of US Inflation
New data regarding the dynamics of US inflation signal a further increase in prices in the month of February.
According to the data from the US Consumer Price Index (CPI), the growth of headline inflation was 0.4% m/m, in line with analysts' expectations. However, slightly higher than expected is the data for the core CPI1, which recorded an increase of 0.4% m/m, compared to the expected 0.3% m/m.
Analyzing the year-on-year data, the situation is not any better: the general price index shows an increase from 3.1% to 3.2% y/y, while the core index slows down, but less than expected, reaching a value of 3.8% from 3.9% y/y.
The main cause of persistent inflation is still attributed to non-housing services which continue to record a growth rate of 0.6% m/m. Housing services, on the other hand, although growing slightly less, still register growth rates that are too high, around 0.4% m/m and 5.7% y/y. Additionally, there is also a recovery in energy prices, which, due to the increase in gasoline, record a monthly growth of 2.3%.
These data indicate that the issue of US inflation is far from being resolved, as the growth of prices from the services side has not shown any signs of stopping yet.
Federal Reserve Monetary Policy
Next week, on March 19-20, the next meeting of the Federal Open Market Committee (FOMC) will take place, from which unchanged interest rates are expected. As with the ECB meeting last week, the importance of observing the Fed's statements will not be so much to confirm the maintenance of current interest rates, but to note whether there will be a change in tone during the official statements. The market expects that, in light of the new data on US CPI, Chairman Powell will show less accommodation compared to the January meeting.
Currently, the market still expects a first rate cut at the meeting on June 12, 2024, with 3 cuts of 25 basis points by the end of this year. However, some analysts have already begun to postpone the rate cut date to the July and September meetings.
In order to predict in advance, with relative certainty, when the first rate cut will occur, it will be fundamental to observe the inflation data for March. It is expected that, like the ECB, the Fed will adopt an approach strictly dependent on the data and, most likely, will avoid explicitly declaring the date of the easing of restrictive monetary policy. If the March data do not show a concrete initial slowdown in inflation, it is very likely that the date of the change in monetary policy will be pushed to July or September.
Commodity Price Trends
In recent times, different price dynamics are intensifying in commodity markets, both in terms of trend (bullish or bearish) and the macroeconomic determinants influencing various price families.
The energy sector appears to be the most sensitive to short-term phenomena and continues to record fluctuations mainly linked to current geopolitical risks.
On the other hand, the metals sector is mainly driven by macroeconomic factors but records trends, also very different, depending on the type of metal considered. The ferrous family is currently characterized by a bearish trend, mainly due to an oversupply resulting from the weakness of Chinese demand. Conversely, non-ferrous metals seem to be starting to follow an upward trend in prices.
Another case concerns the price of gold, considered the ultimate safe haven. This implies that its prices are very sensitive to the course of monetary policy and, in fact, when there was news of a possible rate cut in June, its price increased sharply.
Below is the dynamics of gold prices quoted on the Chicago Mercantile Exchange (CME).
Gold Spot Price quoted on the Chicago Mercantile Exchange (CME)

From the chart, it is evident that after the sharp rise that occurred last week (mostly influenced by statements regarding monetary policy), gold prices continued to fluctuate, remaining around current price levels. Certainly, the news of a possible delay in the first rate cut did not support the recent upward price dynamics of gold.
It is expected that gold prices will continue to remain volatile and strongly linked to upcoming statements regarding monetary policy.
[1] Consumer Price Index purged of its most volatile components: energy and inflation.
ENERGY
This week, the financial index of energy products has recorded an upward turn, attributable to the recent trend in oil prices.
PricePedia Financial Index of energy prices in dollars
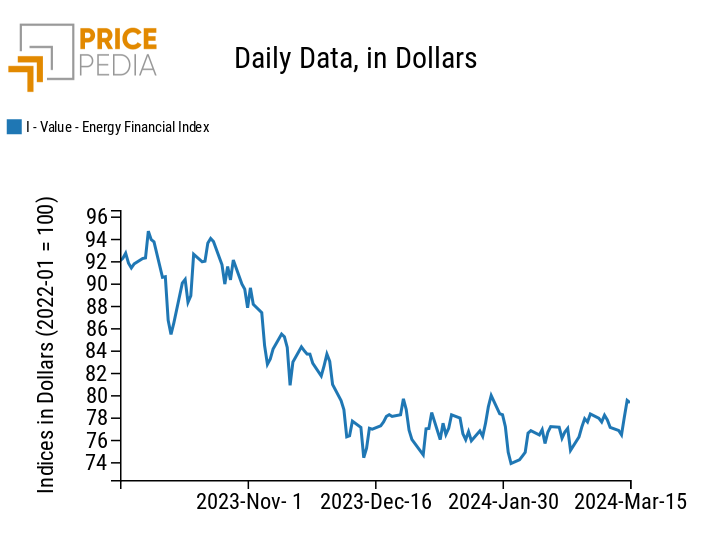
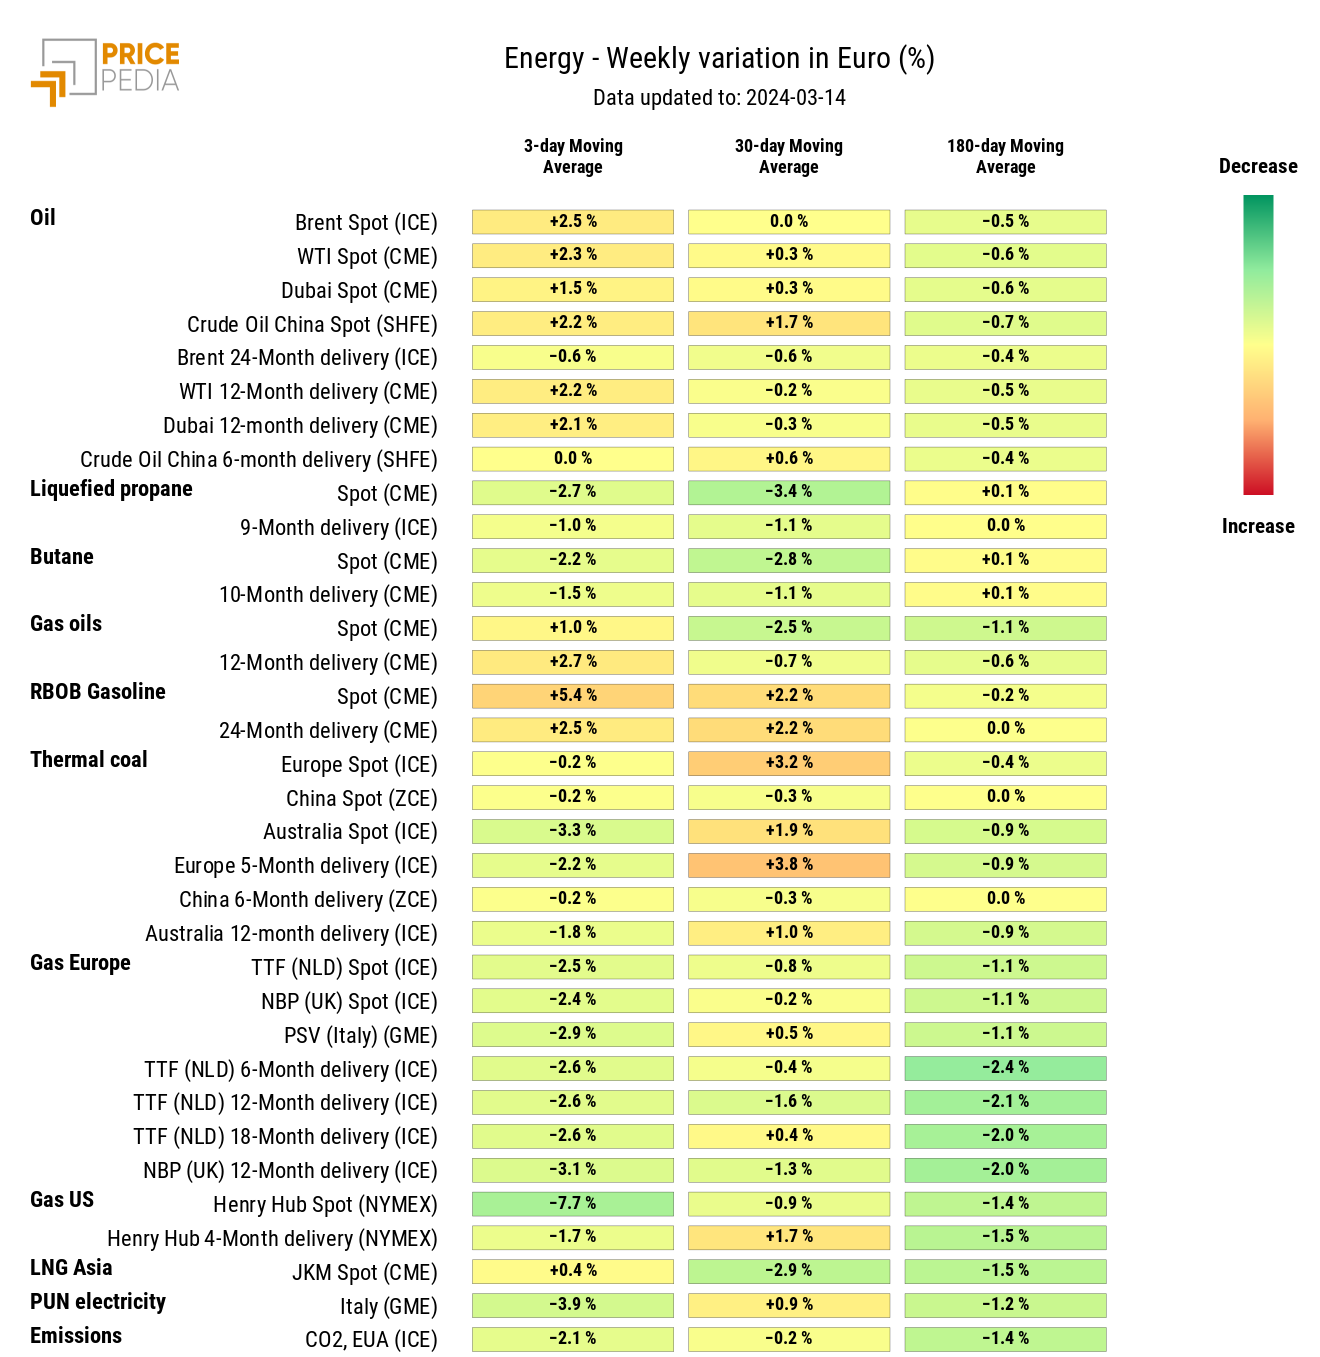
The heatmap of energy prices indicates a weekly increase in the 3-day moving average of oil and its derivatives prices. This growth has been influenced once again by supply restrictions and current geopolitical risks. Supply restrictions stem from the announcement by the Saudi national company Saudi Aramco, stating its intention to reduce crude supply due to maintenance of oil fields. As for current geopolitical risks, the recent drone attacks by Ukrainian drones on 3 Russian oil facilities have strongly contributed to the recent increase in oil prices.
HeatMap of energy prices in euro
PLASTICS
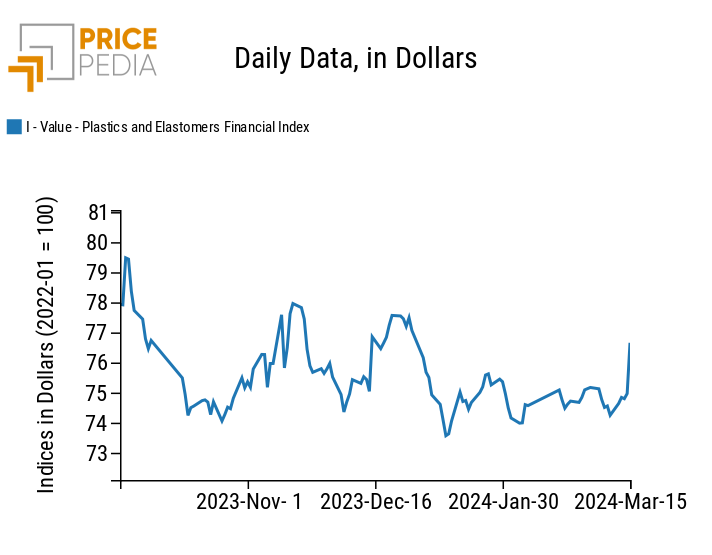
The financial index of plastics quoted in China also undergoes a positive turn. In this case too, its dynamics seem to have been influenced mainly by the trend of Brent and other oil prices.
PricePedia Financial Indices of plastics prices in dollars
FERROUS
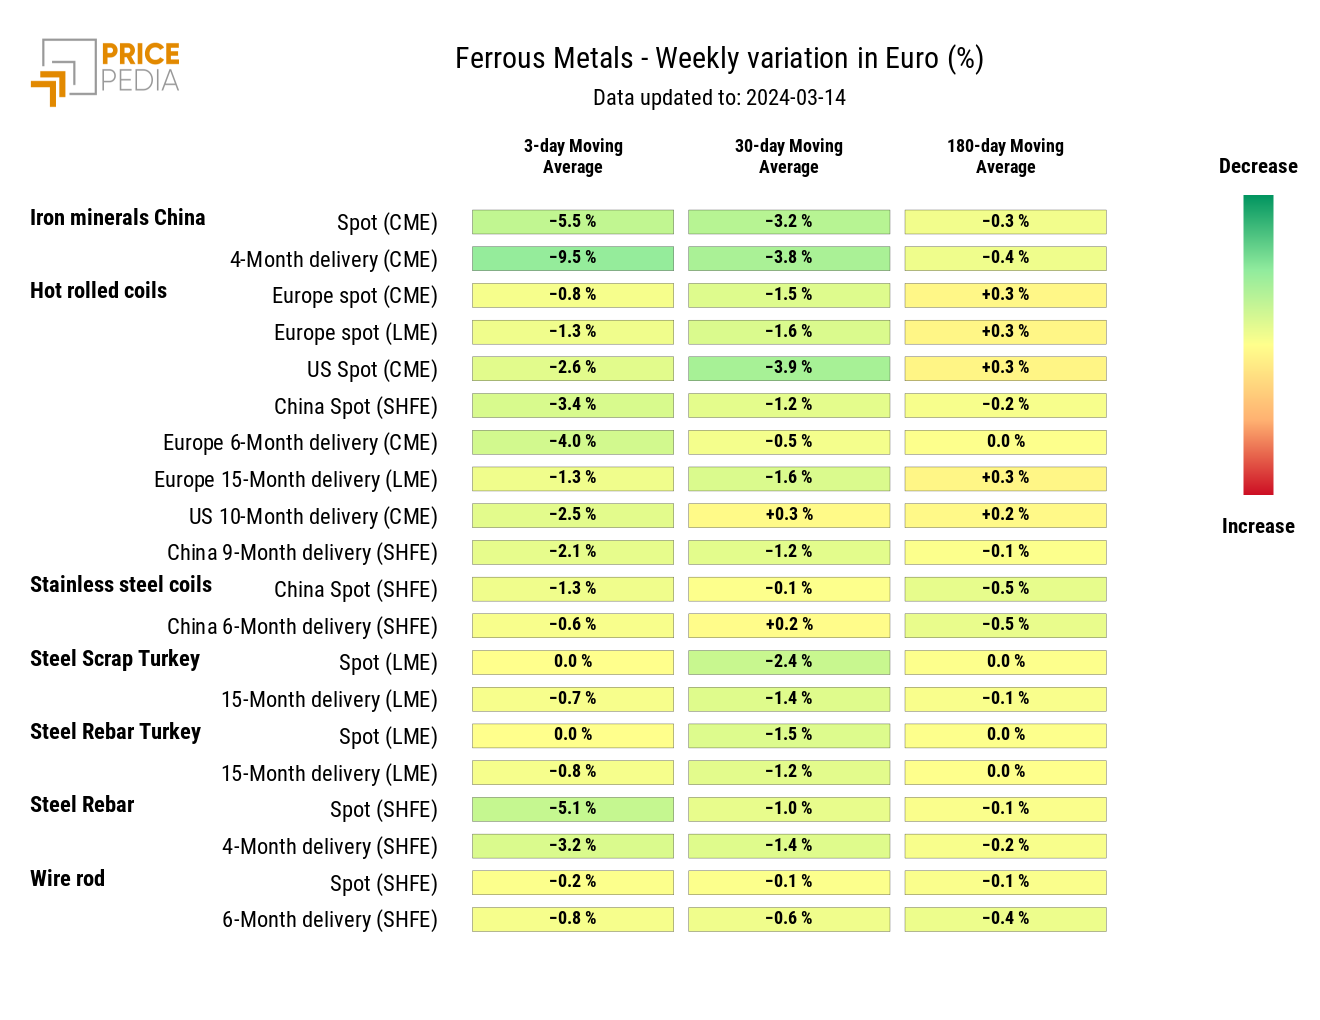
The two financial indices of ferrous metals continue to follow a clear downward trend, which is much more pronounced for the Chinese market compared to the European one. Indeed, the Chinese market has long been characterized by oversupply, resulting from weak domestic demand. This is particularly evident in the case of iron ore, whose prices quoted on the CME have returned to levels of $110/ton.
PricePedia Financial Indices of ferrous metals prices in dollars
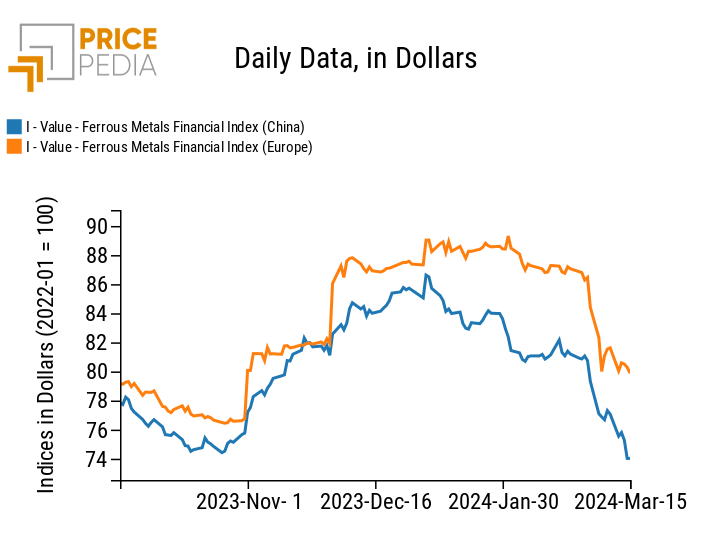
The ferrous heatmap highlights the fall in prices: of Chinese iron ore, steel billets, and hot coils.
HeatMap of ferrous metals prices in euro
INDUSTRIAL NON-FERROUS
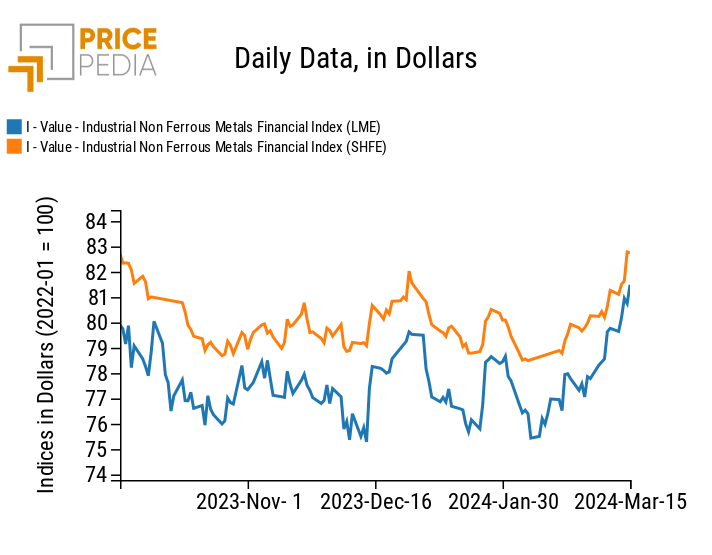
The financial indices of industrial non-ferrous metals accentuate their upward price dynamics.
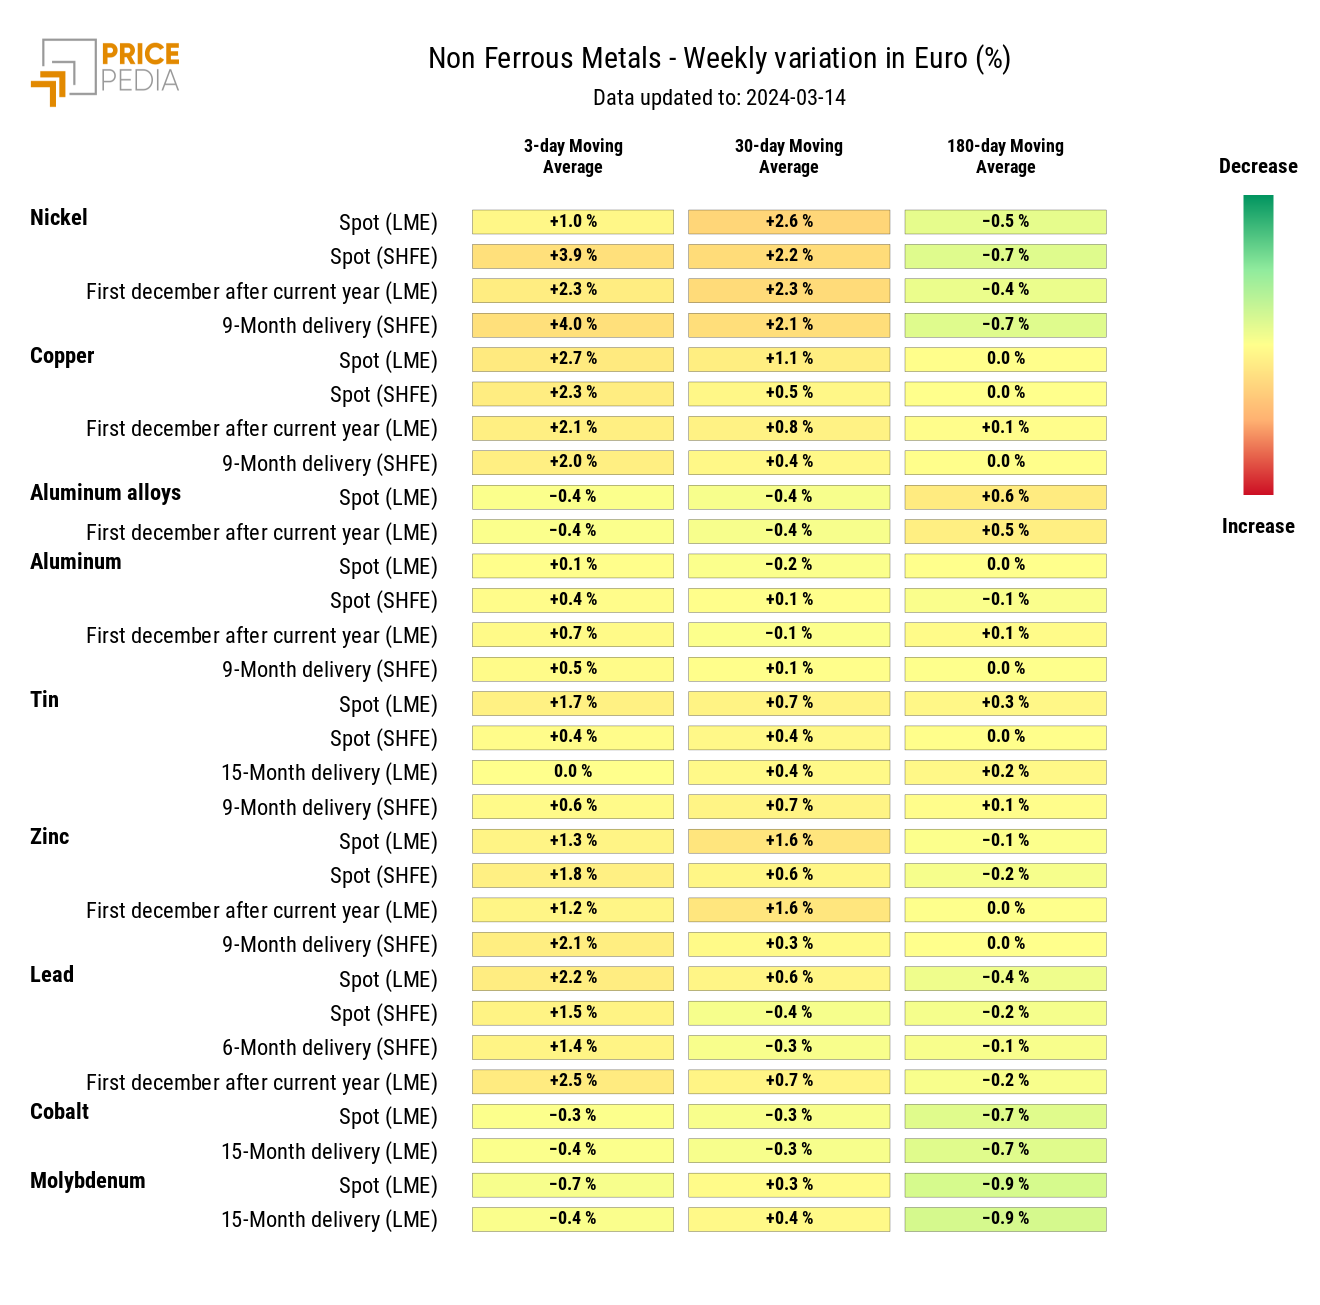
An important contribution has certainly been attributed by the dynamics of copper prices, which have been influenced by recent news on the Chinese market. According to data from Shanghai Metals Market (SMM), Chinese refined copper production decreased by 2% in February and is expected to continue to decrease in the coming months. The China Nonferrous Metals Industry Association stated that this Wednesday, 19 copper-producing companies agreed to reduce production, extending maintenance work and delaying the commissioning of new plants.
PricePedia Financial Indices of industrial non-ferrous metals prices in dollars
The industrial non-ferrous heatmap shows a generalized price growth that affects not only copper but also nickel, lead, and zinc.
HeatMap of industrial non-ferrous metals prices in euro
FOOD
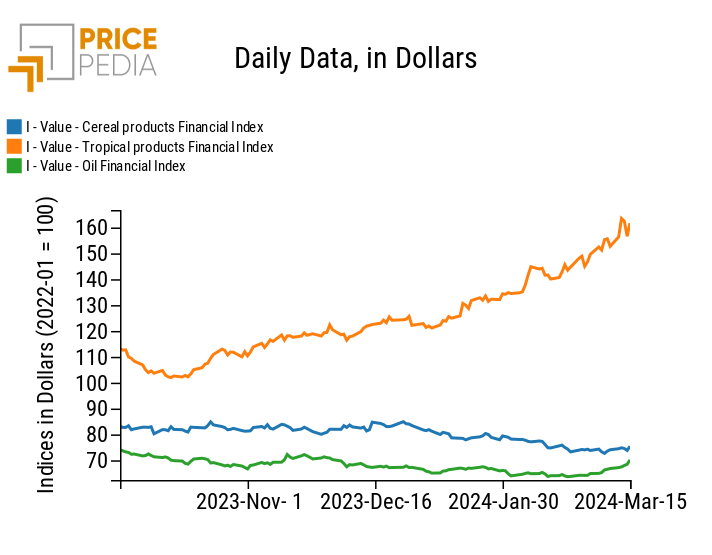
This week, the financial indices of tropicals and cereals have recorded slight oscillations that have opposed their current trend. However, these variations are not sufficient to modify the dynamics.
On the other hand, the recent growth in food oils continues to accentuate.
PricePedia Financial Indices of food prices in dollars
TROPICAL
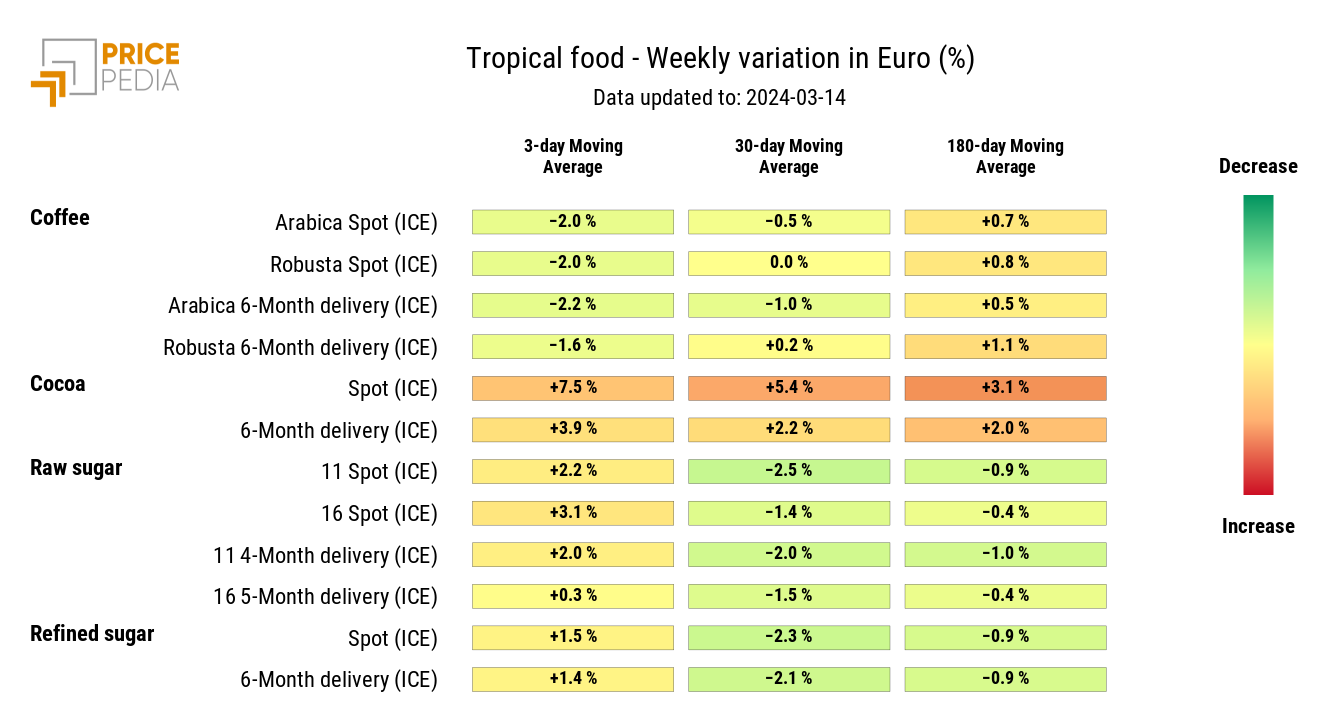
The heatmap of tropical foods continues to show a positive variation in the moving average prices of cocoa.
There is, instead, a decrease in coffee prices, compared to the increase that occurred in the previous week.
HeatMap of tropical food prices in euro
OILS
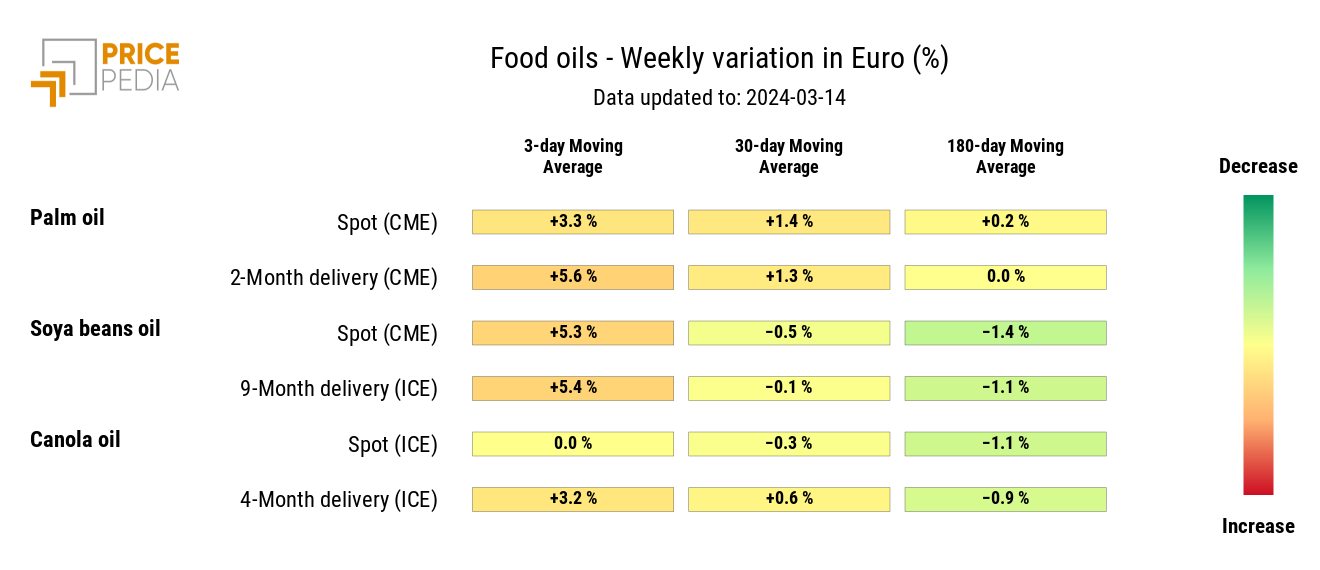
The heatmap of food oils highlights the prices that are contributing to the upward trend of the oil financial index. Among them, soybean oil stands out, whose production is expected to decline for the 2023/2024 season.
HeatMap of oil prices in euro
 "
"


