Commodities real prices as an analytical tool
Published by Pasquale Marzano. .
Natural Gas Glass Analysis tools and methodologiesIn economics, real prices, as opposed to nominal prices, refer to prices that have been adjusted to account for inflation[1]. They represent a useful tool for economic analysis for various purposes:
- Comparing price levels of a particular good or service over relatively long and different historical periods;
- Identifying long-term trends in data;
- Studying relationships between prices.
An example of real price analysis is presented in the article Commodity Prices: what to expect in the long-run?, where cases related to copper and natural gas are illustrated. The long-term dynamics of deflated copper prices show a decreasing trend and, moreover, in light of what happened in the 1960s and 1970s, it downsizes the increases that occurred in 2021 and 2022, which appear in line with the history of price cycles since 1960.
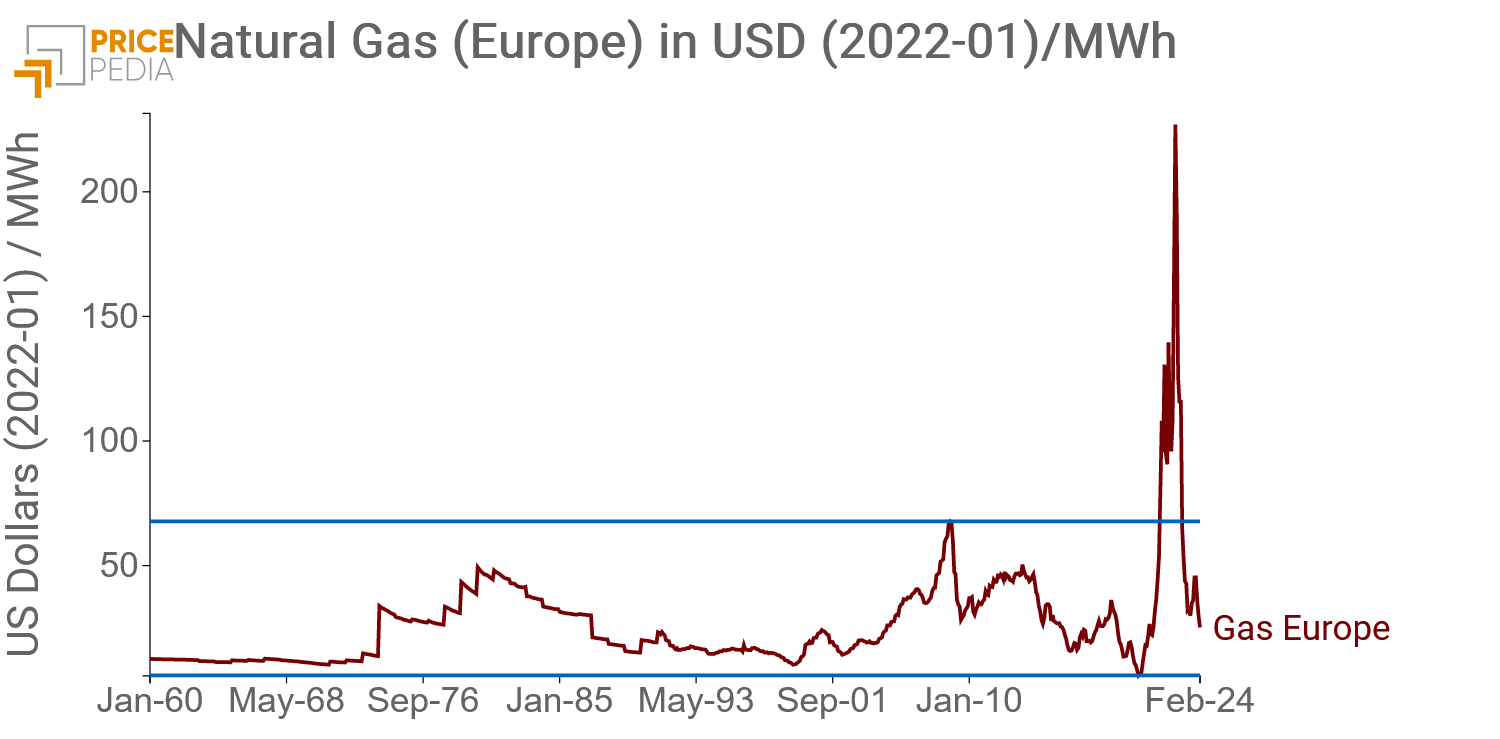
In the case of gas, however, for which the graph of real prices, updated to February 2024, is reported below[2], the analysis shows the exceptional levels in the biennium 2021-2022 compared to what was observed in the previous 60 years.

From the graph, moreover, it can be noted that, in real terms, the recent phase of abnormal price increases seems to have ended, as a decrease has been recorded since 2023, causing a return to levels more in line with the historical range of the period 1960-2020.
Do you want to stay up-to-date on commodity market trends?
Sign up for PricePedia newsletter: it's free!
Relationship Between Prices
Since real prices are defined as prices net of inflation, they can also be used in studying the relationships between prices and their determinants. On one hand, this allows for the isolation of the effects of these determinants from inflation. On the other hand, it avoids overestimating the effect of inflation in the regression model, should it be considered among the determinants.
A case study is represented by the European price of float glass. Glass is a good whose production process consumes large amounts of energy. Therefore, it is plausible to estimate a model with energy costs, represented by the European natural gas price, as determinants, and other non-material costs, represented by the Consumer Price Index.
In this case, however, the result of estimating such a model would lead to overestimating the coefficient of the Consumer Price Index. For this reason, it is useful to consider as a dependent variable the average price of float glass, deflated by the Consumer Price Index, as a function of only energy costs.
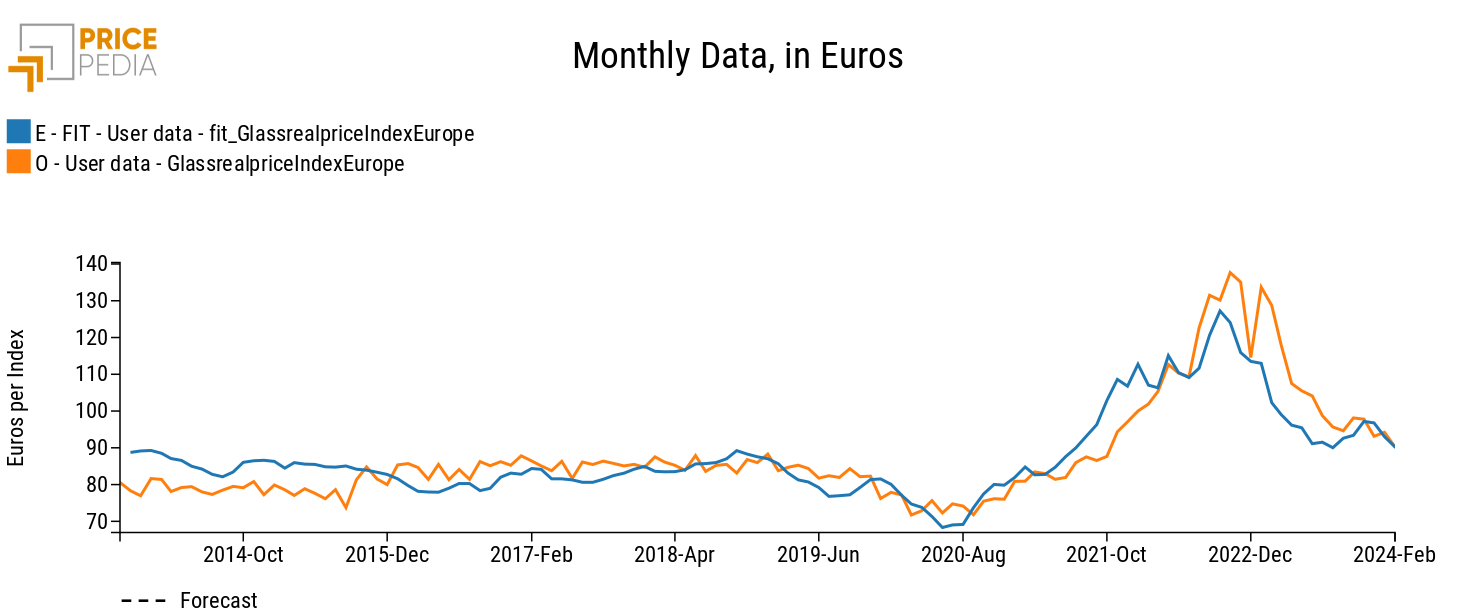
The comparison between the real price of float glass and the long-term estimation fit is shown below.

The long-term fit seems to capture very well the dynamics of the real price of float glass, although in some periods a differential between the two series has been created. In recent months, this differential seems to have completely disappeared.
1. The real price of a good or service is calculated as the ratio between the nominal price expressed in currency and a price index, typically the Consumer Price Index.
2. Data from January 1960 onwards have been reconstructed considering the ratio between Natural Gas TTF (Netherlands) delivery at 1 month, and the price of European natural gas from the World Bank. The price was then deflated considering the Consumer Price Index of the United States (CPI) from the U.S. Bureau of Labor Statistics as the price index. Pasquale Marzano
Economist and data scientist. At PricePedia he deals with the analysis of commodity markets, forecasting models for raw material prices and management of reference databases.


