Profit-taking in financial commodity markets
Counter-trend week for commodity prices
Published by Luca Sazzini. .
Conjunctural Indicators Commodities Financial WeekFOMC Meeting on May 1st
During the Federal Open Market Committee (FOMC) meeting at the beginning of May, the decision of the Federal Reserve (FED) was to maintain interest rates unchanged, between 5.25% and 5.50%.
During the official statement on May 1st, Chairman Powell appeared more accommodative than expected by analysts and stated that a future interest rate hike is unlikely. The current monetary policy adopted by the FED should be sufficiently restrictive to bring inflation back towards the 2% target without the need for further interest rate hikes.
Contrary to previous meetings, however, the FED chairman avoided mentioning a cut in interest rates by the end of the year. Unless there are significant increases in the current unemployment rate, the Federal Reserve seems intent on maintaining current interest rates until there is, for at least three consecutive months, a decline in the inflation rate.
Currently, the market is pricing in a rate cut by the FED by the November 7, 2024 meeting, while assigning a probability of about 40% to a second rate cut by the end of this year.
Performance of the Commodity Market
During the past week, the commodity market has been predominantly bearish.
Oil prices experienced a significant reduction following the easing of geopolitical tensions in the Middle East and unexpected stockpile accumulations in the US market. Despite OPEC+ continuing to reduce oil supply, oil demand remains weak, and the diminishing geopolitical risk premium has pushed down Brent and WTI prices.
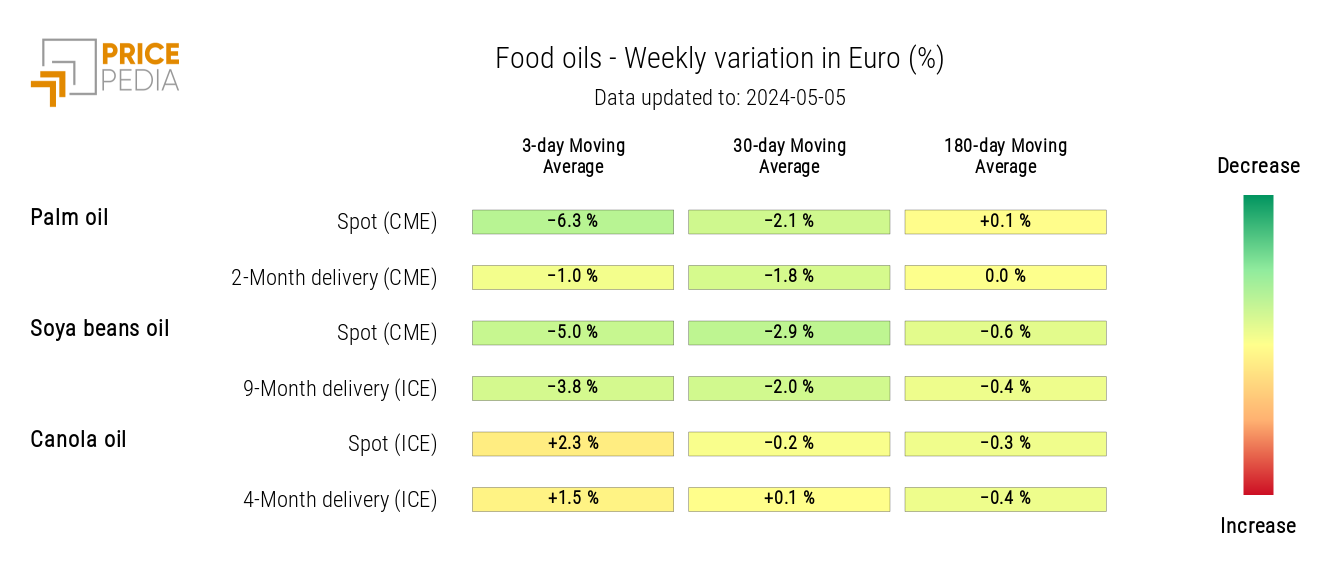
Other prices that saw sharp declines during the week were tropical foods, due to the collapse of cocoa prices, and edible oils.
Even non-ferrous metal prices, which have been on a clearly upward trend for some time, experienced some downturns this week.
Analysis of Commodity Trends
When analyzing the overall trend dynamics of commodities, avoiding focusing solely on an excessively narrow time frame, it emerges that commodity prices have been increasingly entering a growth phase in recent times.
To analyze the numerical prevalence of trends in the commodity market, one can observe the global commodity trend index compiled by PricePedia. This index is derived from the sum of the number of bullish trends in commodity markets subtracted from the total number of bearish trends. When the index assumes null values, it means that, in the commodity market, the number of bullish trends equals the number of bearish trends.
Below is the graph of the global commodity trend index, highlighting in gray the periods characterized by a greater number of rising trends and in pink the periods characterized by a greater number of falling trends.
Global Commodity Trend Index
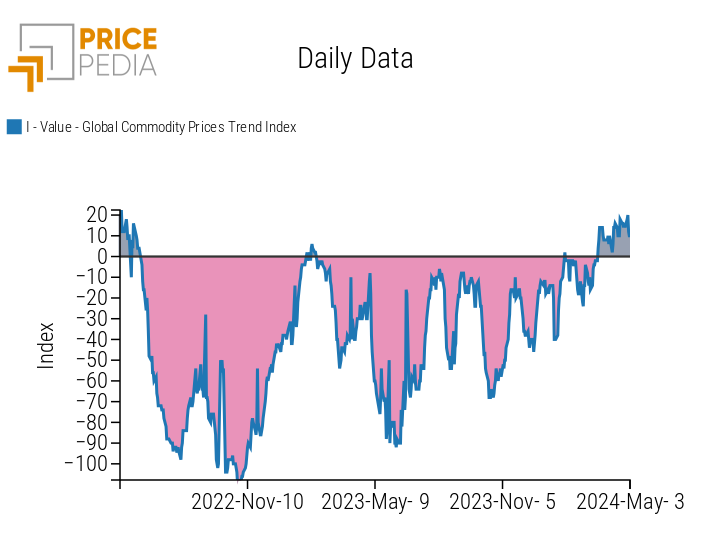
From the analysis of the index, it emerges that since mid-March 2024, there has been a prevalence of positive trends not seen since the first half of 2022. This indicates that traders employing trend-following strategies have begun to positively impact commodity prices, thus contributing to the upward trend dynamics in recent times.
The recent price reductions recorded by many commodities appear more as profit-taking effects than as signals of a true trend reversal.
ENERGY
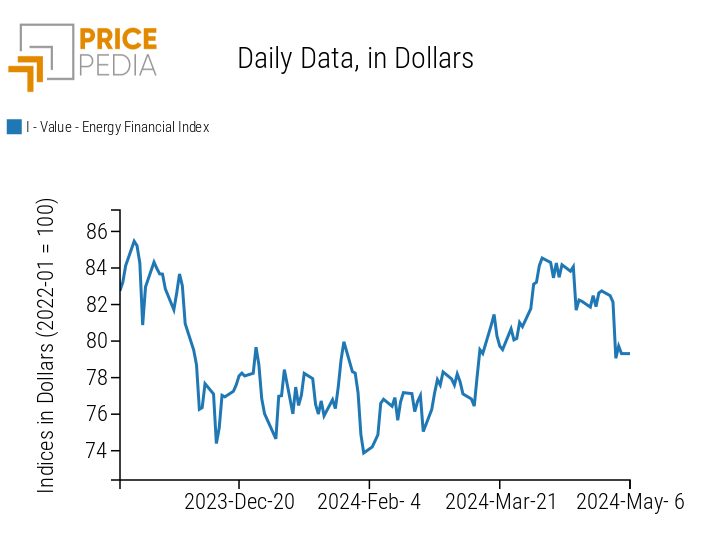
This week, the financial index of energy prices recorded a decline in line with the drop in oil prices.
PricePedia Financial Index of Energy Prices in Dollars
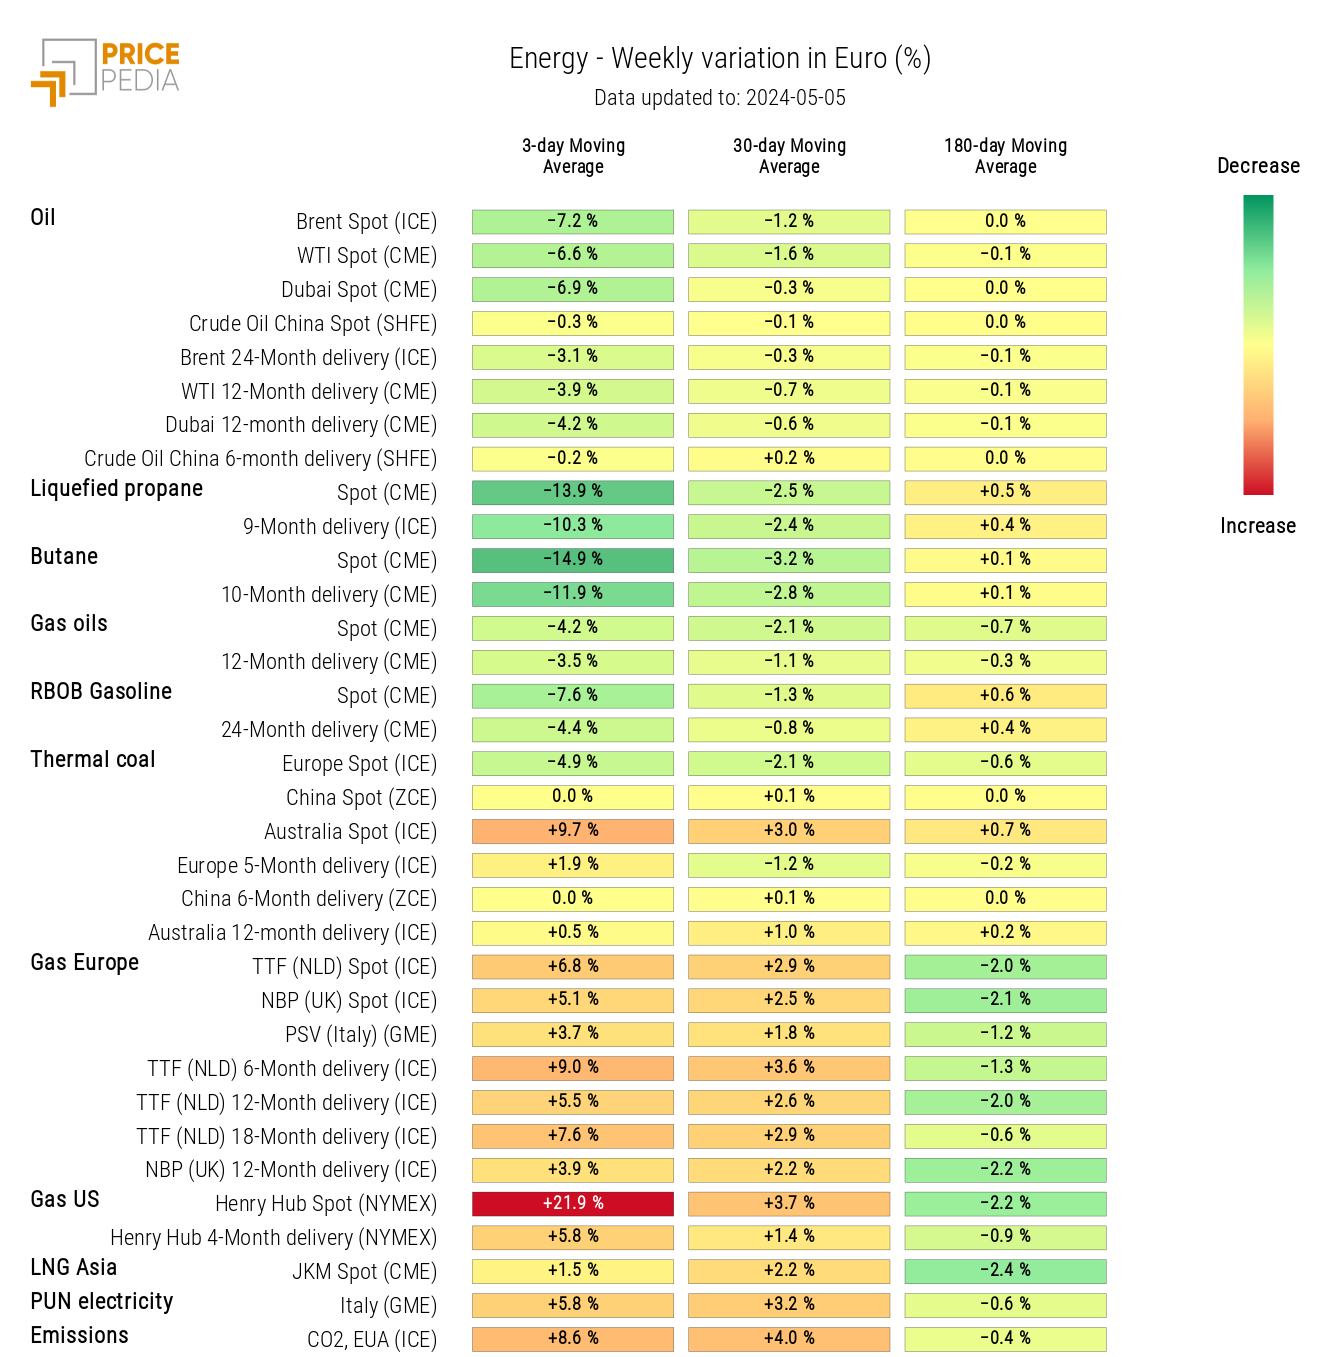
The energy price heatmap highlights the decline in oil prices due to easing geopolitical tensions in the Middle East and a persistently weak demand for oil.
The heatmap also indicates significant declines in liquefied propane and gasoline prices, alongside an intense increase in US natural gas prices.
HeatMap of Energy Prices in Euro
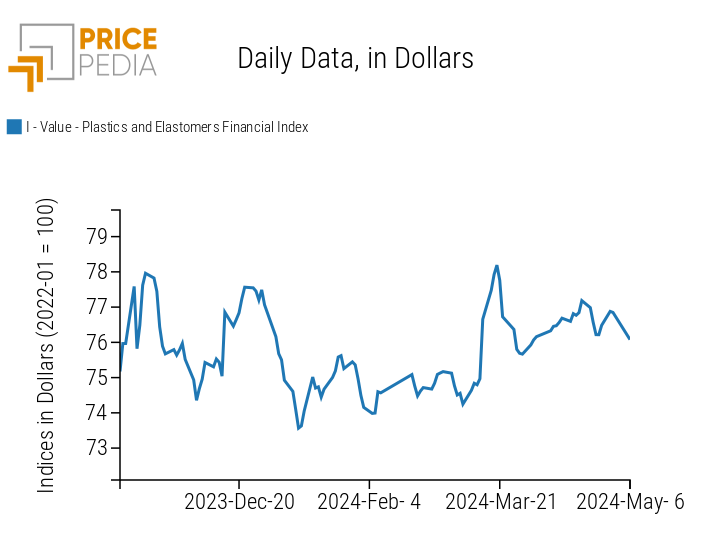
PLASTICS
The financial index of plastics and elastomers, listed on Chinese financial exchanges, recorded a decline in prices in line with the trend in oil prices.
PricePedia Financial Indices of Plastics Prices in Dollars
FERROUS
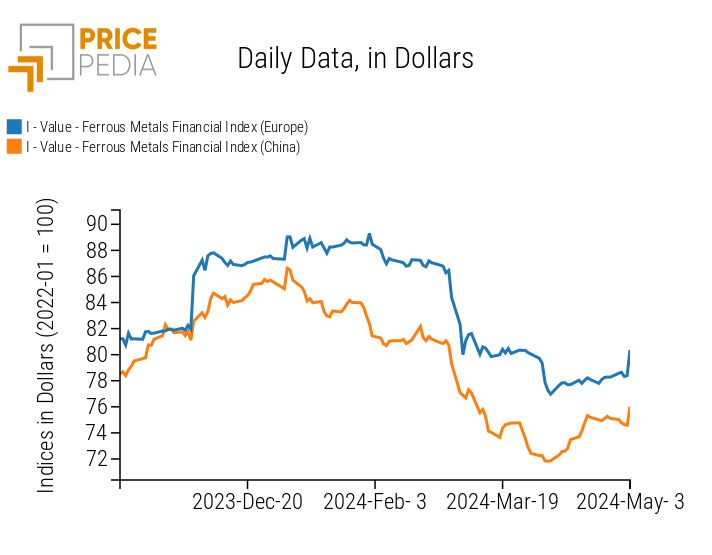
This week, the two ferrous metal indices closed with a positive variation due to the rise in iron ore prices.
PricePedia Financial Indices of Ferrous Metal Prices in Dollars
Do you want to stay up-to-date on commodity market trends?
Sign up for PricePedia newsletter: it's free!
INDUSTRIAL NON-FERROUS
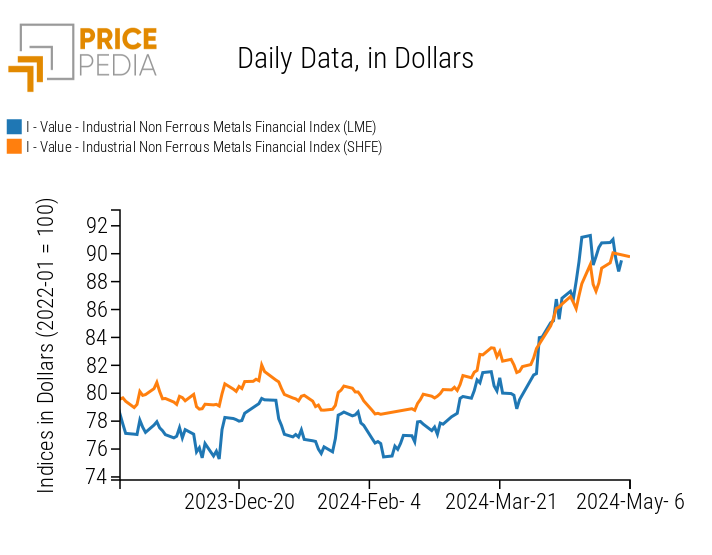
Both non-ferrous metal indices recorded a slight decline during the past week.
PricePedia Financial Indices of Industrial Non-Ferrous Metal Prices in Dollars
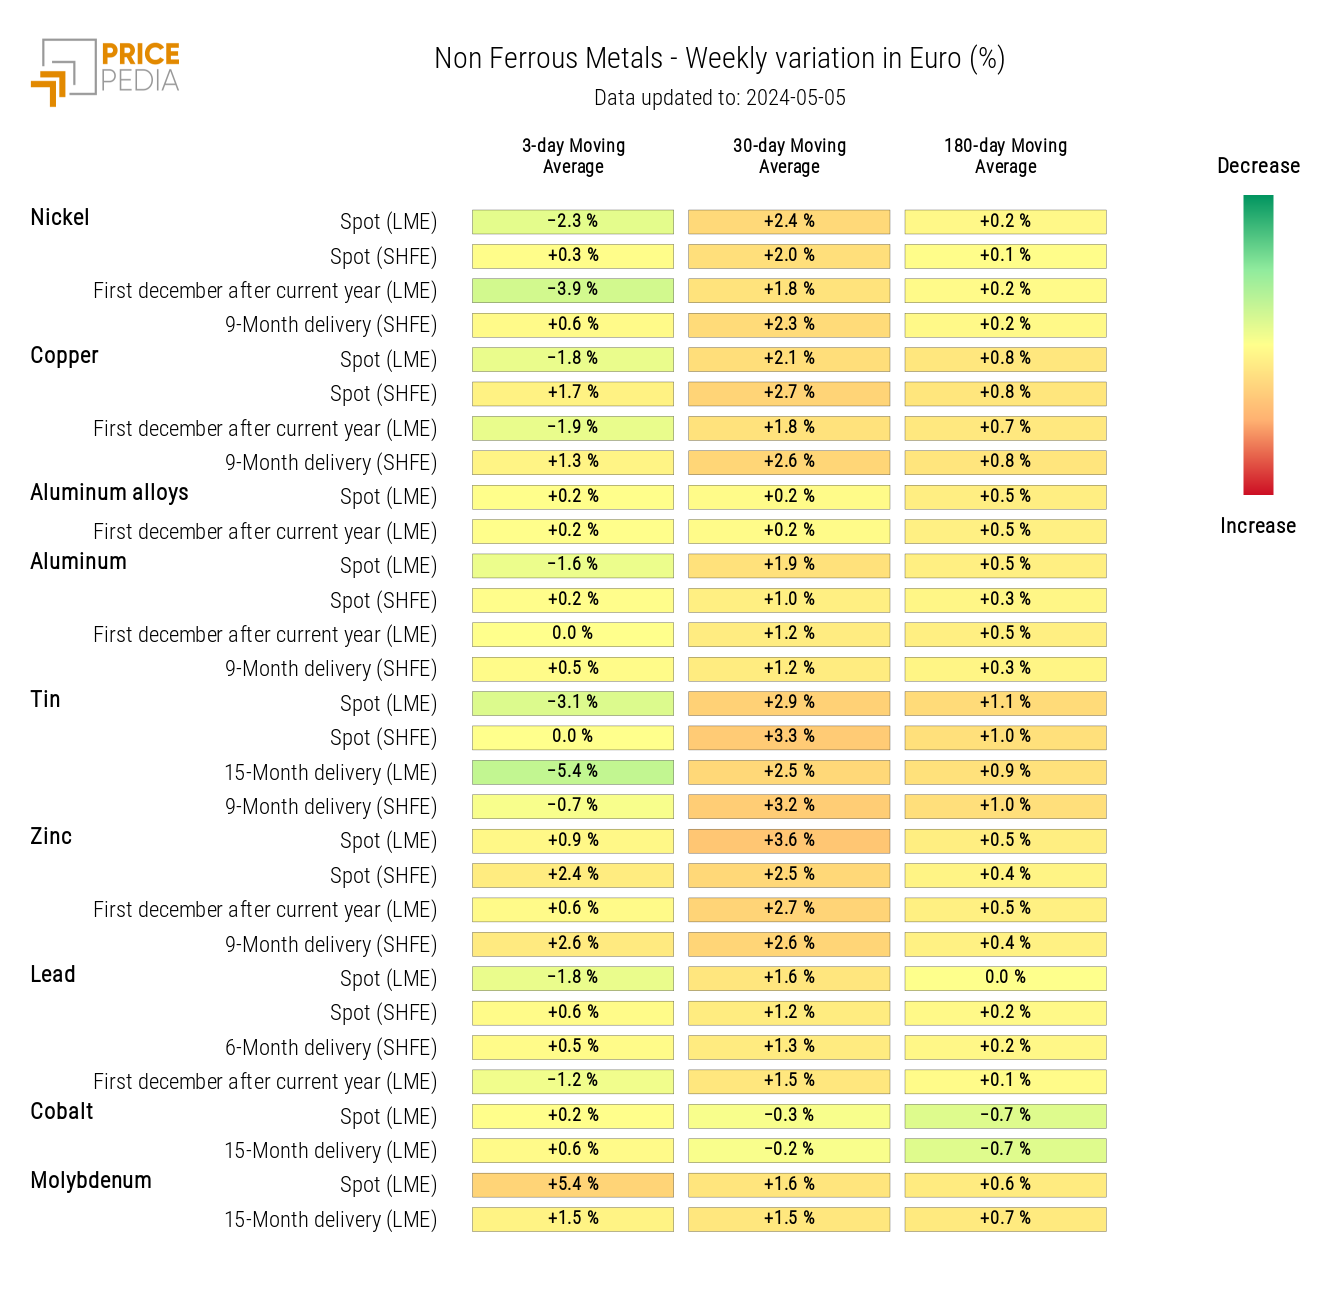
The non-ferrous heatmap highlights a reduction in tin and nickel prices.
Furthermore, observing the 30-day moving average variation, one can note the sharp increase that characterized the non-ferrous metal market over the last month.
HeatMap of Industrial Non-Ferrous Metal Prices in Euro
FOOD
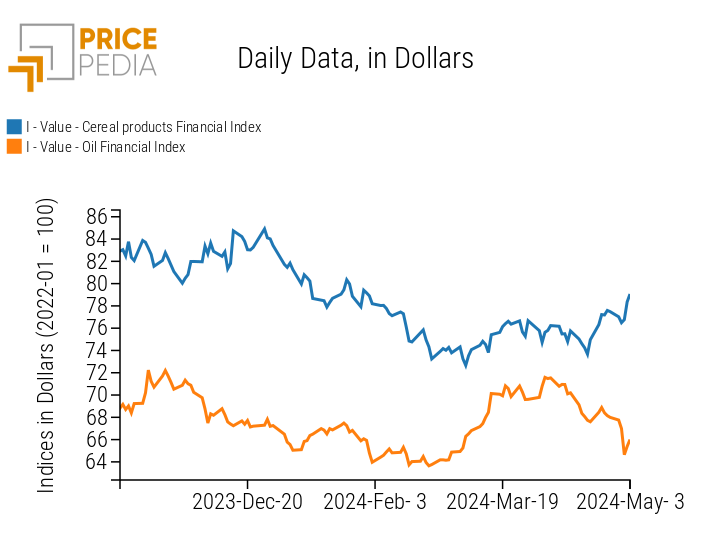
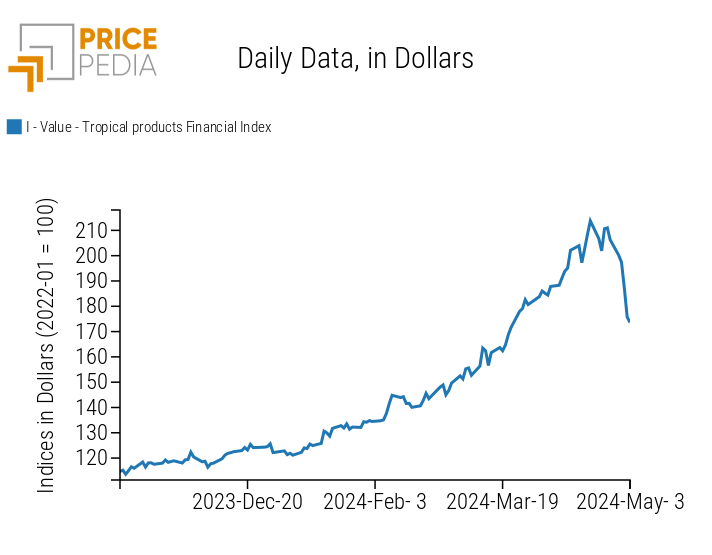
Both the financial indices of tropical foods and oils recorded a reduction in prices during the week, while the cereal financial index shows a slight positive fluctuation due to the increase in oat prices.
| PricePedia Financial Indices of Food Prices in Dollars | |
| Cereals and Oils | Tropical |
|
|
CEREALS
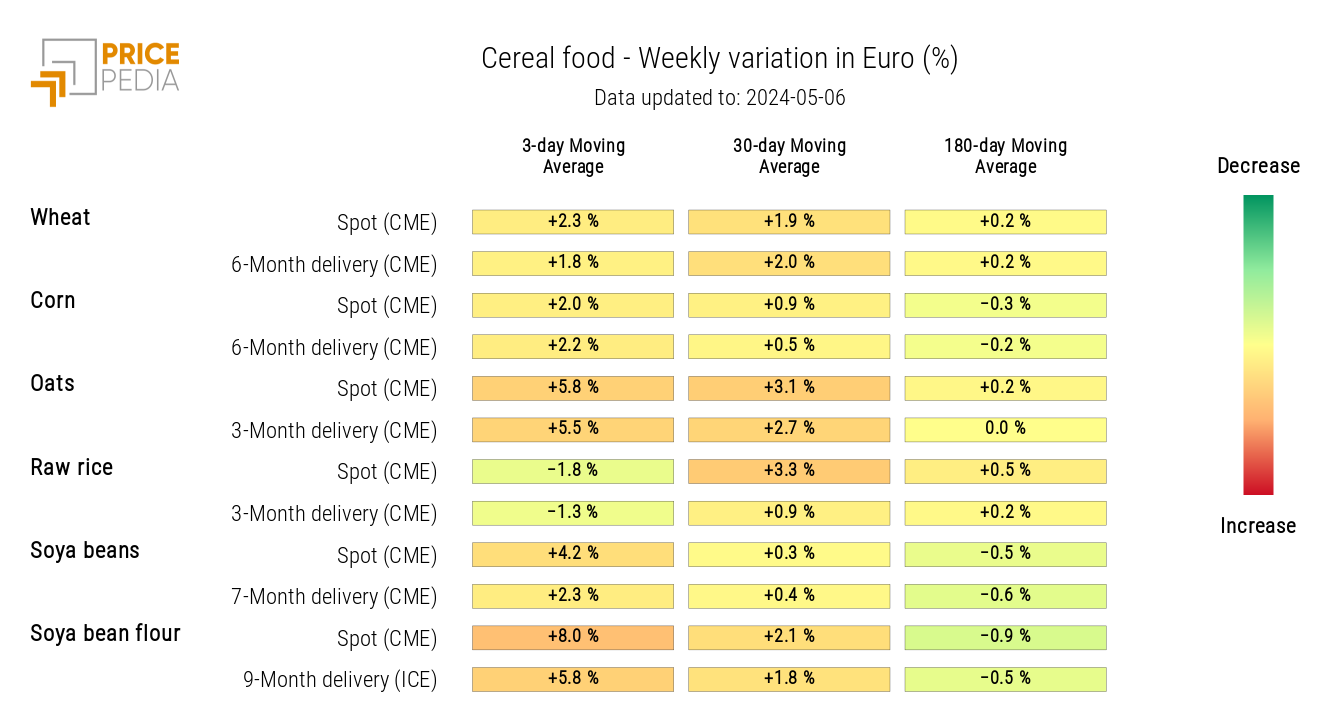
The increase in the cereal price index was driven by the rise in oat prices and partly by soybean meal prices.
HeatMap of Cereal Prices in Euro
TROPICAL
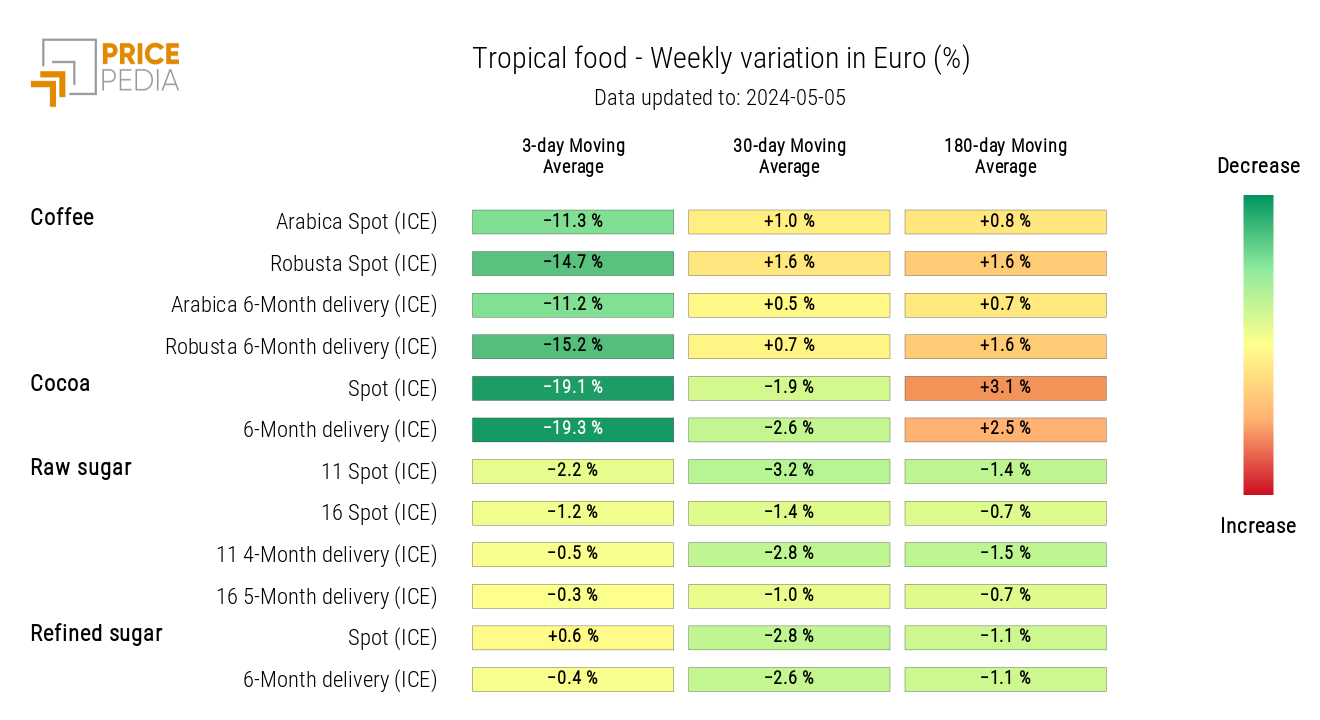
The tropical heatmap shows a sharp reduction in cocoa and both coffee prices.
HeatMap of Tropical Food Prices in Euro
OILS
The provided heatmap shows a general reduction in oil prices, except for canola oil.
HeatMap of Oil Prices in Euro
