Uncertainty increases in commodity markets
International transport costs rise again
Published by Luca Sazzini. .
Conjunctural Indicators Commodities Financial WeekIncreased Volatility in Commodity Markets
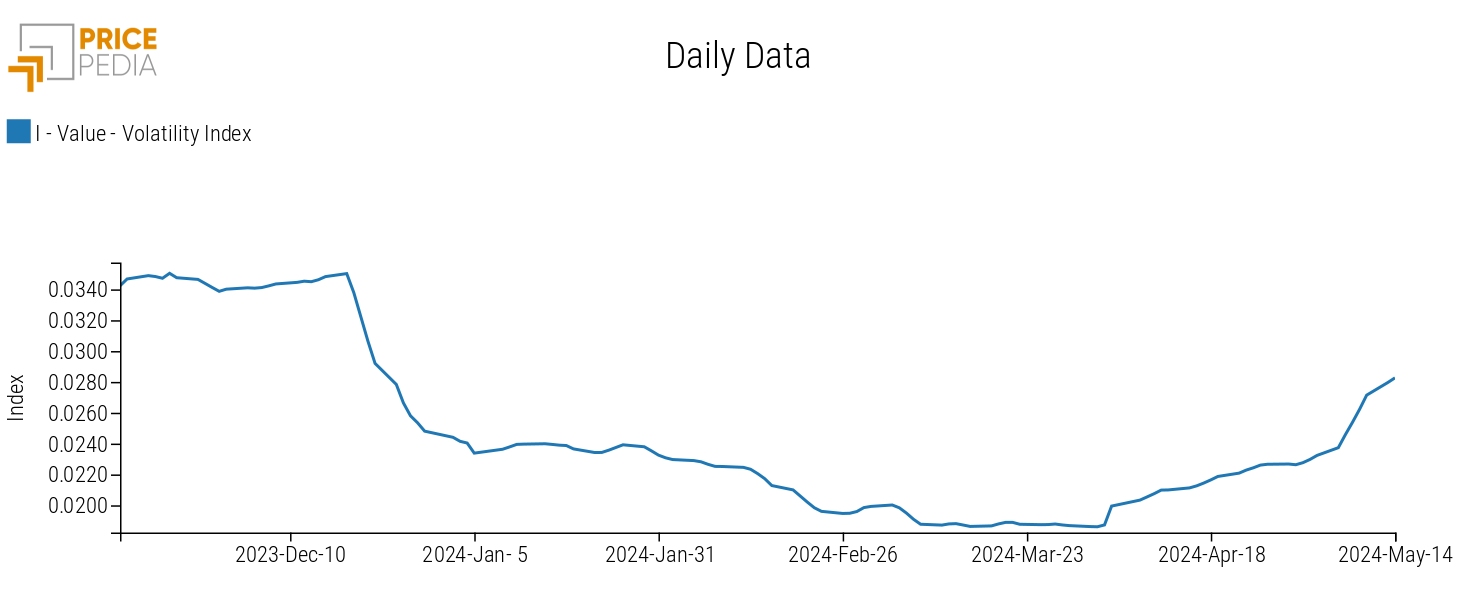
In April, the volatility index of commodity prices, as measured by PricePedia, has once again increased.
This index has been constructed to take on higher values as the amplitudes of price variations in commodities increase.
The following graph highlights the recent increase in volatility index due to the greater dispersion in commodity price variations.
Commodity Price Volatility Index
An indirect indicator of the current uncertainty in commodity markets is provided by the recent dynamics of copper prices.
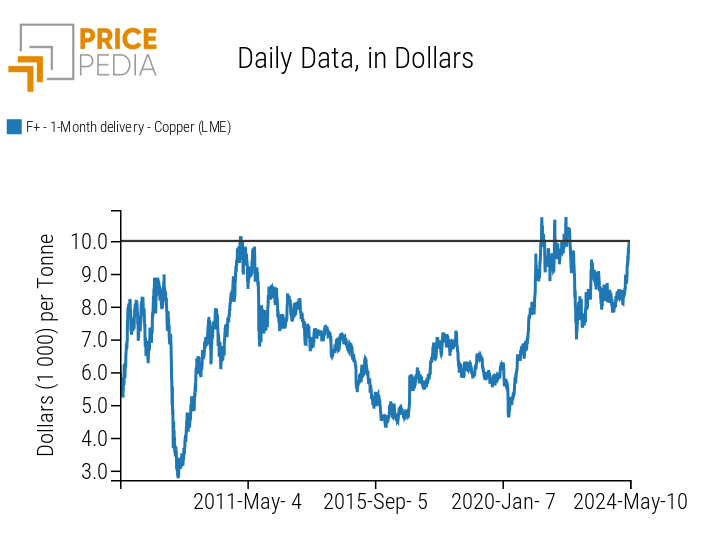
According to Goldman Sachs, the growth in copper prices was expected to surpass the $10,000/ton threshold, reaching a value of $12,000/ton by year-end. However, currently, copper prices are positioned slightly below $10,000/ton and have only shown sideways movements for now.
Below is the historical series of copper prices expressed in dollars per ton, quoted on the London Metal Exchange (LME).
Historical Series of LME Spot Copper Prices
Increase in Transportation Costs
The current increase in commodity price volatility is partly attributable to the presence of high geopolitical risks in the current international scenario.
The ongoing attacks by the Houthis on commercial ships passing through the Red Sea pose a danger to international trade.
Maritime transport company Maersk has reported that:
- The loss of goods along the commercial routes from the Far East to the Mediterranean amounts to between 15-20%.
- Ships passing through the Red Sea via the Gulf of Aden require 40% more fuel.
Further evidence of the rise in transportation costs is provided by the increase in the Baltic Dry Index: the global benchmark for dry bulk shipping rates.
Below are the charts of transportation costs for major container ship routes departing from Shanghai and bulk cargo ships delivering goods.
| Freight Rates from Shanghai | Dollar Prices of the Baltic Dry Index (BDI) |
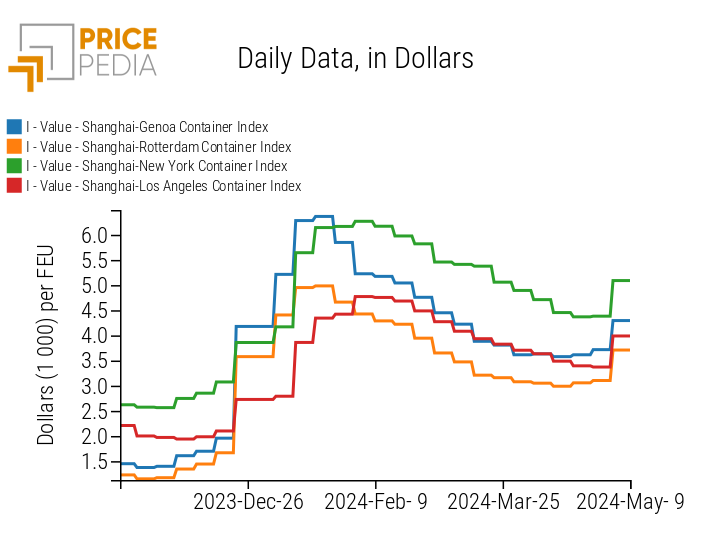
|
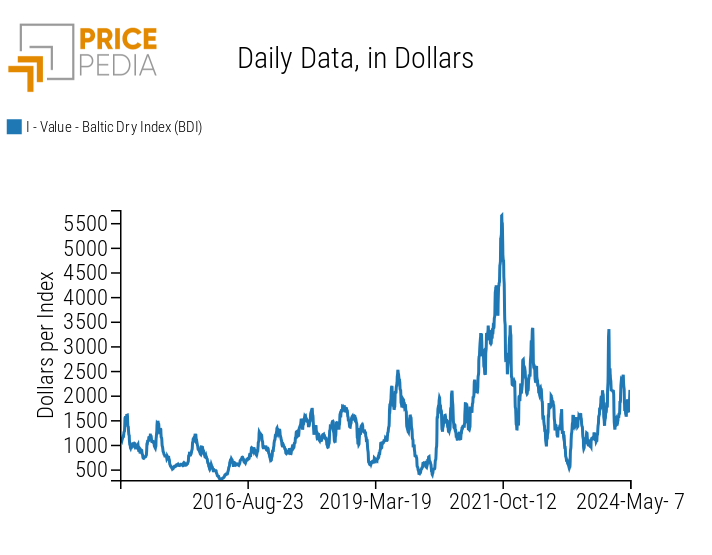
|
ENERGY
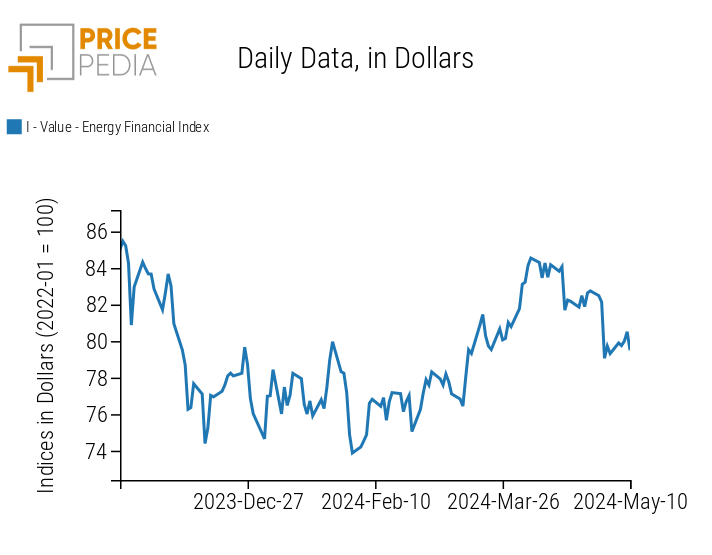
This week, the financial index of energy prices experienced growth before undergoing a slight decline on Friday.
PricePedia Financial Index of Energy Prices in Dollars
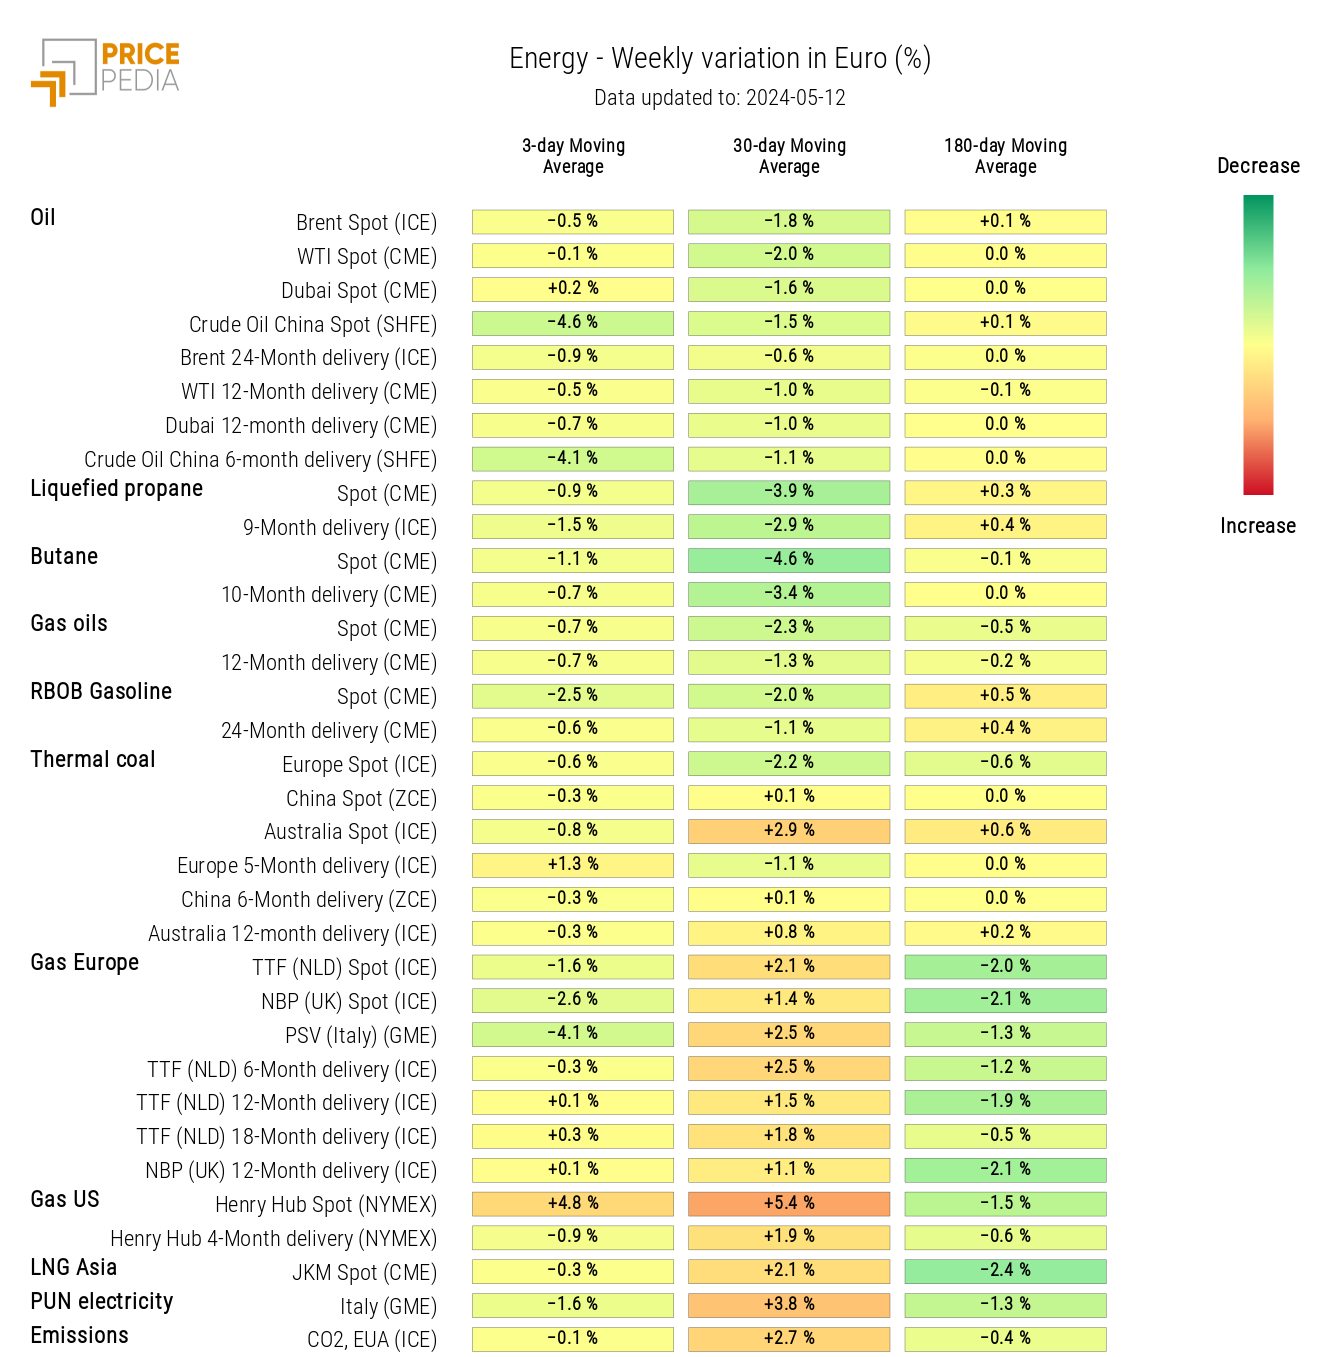
Energy price heatmap shows growth in US gas prices, accompanied by a decrease in crude oil China spot.
The Energy Information Administration (EIA) has projected a decline in American gas production in 2024 due to the excessive weakness in US gas prices. The EIA expects production to only start growing again in 2025 due to price recovery driven by expectations of increased future gas demand in the US market.
Energy Price HeatMap in Euro
PLASTICS
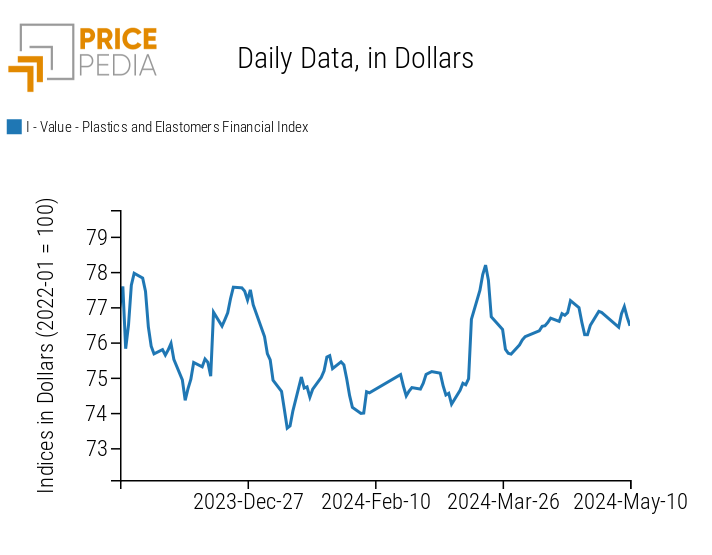
The financial index of plastics listed in China shows a slight fluctuation in prices that does not alter its dynamics.
PricePedia Financial Indices of Dollar Prices for Plastics
FERROUS METALS
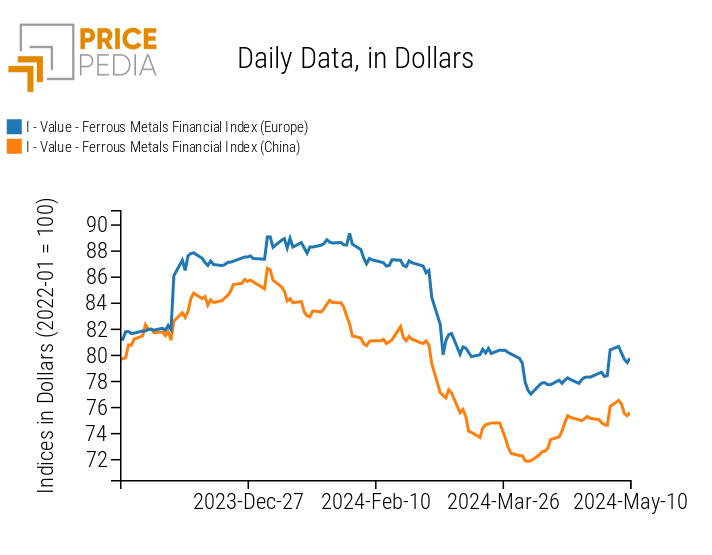
This week, both indices for ferrous metals saw a slight price decline, opposing the last weekend's increase.
Both indices ended the week with a weak upward fluctuation.
PricePedia Financial Indices of Dollar Prices for Ferrous Metals
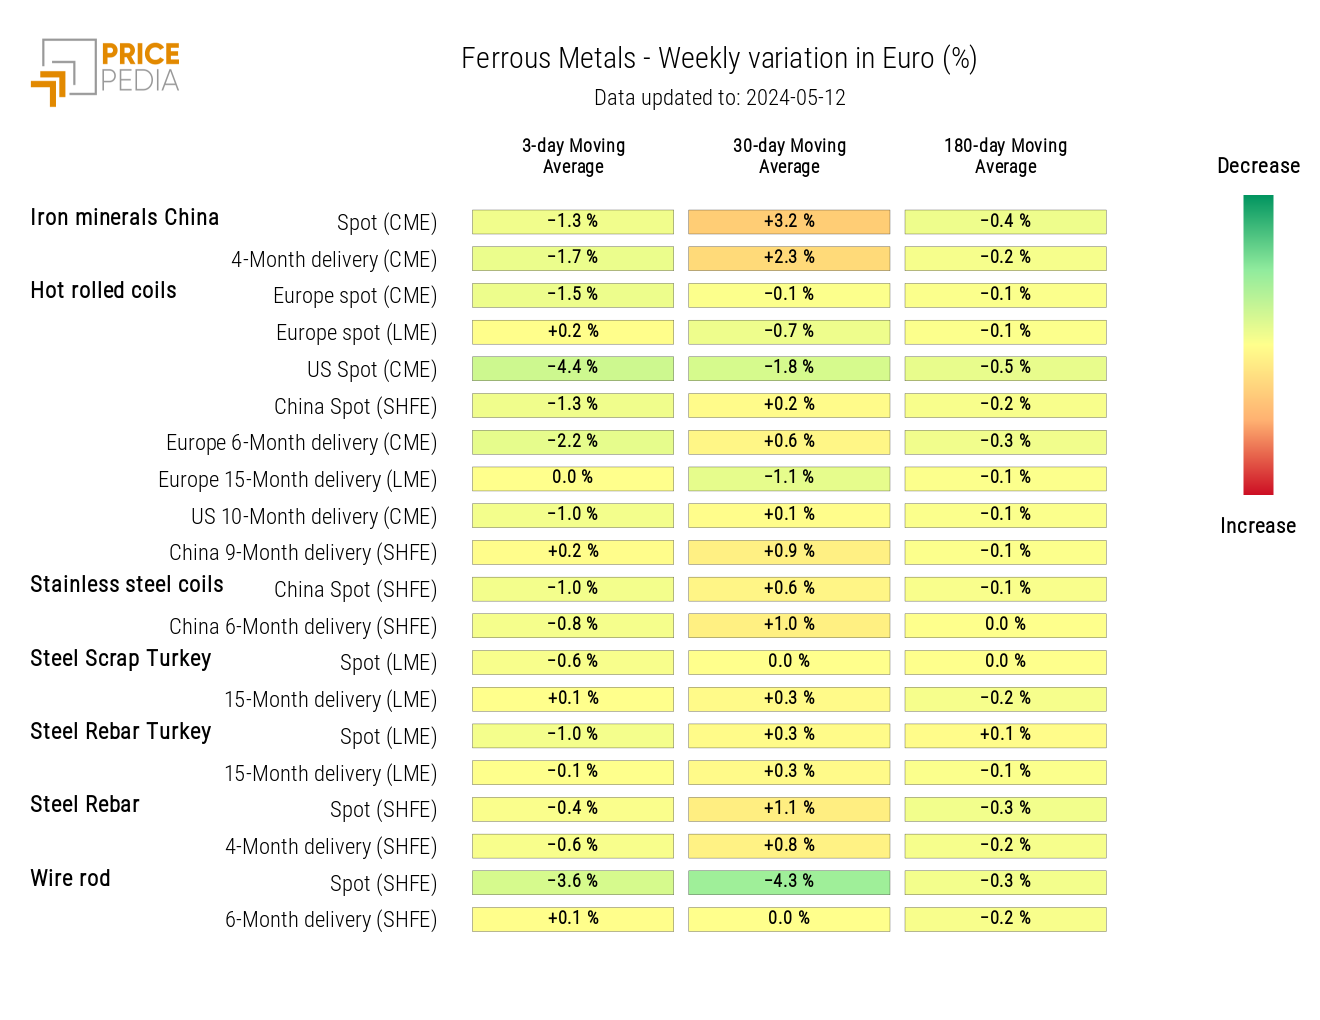
From the ferrous metal heatmap, a decrease in prices of hot rolled coils USA and wire rod is evident.
HeatMap of Ferrous Metal Prices in Euro
Do you want to stay up-to-date on commodity market trends?
Sign up for PricePedia newsletter: it's free!
NON-FERROUS INDUSTRIAL METALS
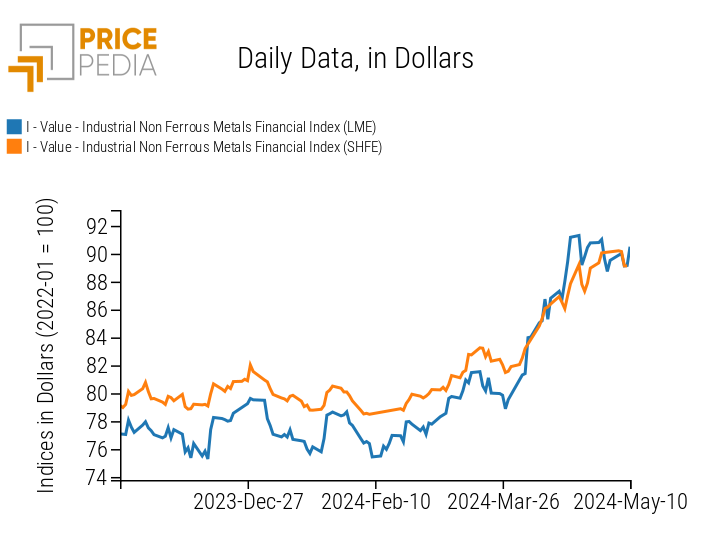
The indices for industrial non-ferrous metals started the week with a slight price drop before recovering on Friday.
PricePedia Financial Indices of Dollar Prices for Industrial Non-Ferrous Metals
FOOD
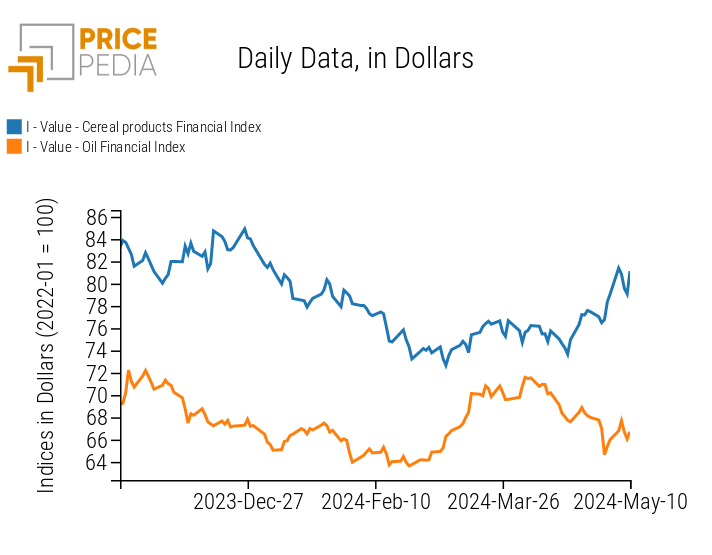
Both the financial indices for cereals and edible oils experienced price fluctuations during the week.
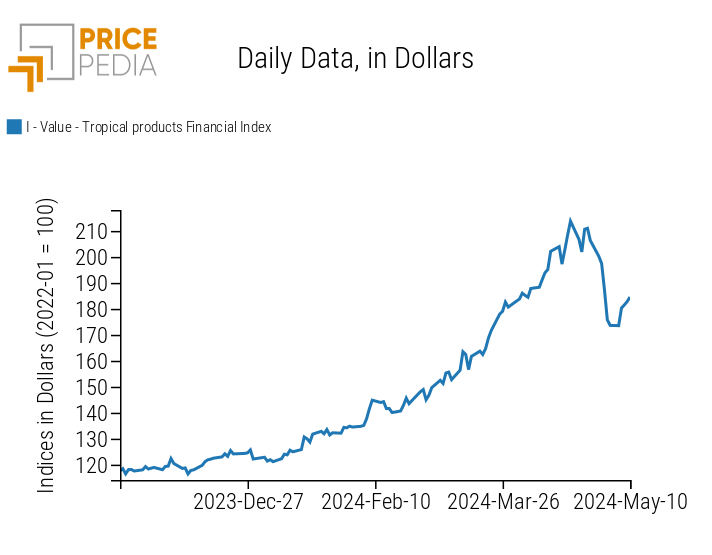
The financial index for tropical products underwent a slight positive fluctuation, contrary to its recent price decline.
| PricePedia Financial Indices of Dollar Prices for Food | |
| Cereals and Oils | Tropical |
|
|
CEREALS
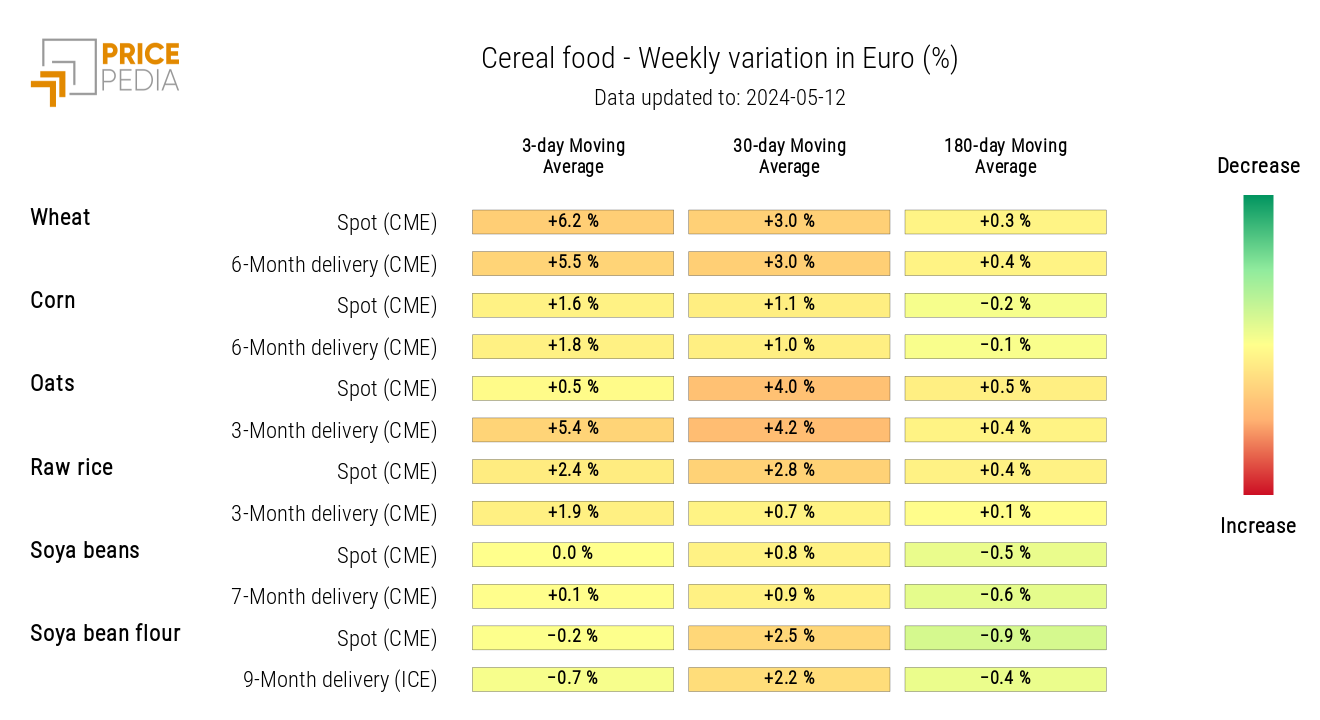
From the cereal heatmap, a general increase in the weekly variation of the three-day moving average is evident, particularly for wheat prices.
HeatMap of Cereal Prices in Euro
TROPICAL PRODUCTS
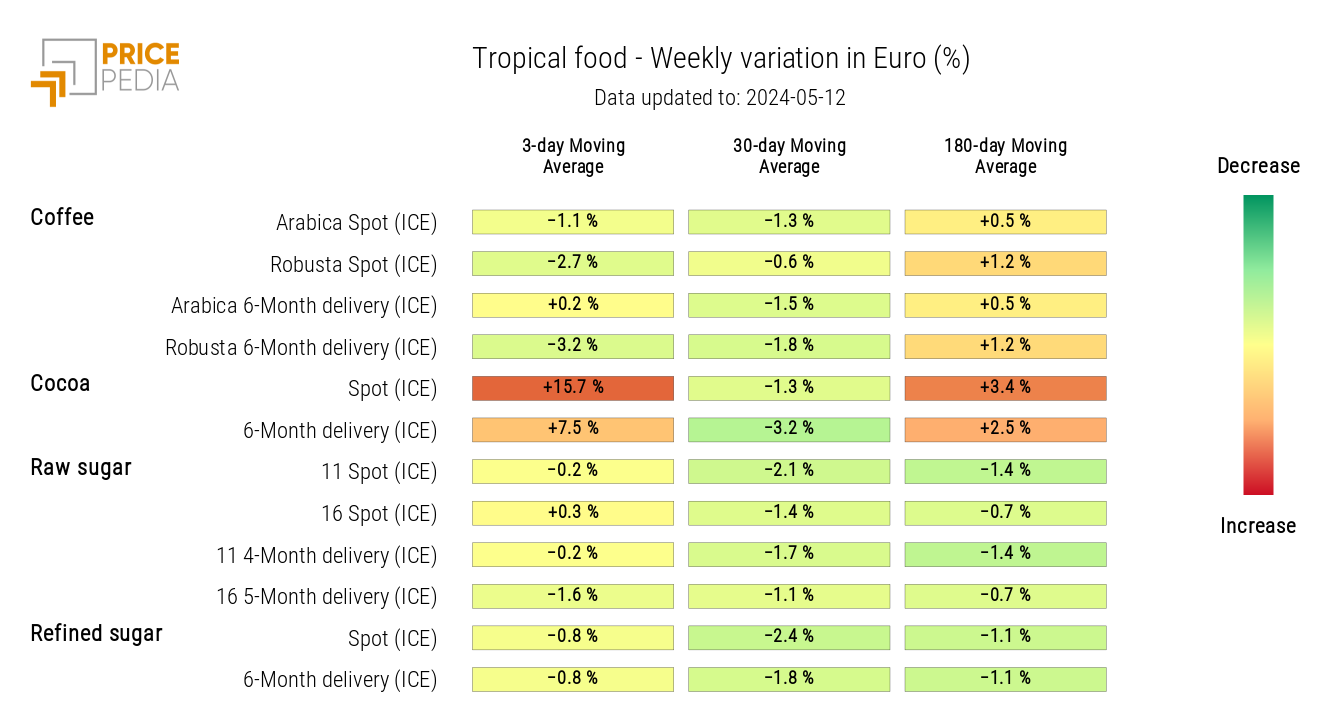
The tropical food heatmap shows the strong volatility of cocoa prices, which returned to a strong positive variation this week.
HeatMap of Tropical Food Prices in Euro
