Copper price gap increases on different financial markets
Is the growth of copper caused by the energy transition or by speculative factors?
Published by Luca Sazzini. .
Conjunctural Indicators Commodities Financial WeekRecent Dynamics of Copper Prices
This week in the commodity markets, there has been a significant increase in the price of copper, which has greatly exceeded the threshold of $10,000/ton.
However, the growth of copper prices has not been the same across different financial exchanges, as the price quoted on the Chicago Mercantile Exchange (CME) has experienced much higher increases compared to those recorded on the London Metal Exchange (LME) and the Shanghai Futures Exchange (SHFE).
Below are the historical series of spot copper prices quoted on different financial markets.
Historical Series of Spot Copper Prices on Financial Markets
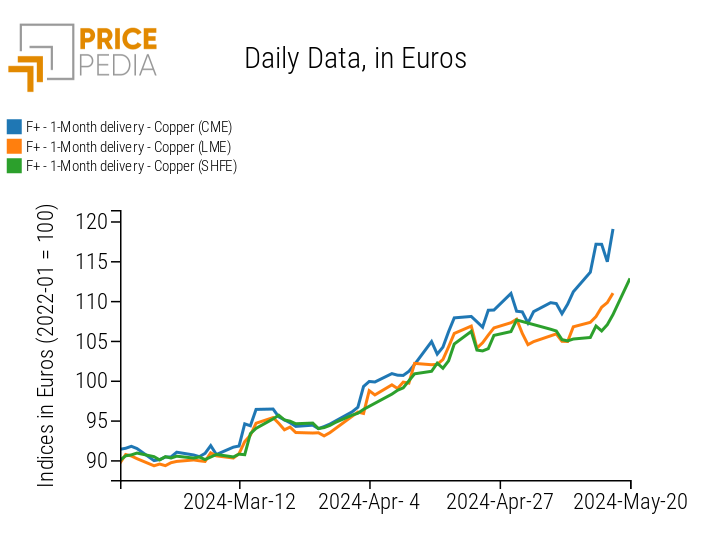
The analysis of the chart clearly shows that the price of copper quoted on the Chicago Mercantile Exchange has recorded greater increases compared to those on other financial markets. The price peak occurred on Friday, May 17, when the closing price of copper was $5.06/lb, equivalent to $11,150/ton.
This strong price growth is partly attributable to the scarcity of copper inventories and the recent increase in demand from electric vehicles (EVs) and new technologies related to artificial intelligence and automation.
However, these aspects alone are not sufficient to explain the rise in the CME copper price this week. The most likely explanation is that the increase in CME copper prices is mostly due to speculative factors. This could explain why the CME copper price has risen more than that of other exchanges, as the Chicago Mercantile Exchange is the preferred financial market for traders to conduct speculative operations on copper prices.
Another aspect that may have contributed to the price increase is that the excess copper produced in China is not suitable for delivery within the CME and therefore could not meet the excess demand in the US market. Additionally, much of the copper available on the Russian market cannot be sold within the CME market due to the recent ban introduced by the exchange.1
Inflation Dynamics
US Inflation
After a difficult first quarter, the April data on the CPI (Consumer Price Index) begins to show the first signs of a slowdown in US inflation.
The headline inflation and core inflation both show a monthly reduction of -0.1% m/m. The annual variations of the two indices also show signs of slowing: the headline index drops from 3.5% to 3.4%, while the core index, excluding the most volatile components, slows to 3.6% from the previous 3.8%.
Energy prices have recorded the highest increases over the past month.
However, the prices of non-housing services, which had risen in the first quarter of 2024 and contributed to the stickiness of US inflation, have started to decline again.
Overall, the new April data on the US consumer price index is reassuring, but not sufficient to change the forecasts for the next interest rate cuts by the Federal Reserve (FED). For now, the possibility of a rate cut by the FED before the September 2024 meeting remains excluded.
China Inflation
The new data regarding Chinese inflation indicates a consumer price growth of 0.3% y/y in April, compared to 0.1% y/y in March.
The core inflation is growing but remains low, rising from 0.6% y/y in March to 0.7% y/y in April.
The deflation in producer prices has reduced from -2.8% y/y in March to -2.5% y/y in April, while the deflation in purchase prices has decreased from -3.5% y/y in March to -3% y/y in April.
[1] The introduction of delivery bans on Russian metals within Western financial exchanges is discussed in the following article: New turbulence in non-ferrous markets.
ENERGY
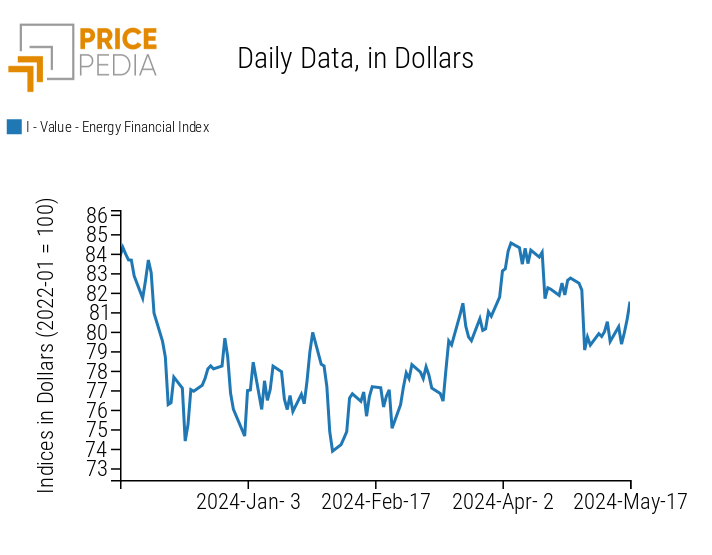
The financial index of energy prices undergoes continuous short-term fluctuations without showing a clear price trend. The uncertainty related to energy prices is tied to both the oil price and the gas price trends.
The oil market has remained around the same price levels for a long time, while it waits for a possible production cut by OPEC+.
In the European gas market, despite fundamentals suggesting a decrease in prices due to high storage levels, the TTF price continues to fluctuate around the same levels without following a clear downward trend, mostly due to speculative factors.
PricePedia Financial Index of Dollar Energy Prices
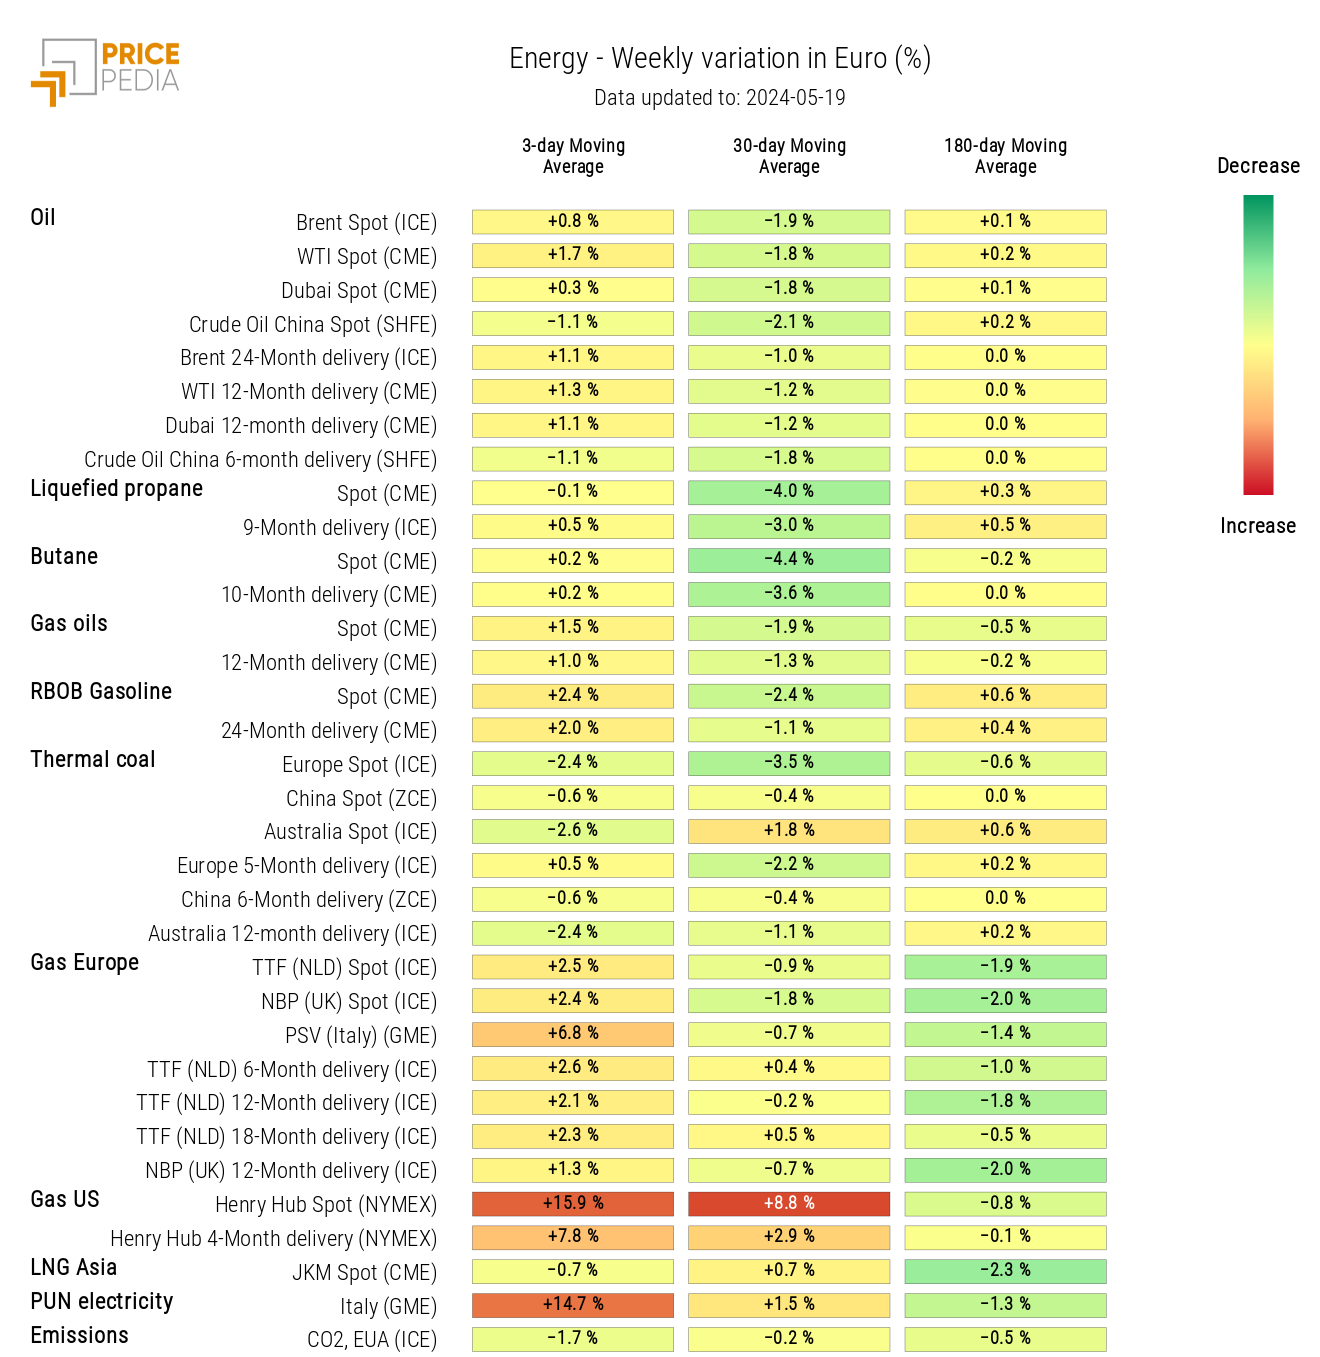
The energy heatmap indicates an increase in US natural gas and PUN prices.
HeatMap of Energy Prices in Euro
PLASTICS
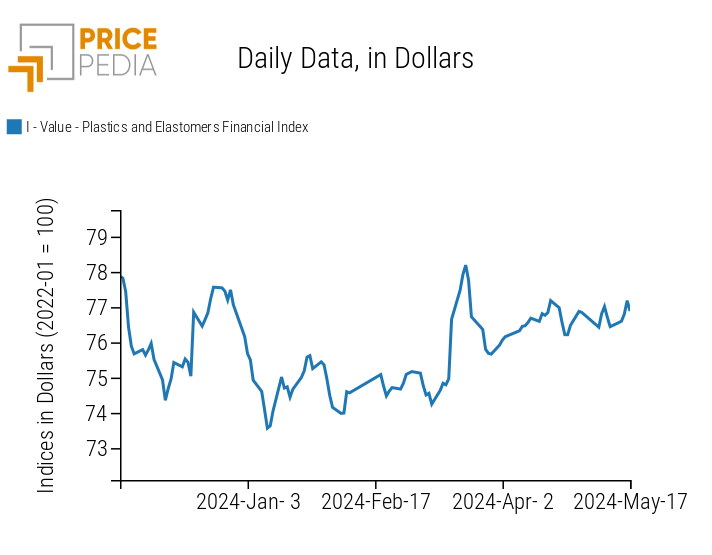
The financial index of plastics and elastomers experiences a slight upward fluctuation caused by the increase in the price of natural rubber RSS3.
PricePedia Financial Indices of Dollar Plastics Prices
FERROUS METALS
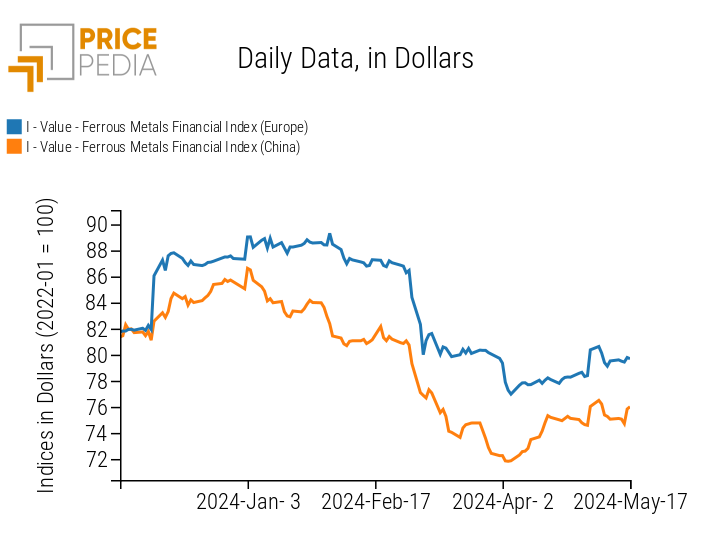
The price levels of ferrous indices continue to remain stable but close the week with a slight positive fluctuation, more accentuated in China.
PricePedia Financial Indices of Dollar Ferrous Metals Prices
Do you want to stay up-to-date on commodity market trends?
Sign up for PricePedia newsletter: it's free!
INDUSTRIAL NON-FERROUS METALS
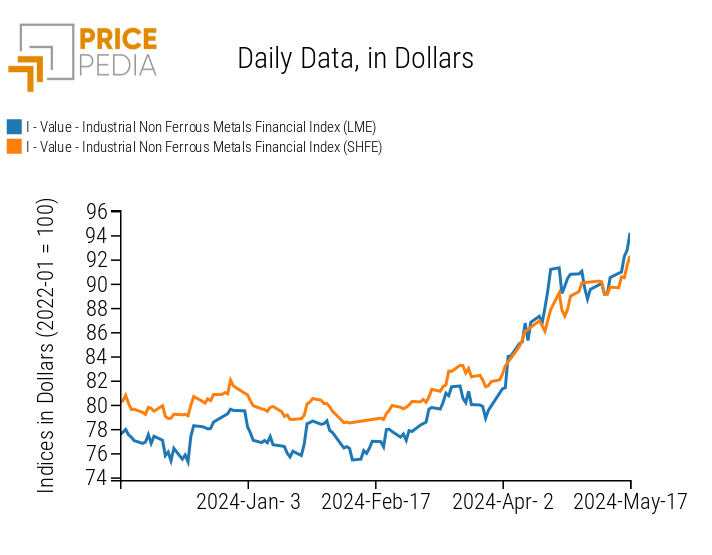
Both non-ferrous indices record a further increase in prices, consolidating the upward trend that began at the end of March.
PricePedia Financial Indices of Dollar Industrial Non-Ferrous Metals Prices
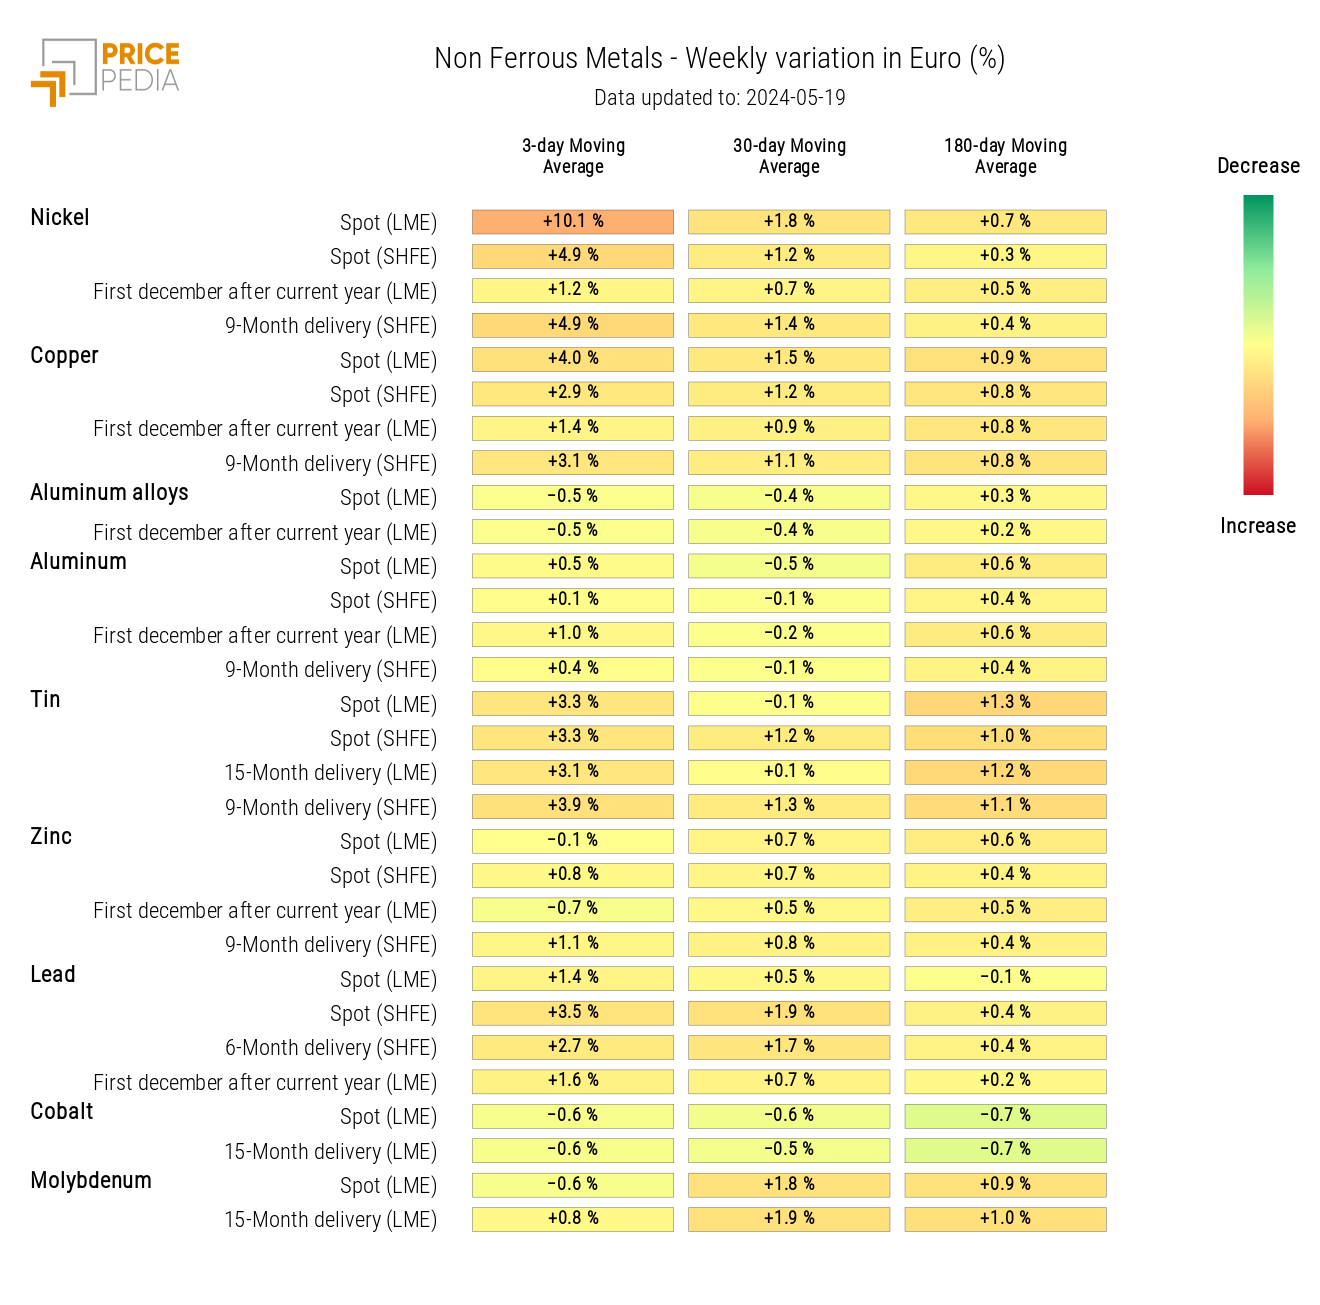
The non-ferrous heatmap shows that the recent price increase not only involves copper but also nickel and tin.
HeatMap of Industrial Non-Ferrous Metals Prices in Euro
FOOD
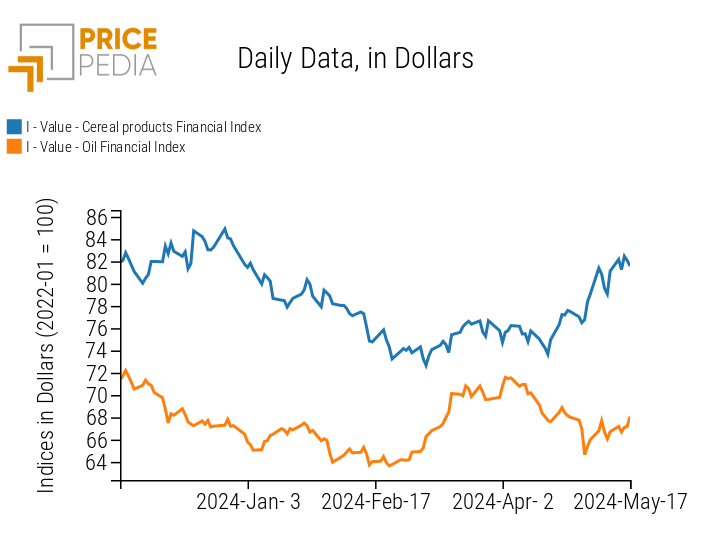
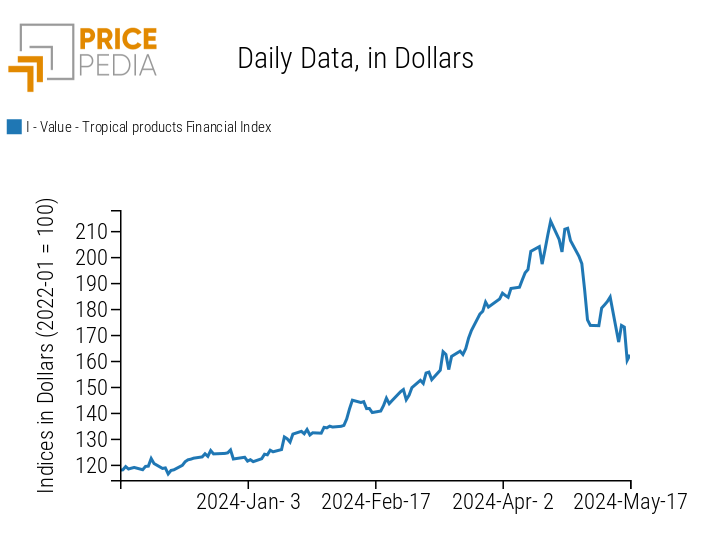
The financial indices of cereals and edible oils have experienced some fluctuations, maintaining a positive trend. Conversely, the tropical index is following a downward trend.
| PricePedia Financial Indices of Dollar Food Prices | |
| Cereals and Oils | Tropicals |
|
|
CEREALS
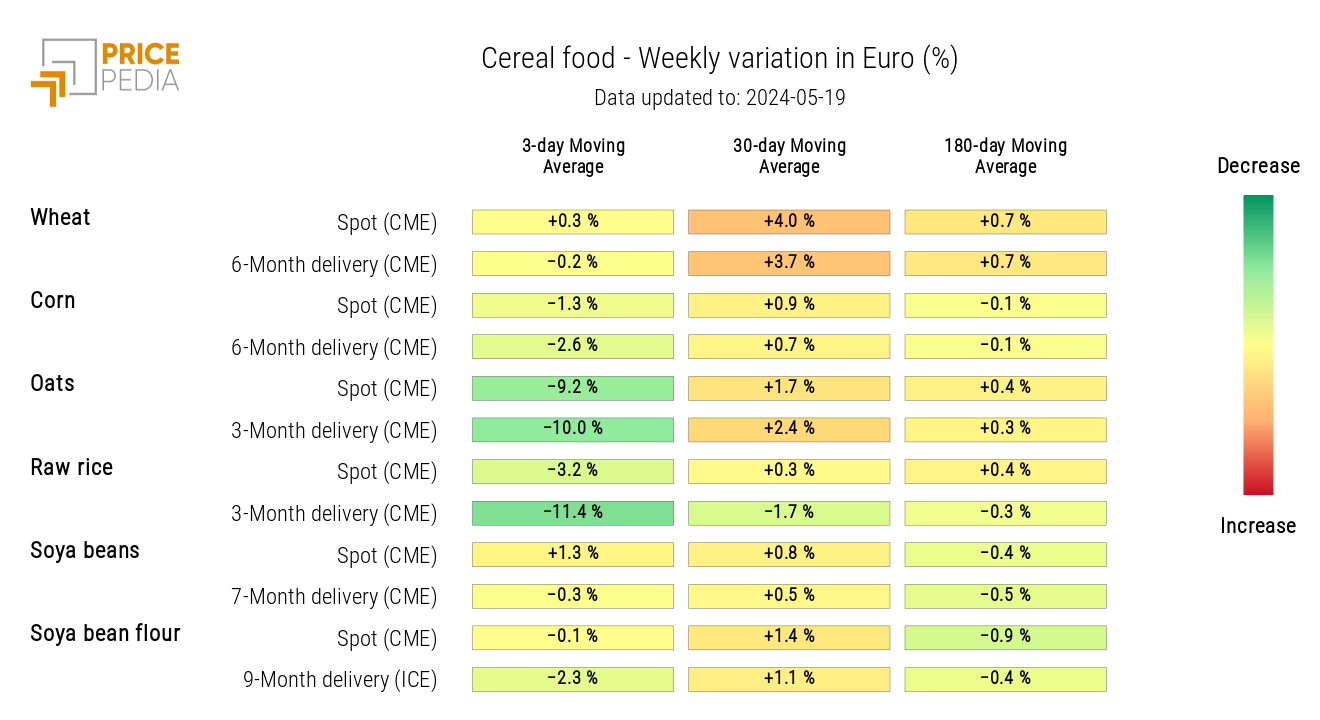
The cereals heatmap shows a decrease in oats and rice prices.
HeatMap of Cereals Prices in Euro
TROPICALS
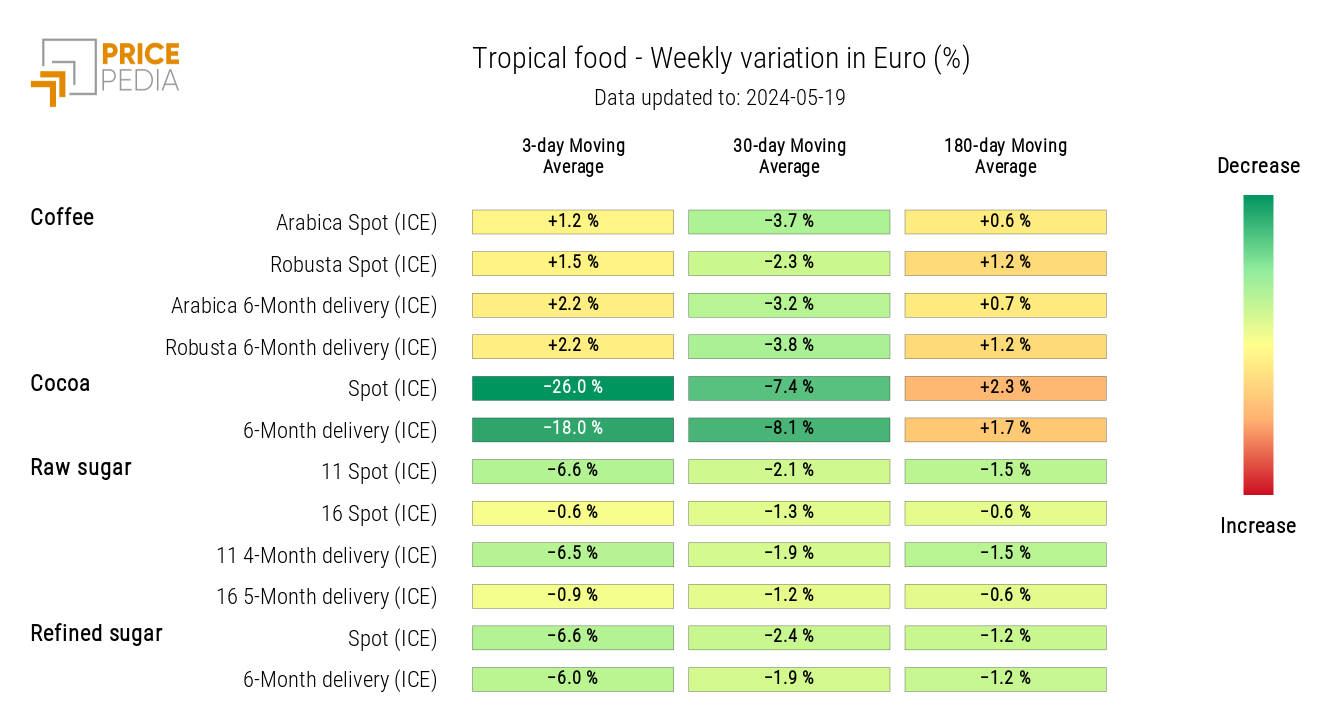
The tropicals heatmap highlights the continued volatility in cocoa prices, which have seen a sharp drop this week after last week's increase.
HeatMap of Tropical Food Prices in Euro
