Update of aluminium prices to May 2024
Analysis of financial benchmarks and aluminium customs prices
Published by Luca Sazzini. .
Non Ferrous Metals Aluminium Price DriversWithin financial markets, there are two global benchmarks for aluminum prices: the first is the spot price quoted on the London Metal Exchange (LME), and the second is the spot price quoted on the Shanghai Futures Exchange (SHFE).
The LME price is the primary reference point for Western markets, while the SHFE price represents the main benchmark for Asian markets.
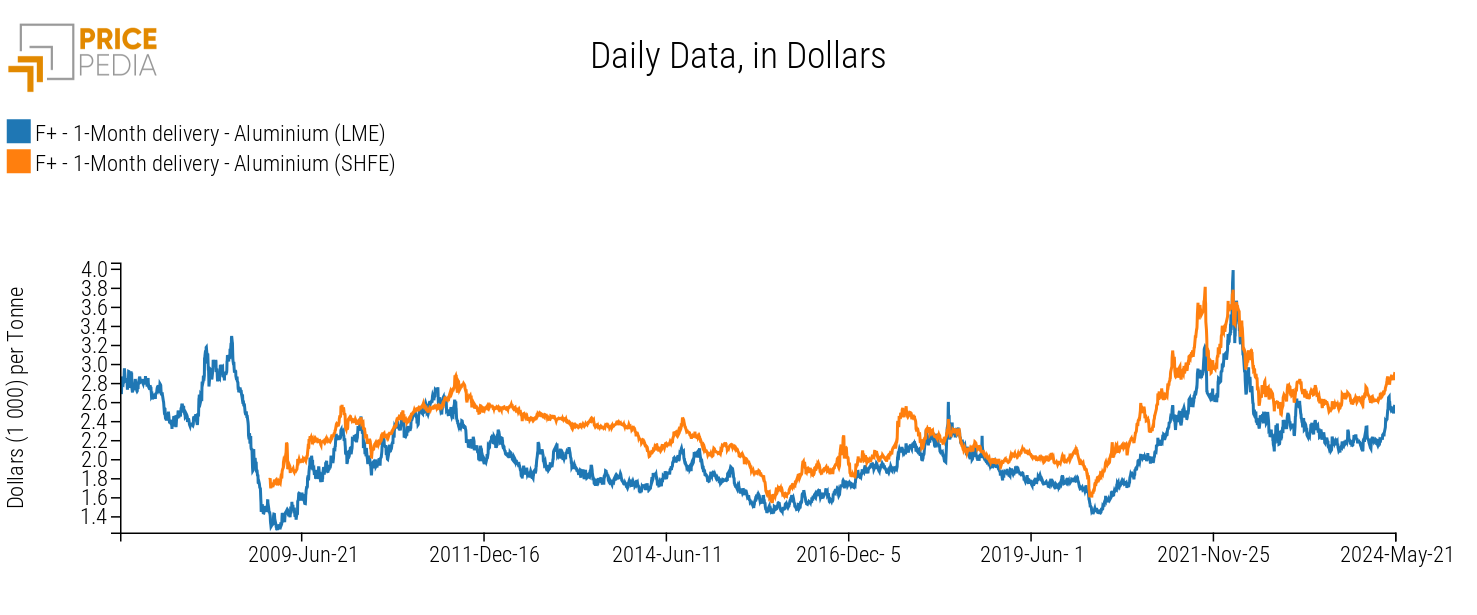
The following chart compares the spot prices expressed in dollars per ton of the two financial benchmarks for aluminum prices.
Financial Benchmarks of Aluminum Prices

The analysis of the chart shows that both financial prices tend to follow the same dynamics, but they record slightly different price levels. The aluminum price quoted in Shanghai, in fact, includes the VAT (13%) and other indirect taxes, making it generally more expensive than the European one.
To more clearly analyze the dynamics of the two aluminum prices, a table showing the annual averages of the two aluminum prices from 2019 to 2024 is provided.
Table of Financial Aluminum Prices, expressed in $/ton
| 2019 | 2020 | 2021 | 2022 | 2023 | 2024 | |
|---|---|---|---|---|---|---|
| F+-1 Month Delivery-Aluminum (LME) | 1791 | 1704 | 2475 | 2703 | 2249 | 2304 |
| F+-1 Month Delivery-Aluminum (SHFE) | 2014 | 2053 | 2937 | 2975 | 2638 | 2711 |
The table analysis highlights the dynamics of the annual averages of spot prices over the past few years:
- 2019-2020: Aluminum prices remained relatively constant, with a slight decline on the LME and a slight increase on the SHFE. These weak differences in price changes can be attributed to the presence of asymmetric information, which created arbitrage opportunities;
- 2020-2021: A phase of price growth supported by excess demand and rising energy costs necessary for aluminum production through electrolysis;1
- 2021-2022: During this phase, LME aluminum prices reached a new historical high due to the Russian invasion of Ukraine;
- 2022-2023: A phase of aluminum price reduction due to a decrease in global demand and a drop in energy commodity prices;
- 2023-2024: Aluminum prices rebounded due to expectations of increased demand for non-ferrous metals to implement the energy transition.
To provide a broader analysis of the aluminum market, the analysis of financial prices is extended to physical prices recorded at the customs of the 27 European Union countries.
Do you want to stay up-to-date on commodity market trends?
Sign up for PricePedia newsletter: it's free!
Custom Aluminum Prices in the EU
In the analysis of European customs aluminum prices, a division into 3 subcategories was chosen:
- prices of raw materials necessary for the production of primary aluminum;
- prices of raw materials used for the production of secondary aluminum;
- prices of unalloyed aluminum, or pure aluminum not containing other metals.
Raw materials for primary aluminum
The most important raw material for the production of primary aluminum is bauxite, which occurs naturally as a mineral. From it, alumina can be extracted, an intermediate product necessary for the production of metallic aluminum.
Within the European customs market, prices for both aluminum minerals (bauxite) and alumina are present.
Table of European Customs Prices of Commodities Used for the Production of Primary Aluminum, expressed in €/ton
| 2019 | 2020 | 2021 | 2022 | 2023 | 2024 | |
|---|---|---|---|---|---|---|
| D-Last Price EU-Aluminium ores | 54.2 | 51.8 | 48.1 | 78.5 | 72.1 | 61.2 |
| D-Last Price EU-Alumina | 380.9 | 347.0 | 363.0 | 474.3 | 571.1 | 581.1 |
The dynamics of the two prices reported in the table are very similar, except for 2021, a period characterized by a reduction in aluminum mineral prices and an increase in alumina prices, attributable to rising energy costs. Alumina is, in fact, a product extracted from bauxite through a production process that involves high energy costs.
Raw materials for secondary aluminum production
Raw materials for secondary aluminum production
Below is a table showing the annual average prices of commodities used for secondary aluminum production.
Table of European customs prices of commodities used for secondary aluminum production, expressed in €/ton
| 2019 | 2020 | 2021 | 2022 | 2023 | 2024 | |
|---|---|---|---|---|---|---|
| D-Last Price EU-Aluminium shavings | 816 | 772 | 1219 | 1333 | 1263 | 1287 |
| D-Last Price EU-Aluminium waste | 1129 | 993 | 1500 | 1892 | 1609 | 1608 |
| D-Last Price EU-Aluminum scrap | 1124 | 995 | 1404 | 1827 | 1544 | 1543 |
The inputs used for secondary aluminum production are characterized by even higher price levels than alumina. These inputs, in fact, require much lower energy costs compared to aluminum production via alumina. Another feature that emerges from the table analysis is the price increase that occurred in the 2020-2022 period followed by a subsequent price drop attributable to the decline in global commodity demand.
Unalloyed Aluminum
Since aluminum is a perfectly recyclable product, within the EU market, the distinction between primary and secondary aluminum is limited, as both types are characterized by the same level of quality. Below are some types of unalloyed aluminum available in the European market.
Table of European customs prices of unalloyed aluminum, expressed in €/ton
| 2019 | 2020 | 2021 | 2022 | 2023 | 2024 | |
|---|---|---|---|---|---|---|
| D-Last Price EU-Unalloyed unwrought aluminium | 2007 | 1886 | 2709 | 3269 | 2639 | 2493 |
| D-Last Price EU-Unalloyed aluminum wire | 2220 | 2074 | 2892 | 3419 | 3079 | 2971 |
| D-Last Price EU-Unalloyed aluminum sheets | 2861 | 2741 | 3458 | 4392 | 3736 | 3442 |
| D-Last Price EU-Unalloyed aluminum profiles | 3885 | 3911 | 4534 | 5550 | 5168 | 5004 |
The types of unalloyed aluminum traded in Europe follow the same price dynamics as the average prices but maintain very different price levels among themselves due to different production costs. The most expensive type of unalloyed aluminum is profiles, which in the first five months of 2024 had an average price level (5004 €/ton) more than double that of unalloyed crude aluminum (2493 €/ton).
Conclusions
The financial markets for aluminum are characterized by two different benchmarks: the spot price quoted on the London Metal Exchange (LME) and the spot price quoted on the Shanghai Futures Exchange (SHFE). Among these benchmarks, the SHFE price tends to show slightly higher price levels as it incorporates VAT and other indirect taxes.
The analysis of European customs markets revealed that the commodities used for secondary aluminum production are priced higher than those used for primary aluminum production because they require lower energy costs for aluminum production.
The different types of unalloyed aluminum present in Europe showed similar price dynamics to that of crude aluminum but with significantly different levels due to different production costs. In particular, in the first five months of 2024, the price of unalloyed aluminum profiles was more than double that of unalloyed crude aluminum.
[1] See the Hall-Héroult process


