Update of non-energy hydrocarbon prices to May 2024
Is the hydrocarbons market global or regional?
Published by Luca Sazzini. .
Organic Chemicals Plastics and Elastomers Price Drivers
From an economic point of view, hydrocarbons can be distinguished between "energy" and "non-energy" hydrocarbons.
The former, which include oil and natural gas, play a vital role in the global economy by providing energy for heating, transportation, and electricity production.
The latter, although less important than the former, are crucial to the global economy for various reasons, mainly related to their industrial and chemical applications.
From the perspective of their uses, non-energy hydrocarbons can be divided into:
- Intermediates for plastics and elastomers
- Major intermediates for chemical synthesis
- Other intermediates for chemical synthesis
- Solvents and diluents
Analysis of EU customs prices
Intermediates for plastics and elastomers
The main hydrocarbons used as intermediates for plastics and elastomers are:
- ethylene for the production of polyethylene
- propylene for the production of polypropylene
- styrene for the production of polystyrene
- butadiene for the production of synthetic rubbers
The dynamics of the average annual prices of each of these products are reported in the following table.
| 2019 | 2020 | 2021 | 2022 | 2023 | 2024 | |
|---|---|---|---|---|---|---|
| D-Last Price EU-Ethylene | 882 | 680 | 975 | 1214 | 1030 | 998 |
| D-Last Price EU-Propylene | 866 | 683 | 1020 | 1294 | 978 | 937 |
| D-Last Price EU-Styrene | 887 | 640 | 1175 | 1420 | 1068 | 1063 |
| D-Last Price EU-Butadiene and Isoprene | 790 | 476 | 946 | 1163 | 799 | 770 |
The analysis of the table shows that the hydrocarbons used as intermediates for plastics and elastomers share the same price dynamics and have similar levels among themselves.
After an initial decline in the 2019-2020 biennium, there was a price recovery phase that reached its peak in 2022. Subsequently, due to the greater global weakness and the fall in oil prices, there was a sharp reduction in price levels, which continued into the early months of 2024.
Major intermediates for chemical synthesis
The following table reports the average annual prices of the two most important hydrocarbons used for chemical synthesis, namely benzene and butene.
| 2019 | 2020 | 2021 | 2022 | 2023 | 2024 | |
|---|---|---|---|---|---|---|
| D-Last Price EU-Benzene | 611 | 443 | 865 | 1009 | 878 | 923 |
| D-Last Price EU-Benzene from coal tar | 460 | 323 | 646 | 809 | 678 | 758 |
| D-Last Price EU-Butene | 860 | 697 | 920 | 1298 | 1112 | 1129 |
In terms of price levels, butene is the most expensive product, while coal tar benzene is the cheapest, as it is commercially less valuable than benzene.
The price dynamics of these three prices in recent years have been the same as those of hydrocarbons used as intermediates for plastics and elastomers, except for the most recent months.
In the first months of 2024, in fact, the prices of the major intermediates for chemical synthesis experienced a slight recovery, in contrast to those of the intermediates for plastics and elastomers, which continued to decline.
Do you want to stay up-to-date on commodity market trends?
Sign up for PricePedia newsletter: it's free!
Other intermediates for chemical synthesis
The following table shows the prices of other intermediates used in chemical synthesis for more specific applications than those of large intermediates.
| 2019 | 2020 | 2021 | 2022 | 2023 | 2024 | |
|---|---|---|---|---|---|---|
| D-Last Price EU-Cumene | 701 | 575 | 911 | 1141 | 929 | 1145 |
| D-Last Price EU-Naphthalene from coal tar | 442 | 433 | 605 | 1138 | 922 | 858 |
| D-Last Price EU-o-Xylene | 839 | 584 | 787 | 1395 | 1257 | 1197 |
| D-Last Price EU-p-Xylene | 814 | 534 | 750 | 1133 | 1011 | 992 |
| D-Last Price EU-Ethylbenzene | 738 | 604 | 879 | 1118 | 930 | 980 |
In the first months of 2024, the price of cumene is close to that of benzene and butene prices, while the prices of other chemical synthesis intermediates are closer to the dynamics of intermediates for plastics and elastomers.
Solvents and diluents
The following table shows the annual averages of customs prices for hydrocarbons found to be most widely used as solvents and diluents.
| 2019 | 2020 | 2021 | 2022 | 2023 | 2024 | |
|---|---|---|---|---|---|---|
| D-Last Price EU-White spirit | 792 | 628 | 714 | 1391 | 1090 | 1090 |
| D-Last Price EU-Toluene | 643 | 397 | 650 | 1045 | 985 | 969 |
| D-Last Price EU-Toluene from coal tar | 598 | 380 | 604 | 1017 | 911 | 866 |
| D-Last Price EU-Xylenes from coal tar | 625 | 380 | 606 | 955 | 837 | 860 |
On the other hand, some slight price differences emerged for the first five months of 2024. White spirits continued to maintain the same price level as in 2023, tar xylenes followed a slight increase while the two toluene prices showed a slight decrease.
Comparison of European and Chinese prices
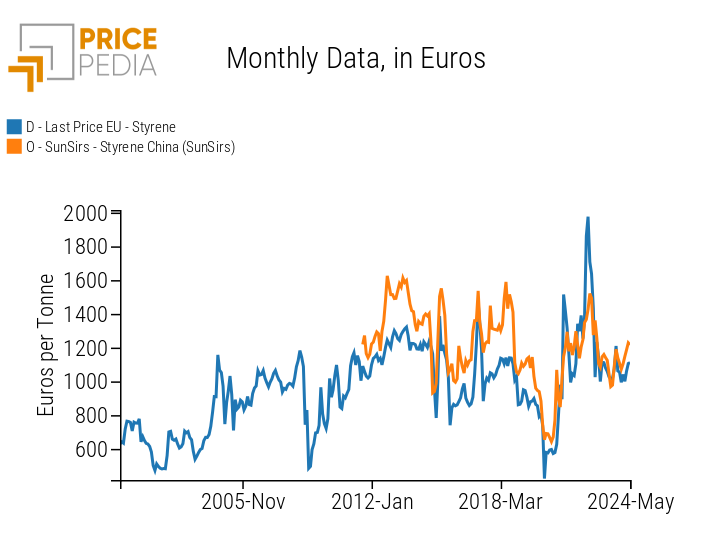
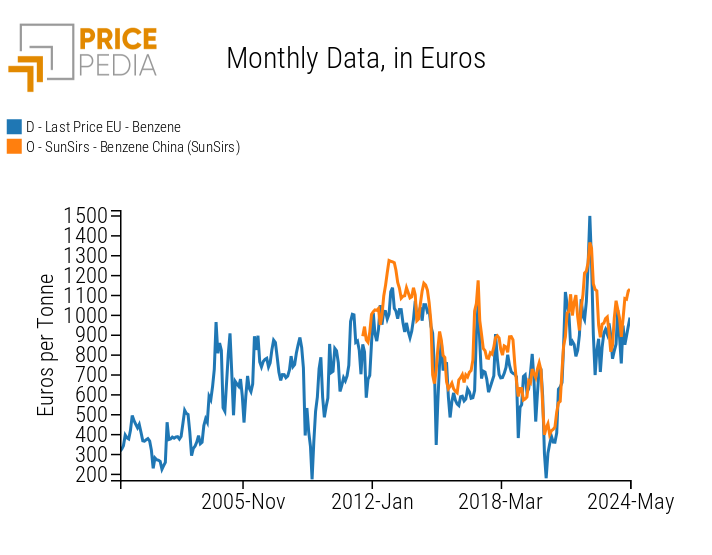
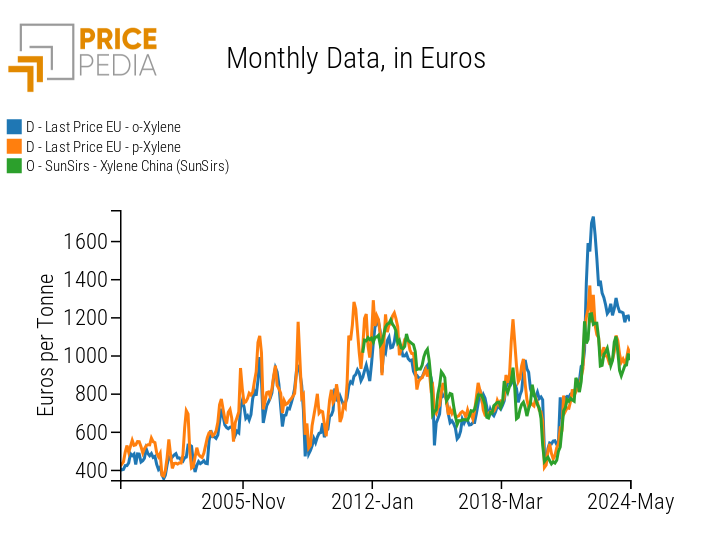
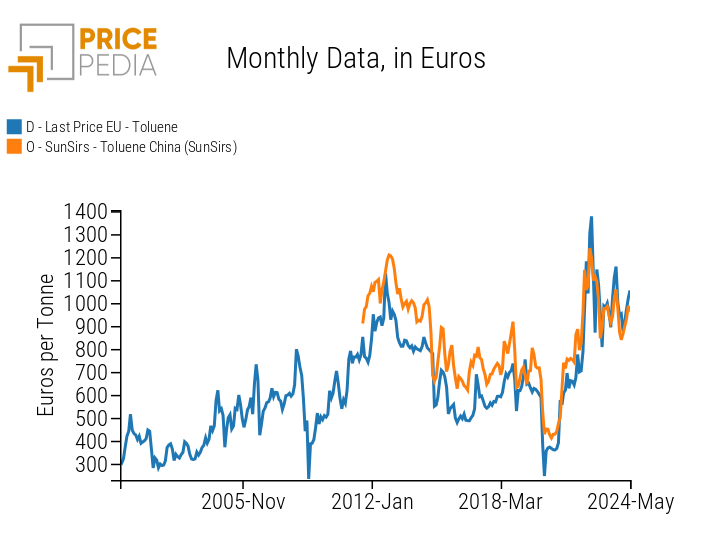
In order to provide an initial indication of the existence of different regional markets or a single global market for the different commodities analysed, a comparison between the European price time series and the Chinese price time series from SunSirs was made in the following section.
The following graphs compare European and Chinese prices for four commodities, one for each hydrocarbon group described above.
| Comparison of European and Chinese styrene prices | Comparison of European and Chinese benzene prices |
|
|
| Comparison of European and Chinese xylene prices | Comparison of European and Chinese toluene prices |
|
|
As is clear from the analysis of the 4 charts, there is a strong correlation between European and Chinese prices. In other words, prices in the two markets tend to have similar levels and move in the same way. This leads to the hypothesis that there is a world market for non-energy hydrocarbons with strong contamination between the various regional markets.
Conclusion
Despite the fact that non-energy hydrocarbons are a broad family of very different products, the prices of individual hydrocarbons showed very similar dynamics between them in the period from 2019 to 2023. After an initial decline in 2020, the prices of the various hydrocarbons followed an upward trend until 2022, before falling again during 2023.
A comparison of European and Chinese customs prices showed a strong alignment in terms of both dynamics and levels.
This conclusion leads to the assumption of the existence of a world hydrocarbon market with a single global supply and demand, to which the different regional realities contribute.

