Second week of falling financial commodity prices
The postponement of the significant interest rate reduction phase until 2025 has weakened the upward pressure on prices
Published by Luca Sazzini. .
Conjunctural Indicators Commodities Financial WeekFirst ECB Interest Rate Cut
On Thursday, June 6, the European Central Bank (ECB) implemented the first interest rate cut of 25 basis points, as widely anticipated by analysts.
The new deposit rate is 3.75%, the refinancing operations rate is 4.25%, and the marginal refinancing rate is 4.5%.
The ECB's decision to make an initial rate cut is justified by the reduction in inflation and the decline in future price growth expectations. However, President Christine Lagarde clarified that the decision to cut rates was not unanimous.
The ECB seems to remain cautious about the future of monetary policy, avoiding explicitly stating when the next interest rate cut will occur. The central bank's approach will remain strongly data-driven, and decisions for potential cuts will be made on a meeting-by-meeting basis.
Currently, the market expects the next rate cut at the meeting on September 12, while the date for the third cut remains more uncertain. If inflation data shows significant declines, a possible first date could be December 12; otherwise, it will be postponed to 2025.
Despite this initial reduction in interest rates by the ECB, financial analysts share the opinion that a significant decrease in rates on both sides of the Atlantic will not be seen until 2025.
Growth of China's Services PMI
The latest data from Caixin indicates an unexpected growth in the Chinese services PMI, which in May reached 54 points, compared to 52.5 recorded in April. This growth is certainly more intense than that recorded by the NBS, which showed an increase in the services PMI from 50.3 to 50.5.
Both surveys, however, confirm an improvement in China's tertiary sector, which remains in an expansionary phase[1] for the seventeenth consecutive month.
Commodity Trends
The financial markets of commodities have recorded a general reduction in price levels particularly intense in the first days of the week, with the exception of the tropical food sector, which continues to follow an upward trend.
The sectors that experienced the most significant declines at the beginning of the week are energy, non-ferrous metals, and cereals, with the difference that energy showed a greater recovery in the last few days. The ferrous metals and edible oils markets also recorded reductions in the early days of the week, but more contained compared to the aforementioned sectors.
Dynamics of Oil Prices
A commodity that experienced a sharp drop in prices at the beginning of the week is oil, which, despite the extension of OPEC production cuts to 2025, returned to a price level below $80/barrel.
Below is the historical series of oil prices quoted on the Intercontinental Exchange (ICE). The graph includes a line at the $80/barrel level to highlight the periods when the Brent price was above or below this level.
Brent Spot Prices in Dollars per Barrel, Quoted on the Intercontinental Exchange (ICE)
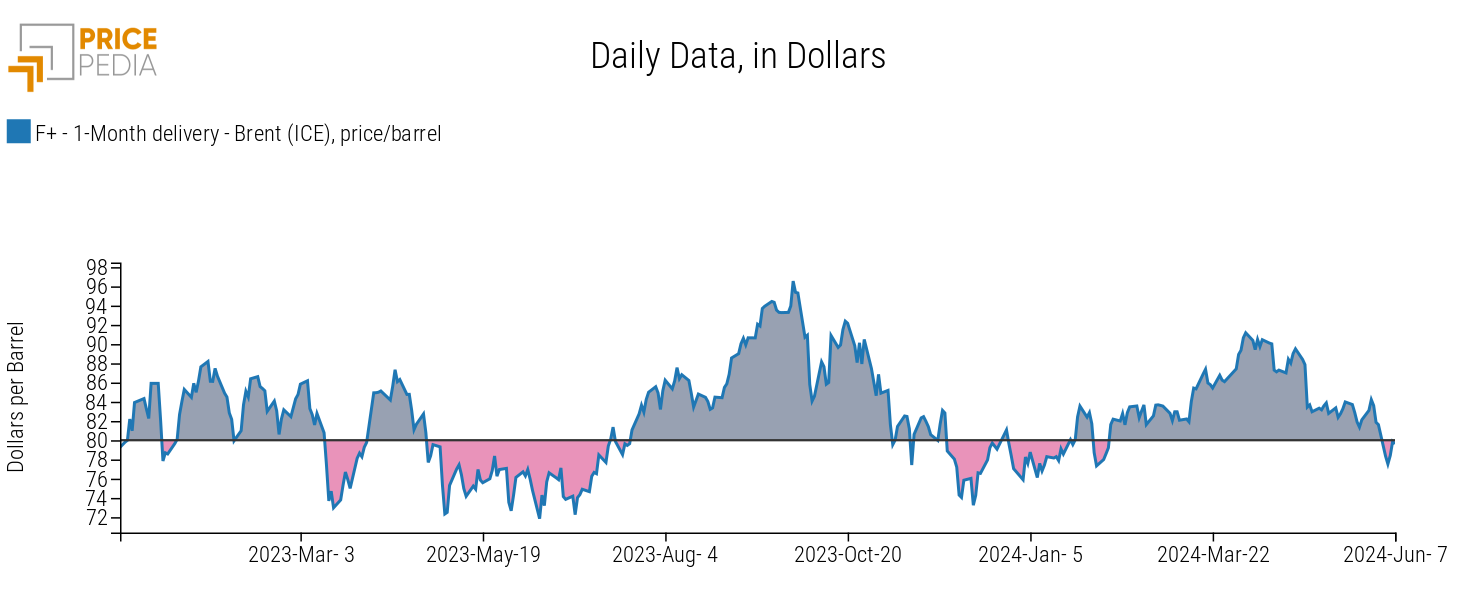
The analysis of the graph shows that, net of some short-term fluctuations, the price of oil continues to hover around $80/barrel, considered the informal reference price guiding OPEC+ decisions.
In a phase of strong economic and political uncertainty, this relative stability in oil prices is also the result
of OPEC's greater ability to formulate credible scenarios of future market demand and adjust
its supply to market conditions.
OPEC, in fact, forecasts a significant recovery in global oil demand only by the end of 2025.
For this reason, at the meeting on Sunday, June 2, mandatory production cuts for all Organization member countries were extended until December 2025, except for the United Arab Emirates, which obtained an increase in the production ceiling due to the recognition of their increased extraction capacity. In addition to mandatory production cuts, there are voluntary cuts made by some countries. These will also be maintained throughout 2024 and then gradually reduced during 2025.
[1] An expansionary phase is when the index value is above 50 points.
ENERGY
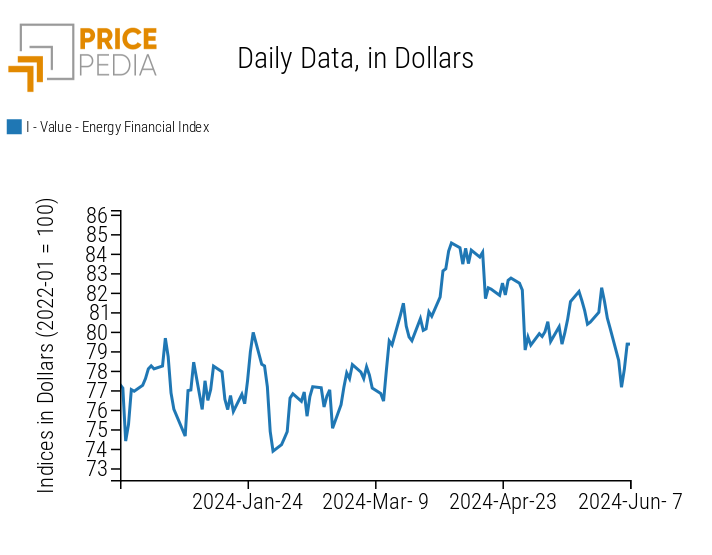
The energy products index recorded a sharp drop in the first days of the week, then partially recovered from Wednesday onwards.
PricePedia Financial Index of Energy Prices in Dollars
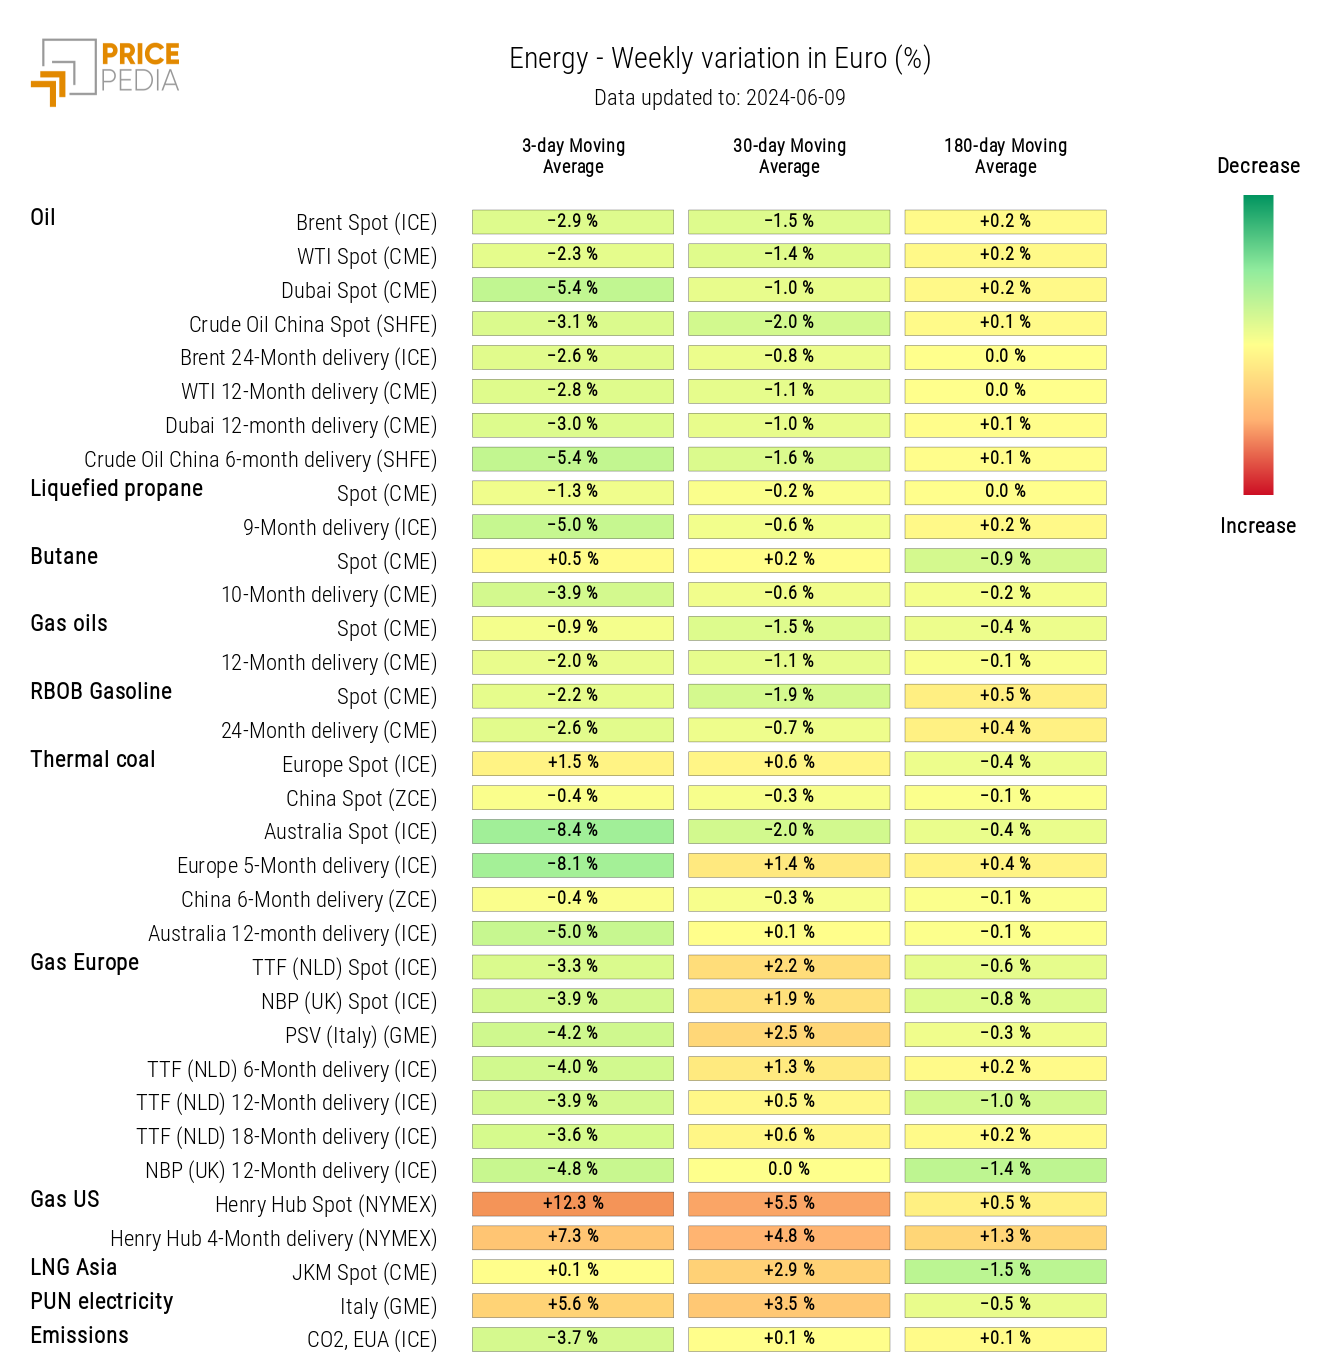
The energy heatmap highlights the general fall in prices, with the exception of Henry Hub (USA natural gas), thermal coal, and the PUN (Italian national single price of electricity)
HeatMap of Energy Prices in Euros
PLASTICS
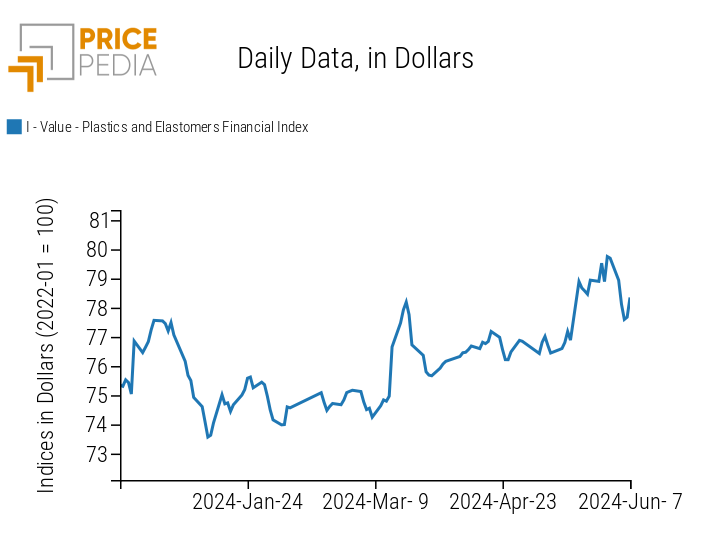
The financial index of plastics followed a price decline in line with the trend of oil prices.
PricePedia Financial Index of Plastics Prices in Dollars
FERROUS METALS
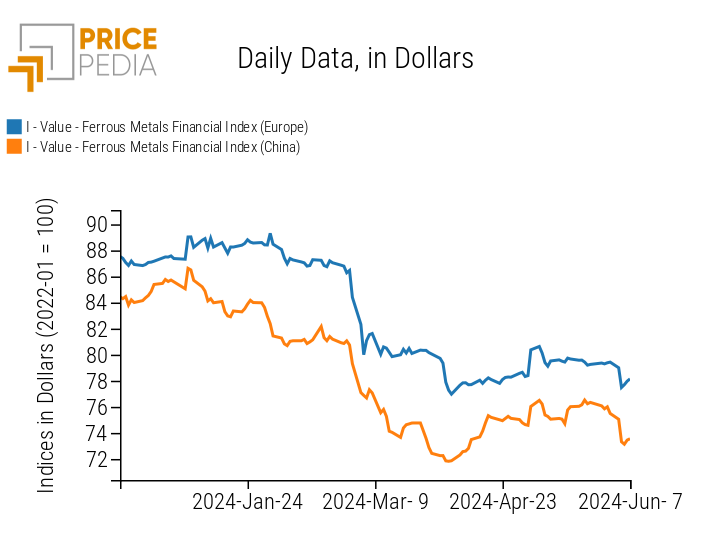
The ferrous metals indices recorded a price drop due to the decline in iron ore.
PricePedia Financial Index of Ferrous Metals Prices in Dollars
Do you want to stay up-to-date on commodity market trends?
Sign up for PricePedia newsletter: it's free!
NON-FERROUS INDUSTRIAL METALS
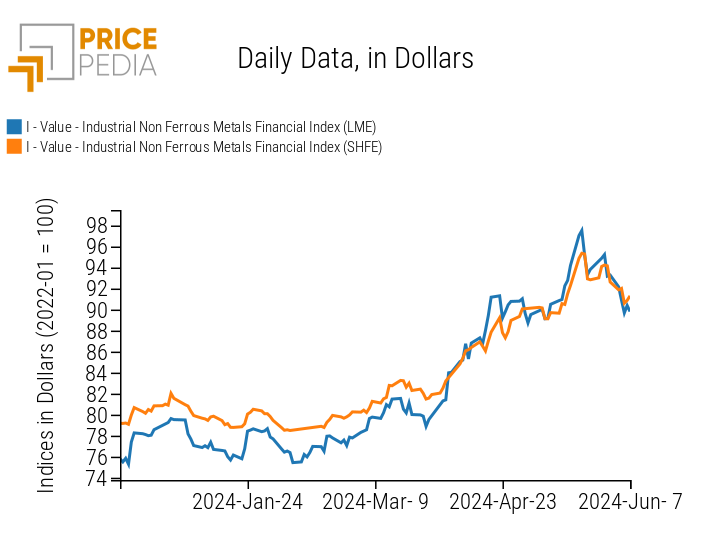
The reduction in prices of non-ferrous industrial metals quoted on both financial exchanges (London Metal Exchange and Shanghai Futures Exchange) continues, following their recent increase that had been amplified by speculative factors.
PricePedia Financial Index of Non-Ferrous Industrial Metals Prices in Dollars
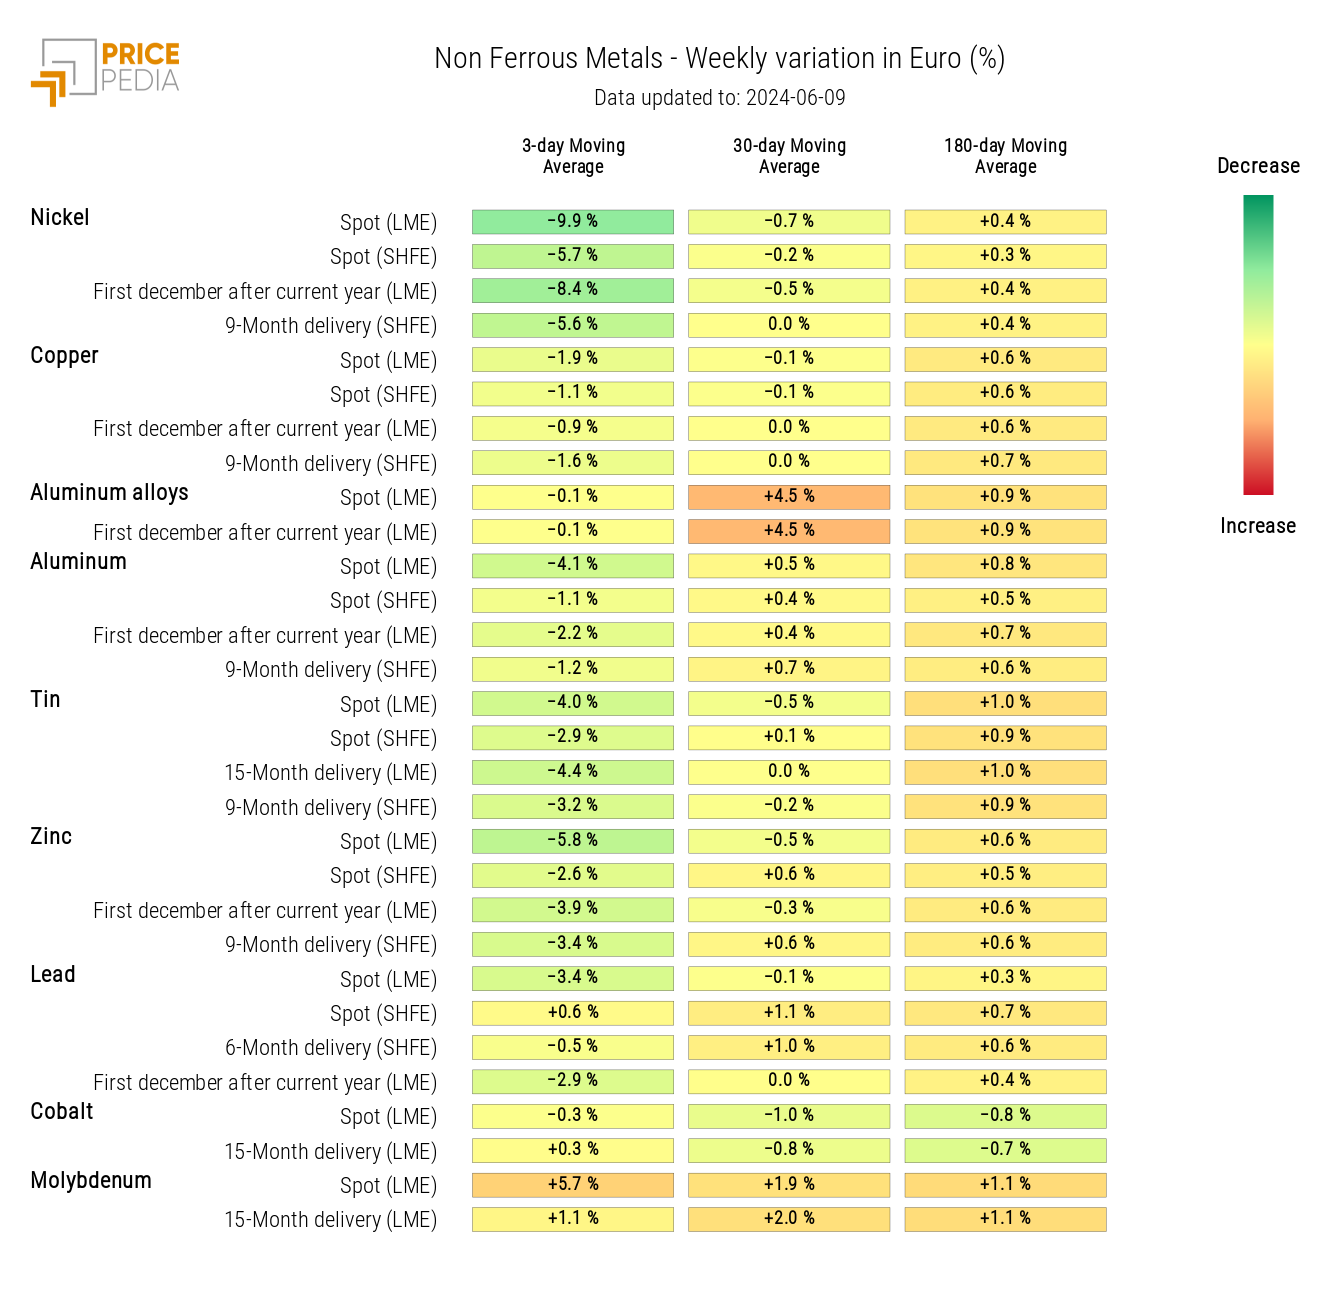
The non-ferrous heatmap reveals a negative weekly variation in the 3-day moving average for almost all non-ferrous prices, except for molybdenum and secondary aluminum alloys.
HeatMap of Non-Ferrous Industrial Metals Prices in Euros
FOOD COMMODITIES
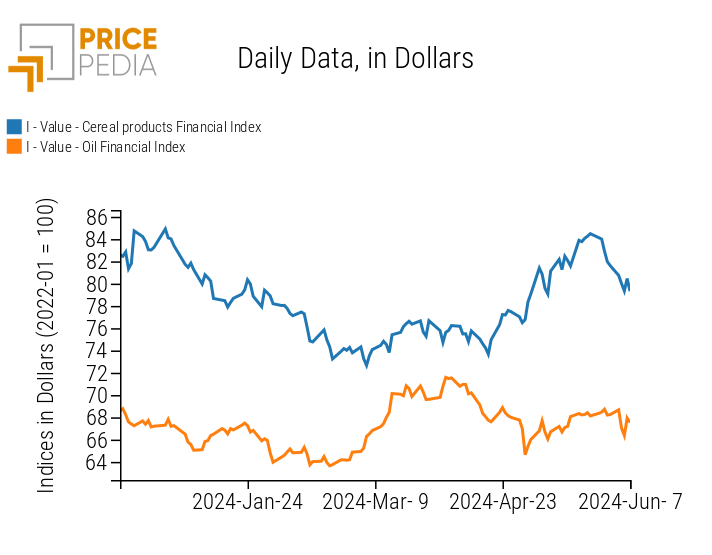
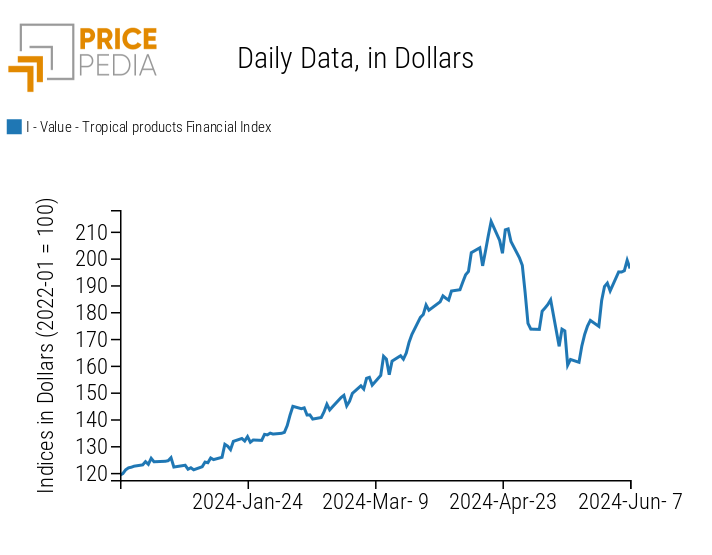
The analysis of the financial indices of food commodities shows a decline in cereals and oils, against an increase in the index of tropical products.
| PricePedia Financial Index of Food Prices in Dollars | |
| Cereals and Oils | Tropical Products |
|
|
CEREALS
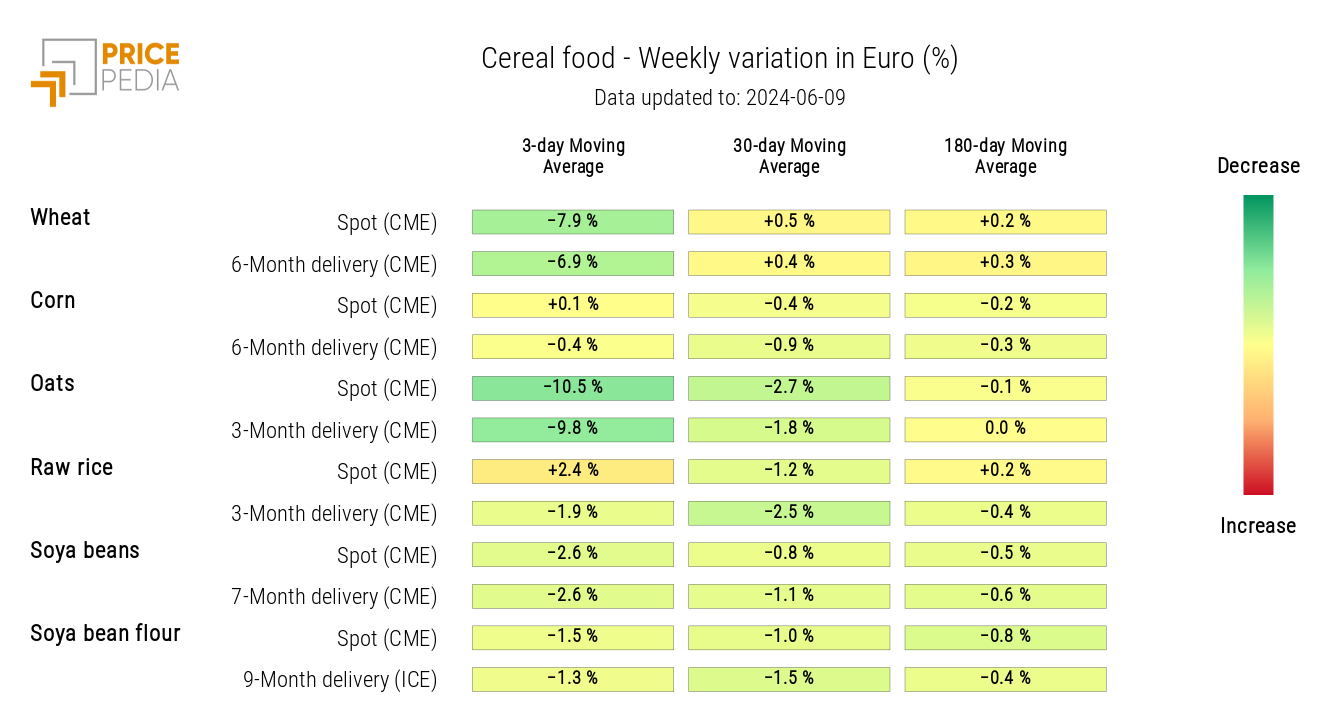
The cereals heatmap highlights the decline in wheat and oats prices.
HeatMap of Cereals Prices in Euros
TROPICAL PRODUCTS
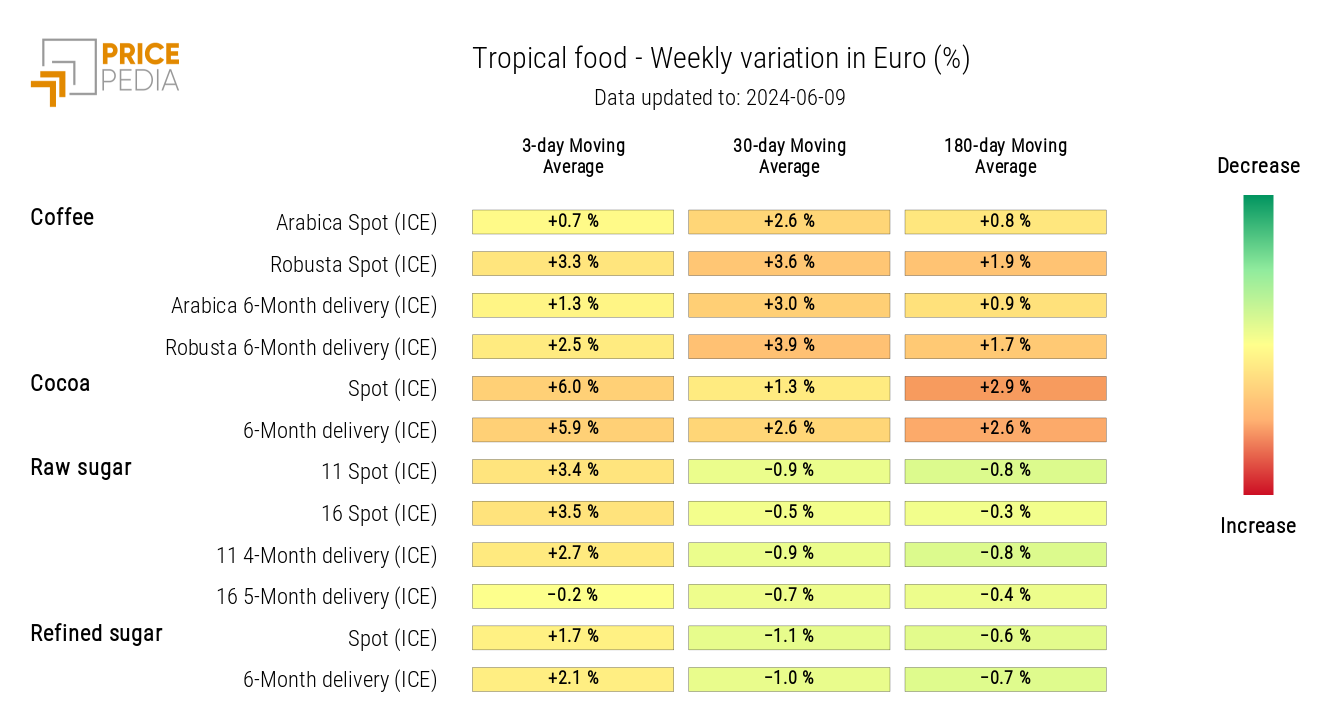
The heatmap below indicates a weekly increase in prices for all tropical food commodities listed on PricePedia.
HeatMap of Tropical Food Prices in Euros
