Update of urea prices to June 2024
Large difference between the Chinese export price of urea and its domestic price
Published by Luca Sazzini. .
Fertilizers Price DriversUrea is the most widely used nitrogen fertilizer in the world, thanks to its high nitrogen concentration (46%), which makes it more efficient for agriculture. The high nitrogen percentage allows urea to provide more nutrients than other fertilizers, given the same quantity used. Another advantage of urea is that, compared to other nitrogen fertilizers, it is a relatively inexpensive product. These factors make it an important raw material, especially for the European agricultural sector, which is heavily dependent on foreign imports of urea.
In this analysis, we will provide a June 2024 update on urea prices, showing the relationship between financial and physical prices, recorded at the customs of the three main geographical areas worldwide: the European Union, the United States, and China. We will also provide an analysis of the main urea-exporting countries worldwide to verify which countries experienced lower price increases during the 2021-2022 cycle, when a significant global imbalance between urea supply and demand occurred.
Urea Prices in Financial Markets
In financial markets, urea is traded both on regulated and unregulated markets, also known as "Over The Counter" (OTC)1. A financial price for urea observed in OTC markets is available on the Trading Economics website, while the price on regulated financial markets is quoted on the Chinese Zhengzhou Commodity Exchange (ZCE).
The following chart compares the Chinese price quoted on the Zhengzhou Commodity Exchange (ZCE) with the OTC price from Trading Economics.
Comparison of Urea Financial Prices

The comparison between the two historical series shows that the price on the Chinese domestic market, represented by the ZCE quotations, was more protected from the price increase during the 2021-2022 period, which led OTC prices to reach double the price levels compared to those on the ZCE financial market.
For a more in-depth analysis of price dynamics, we present a table containing the annual averages of the two financial prices from 2019 to 2024.
Annual Averages of Urea Financial Prices
| 2019 | 2020 | 2021 | 2022 | 2023 | 2024 | |
|---|---|---|---|---|---|---|
| F+-One Month Delivery-Urea China (ZCE) | N.A. | 210 | 310 | 378 | 315 | 279 |
| O-Trading Economics-Urea (Trading Economics) | 231 | 216 | 426 | 717 | 354 | 315 |
Both historical series show similar price dynamics, except for the 2021-2022 period, when OTC prices recorded much larger increases.
Faced with nearly identical price levels in 2020, the annual average of OTC prices more than doubled within a year compared to the growth in the annual average that occurred on the Chinese ZCE financial market. This variation in price growth is even more evident in 2022, when the Chinese financial price increased by only 68 euros/ton, while the OTC price grew by almost 300 euros/ton.
Do you want to stay up-to-date on commodity market trends?
Sign up for PricePedia newsletter: it's free!
Analysis of Urea Customs Prices
The following chart shows the comparison of physical prices recorded at European, US, and Chinese customs.
Comparison of Urea Customs Prices

Analysis of the chart highlights the strong alignment between European, American, and Chinese prices both in terms of dynamics and levels. The correlation between the various historical series is never below 0.95 (on a maximum of one), indicating the presence of a global urea market characterized by strong price contamination between the various customs markets.
Comparing the customs prices of Chinese urea exports with the previously reported financial prices shows that Chinese urea export prices are significantly higher than those on the domestic market quoted on the ZCE. Chinese customs export prices have, in fact, aligned with the price levels present in other regional markets. This aspect is even more evident from the analysis of the table of annual moving averages of urea customs prices.
Annual Averages of Urea Customs Prices
| 2019 | 2020 | 2021 | 2022 | 2023 | 2024 | |
|---|---|---|---|---|---|---|
| D-Last Price EU-Urea | 243 | 219 | 385 | 689 | 361 | 349 |
| D-Historical USA-Urea - Import | 261 | 229 | 370 | 590 | 377 | 367 |
| D-Last Price China-Urea | 262 | 225 | 339 | 554 | 407 | 391 |
The analysis of the historical series of the three customs prices confirms the alignment of price dynamics and levels in the three markets. In all three geographical areas, urea prices showed a significant increase in 2021-2022, recording levels almost double compared to the pre-crisis period. The price analysis in 2024 shows a significant decrease compared to 2022, though current price levels are higher than in the pre-crisis period.
Main Exporting Countries of Urea
Below is a horizontal bar graph representing the world's major urea exporters in 2023.
Main Urea Exporting Countries in 2023

From the horizontal bar chart, it emerges that China is the third largest exporter of urea in the world after Russia and Qatar. China's ability to be self-sufficient in urea production has allowed it to maintain a more stable price dynamic in the domestic urea market during the 2021-2022 period. However, this price stability in the domestic market did not extend to export prices, which adapted to the remaining international prices, although they remained slightly lower.
Europe, not being a producer of urea, remained heavily dependent on supply from Russia during the 2021-2022 period. This aspect led to a strong increase in prices in Europe due to possible fears of a potential supply shortage caused by the outbreak of the war in Ukraine. In those years, although Russian exports to Europe did not decrease, there was a complete halt in European imports from Ukraine and Belarus.
Europe thus sought to reduce its dependence on Russia by increasing imports of urea from the MENA (Middle East-North Africa) region.
This aspect, combined with the alleviation of fears related to supply shortages in the EU market, contributed to bringing European price levels in line with those recorded in other regional markets as early as 2023.
Conclusions
The high correlation between the various regional urea prices confirmed the hypothesis of the existence of an international urea market characterized by similar prices.
During the period of excess demand in 2021-2022, China, one of the main producers and exporters of urea, kept domestic urea prices quoted on the ZCE financial market relatively low (378 euros/ton), but adjusted its export prices to the prevailing world market price (543 euros/ton).
The country that experienced the highest price increases was the European Union due to its excessive dependence on Russian exports, which led the EU to rush to purchase urea due to fears of a possible reduction in Russian supply.
You may be interested in:
EU: Russia's new dependency is urea
Published by Giuseppe Pierri. .
Fertilizers Commodity price cycle 2020-2023Urea has replaced natural gas as an element of dependence on Russian imports [ Read all ]

China is strengthening its position in the global phosphate industry
Published by Luigi Bidoia. .
Fertilizers Critical raw materialsParticularly in calcium phosphate chemicals, the Chinese industry is increasingly a leader [ Read all ]
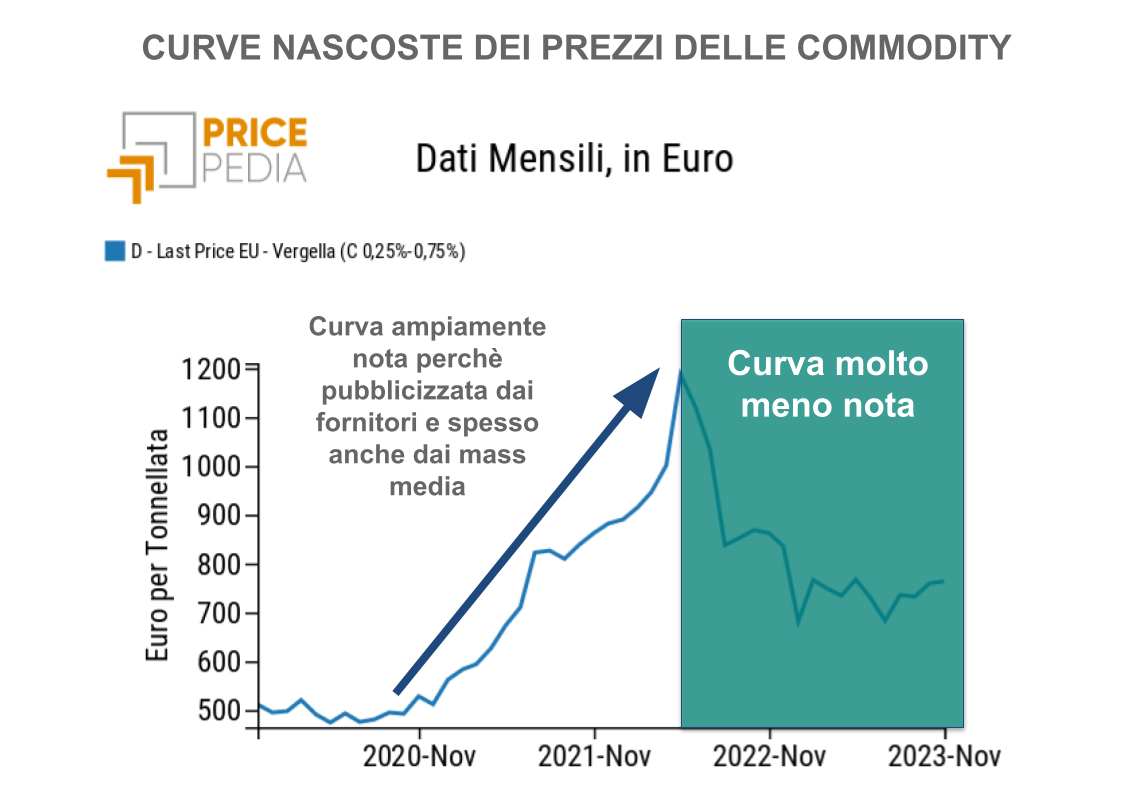
Hidden curves: new cases of analysis
Published by Luigi Bidoia. .
Fertilizers basic thermoplastics Wirerod Organic acids Hidden curvesThe sharp drops in prices affected multiple commodities [ Read all ]