Global growth at different speeds adds uncertainty to commodity markets
Eurozone growth slows and the US economy expands, while the Chinese economy suffers from the housing crisis
Published by Luca Sazzini. .
Conjunctural Indicators Commodities Financial WeekPMI Flash June 2024
This week, new data regarding the flash estimates of the PMI indices for the United States and Europe have been released.
The United States recorded an increase in the composite index from 54.5 to 54.6 in June 2024. The growth in the composite index is due to improvements in both the manufacturing and services sectors.
The manufacturing sector's PMI rose from 51.3 to 51.7, while the services sector's PMI increased to 55.1 from the previous 54.8.
Europe experienced a slowdown in economic growth, with a reduction in the composite PMI index reaching 50.8 points in June, down from 52.2 in May. The decline in the PMI index is due to the contraction in the manufacturing sector and the slowdown in the services sector.
The PMI for the manufacturing sector dropped from 47.3 to 45.6, while the PMI for the services sector decreased from 53.2 to 52.6.
The data published for the United States indicate an improvement in economic growth in both the manufacturing and services sectors, while the PMI indices for the eurozone show a slowdown in European economic recovery.
In particular, the manufacturing sector remains the most critical sector within the European industry, as it signals a PMI index value significantly below the key value of 50 points, which separates economic growth from contraction.
China Economic Conditions May 2024
The data published by the National Bureau of Statistics (NBS) highlighted contrasting dynamics within various sectors of the Chinese economy.
Chinese industrial production grew by 5.6% y/y, below analysts' expectations of 6.2% y/y and slowing down compared to the April figure of 6.7% y/y.
Nominal fixed investments slowed due to the deceleration in investments by both state-owned enterprises and private investors. Real estate investments recorded a contraction (-11% y/y), while those in the manufacturing sector showed a robust growth (9.4% y/y).
The consumer confidence figure for April 2024 (delayed by one month compared to other data) declined again after the improvement seen in the past three months.
More positive news emerges from the analysis of the services sector production and retail sales.
The services sector reported an improvement from 3.5% y/y in April to 4.8% y/y in May.
Retail sales experienced higher-than-expected growth by analysts, increasing from 2.3% y/y in April to 3.7% y/y in May.
Overall, key Chinese economic indicators suggest that Beijing's announced measures to support the real estate sector have not significantly boosted consumer and business confidence, leading to weaker-than-expected economic growth and a lower increase in commodity demand.
Commodity Financial Markets
In the financial commodity markets, the upward trend in energy prices continued from last week.
The price that experienced the most significant weekly increase was that of oil, with quotations surpassing $85/barrel again, driven by rising tensions in the Middle East and declining stocks in the United States.
Natural gas also saw an increase in the early days of the week due to an unplanned shutdown of the Nyhamna plant in Norway, but subsequently, prices fell, nullifying the previous gains.
Prices for ferrous metals remained relatively stable, while those for non-ferrous metals continued their downward trend.
In the food products market, price declines were recorded in cereals and tropical products, with food oils showing lateral fluctuations.
ENERGY
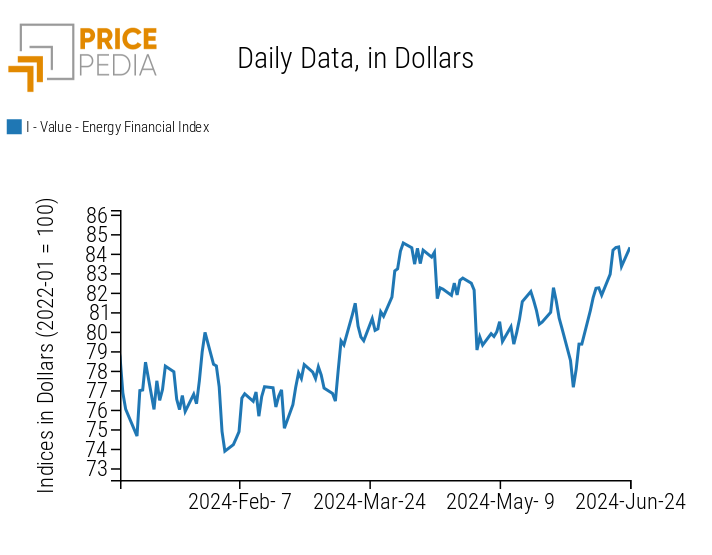
The PricePedia financial index for energy products continues its upward trend, following the rising prices of oil.
PricePedia Financial Index of Energy Prices in Dollars
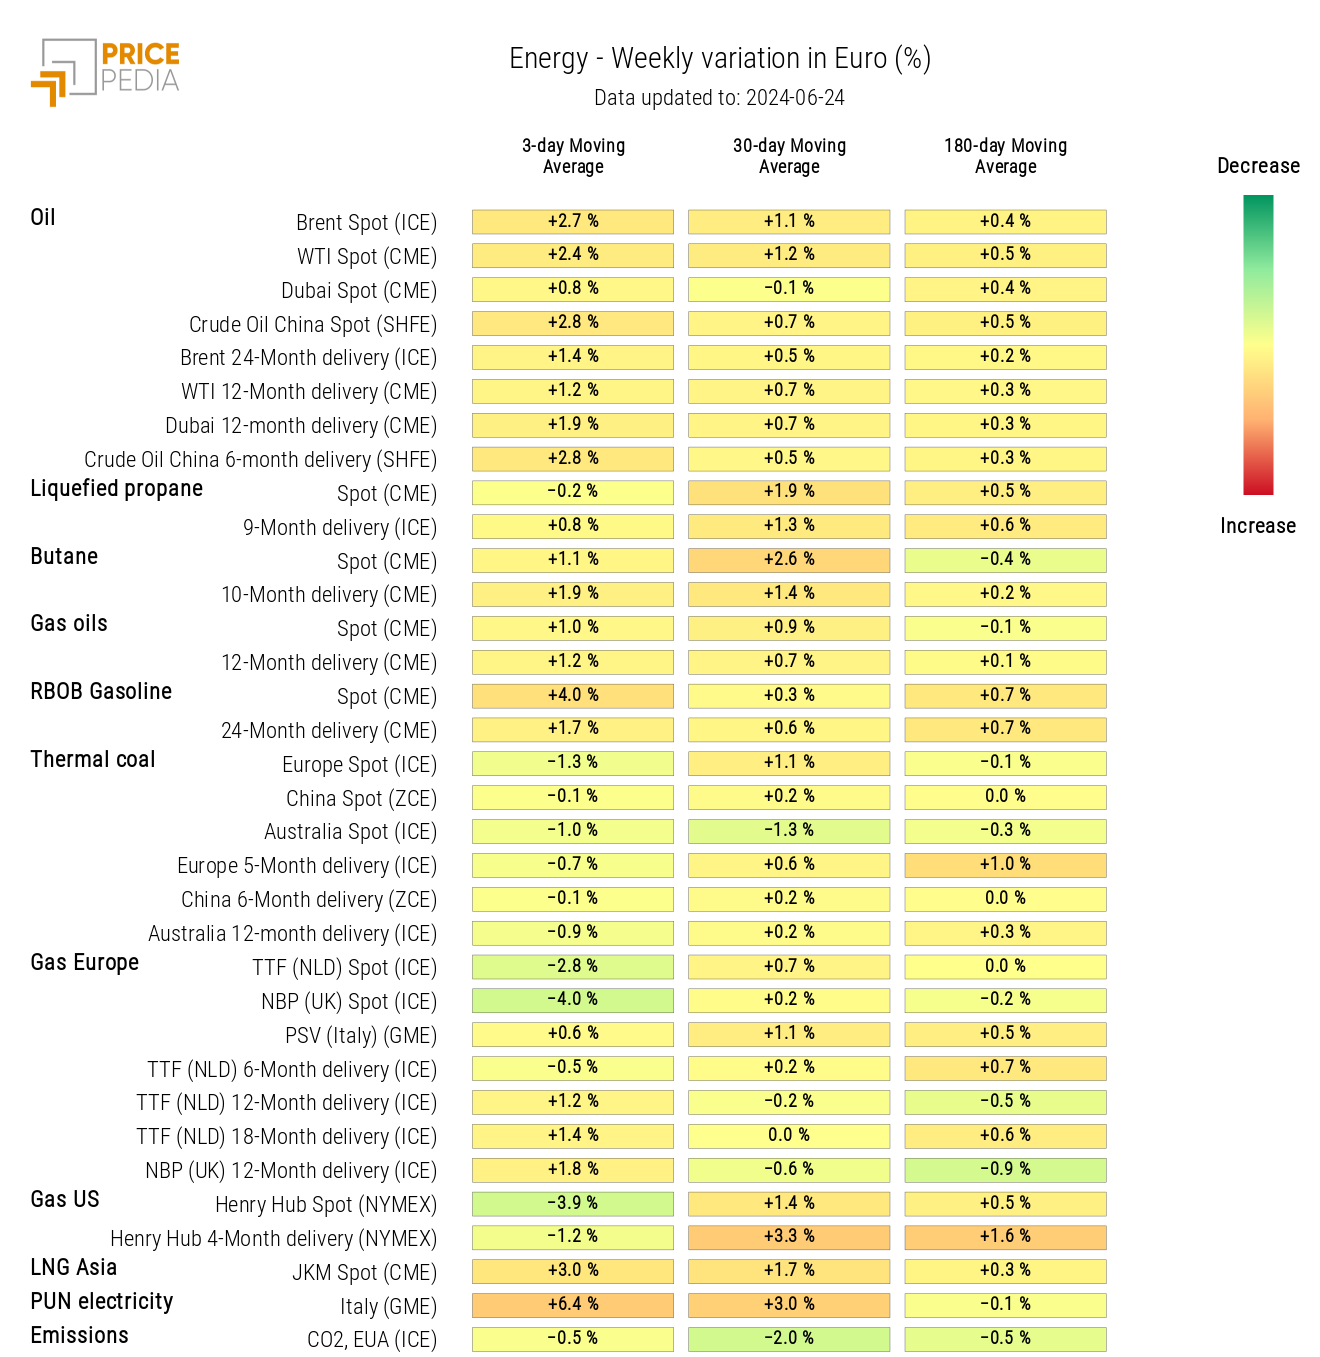
The heatmap highlights a weekly increase in the 3-day moving average for oil prices and the cost of Italian electricity (PUN). This significant growth in the weekly growth rate of the 3-day moving average of electricity prices is largely due to their strong intra-week volatility, with much lower levels on weekends compared to weekdays.
HeatMap of Energy Prices in Euros
PLASTICS
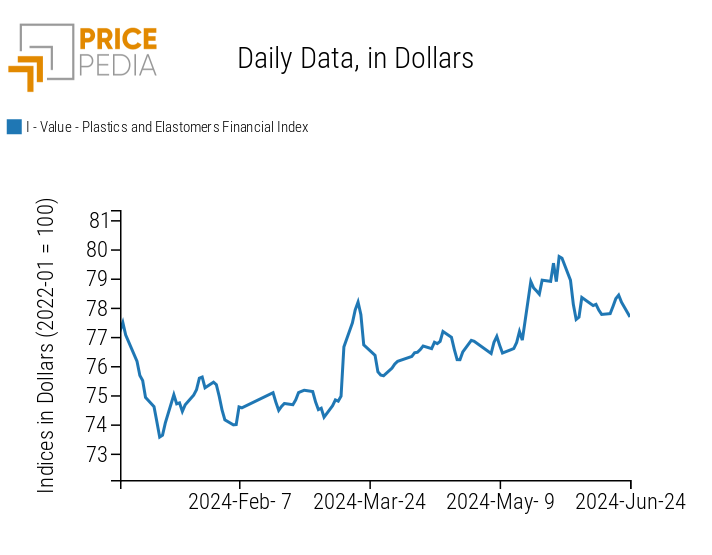
The financial index for plastics quoted in China shows a weak positive oscillation, followed by a negative one.
PricePedia Financial Indices of Plastic Prices in Dollars
FERROUS METALS
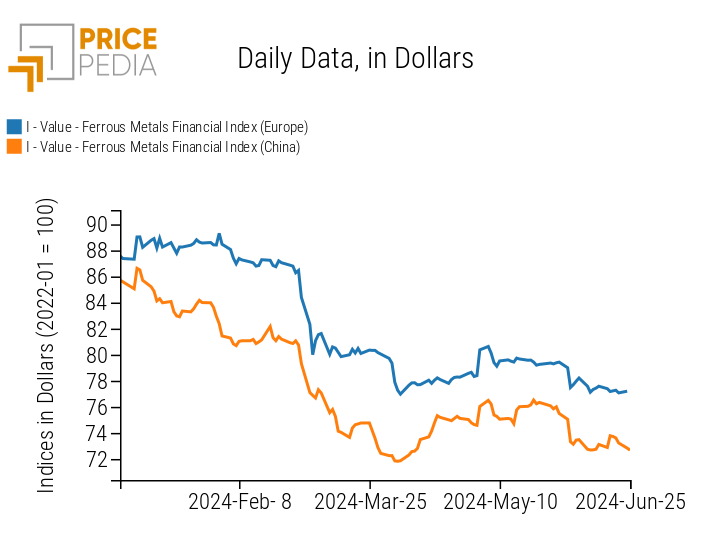
The financial indices for ferrous metals remain relatively stable, with some more pronounced fluctuations in the financial index for Chinese prices.
PricePedia Financial Indices of Ferrous Metal Prices in Dollars
Do you want to stay up-to-date on commodity market trends?
Sign up for PricePedia newsletter: it's free!
NON-FERROUS INDUSTRIAL METALS
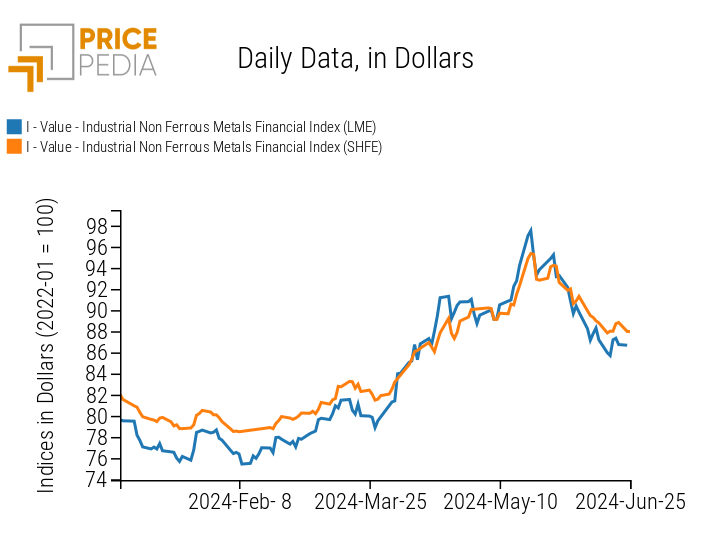
The two financial indices for non-ferrous metals continue their price reduction trend.
PricePedia Financial Indices of Non-Ferrous Industrial Metal Prices in Dollars
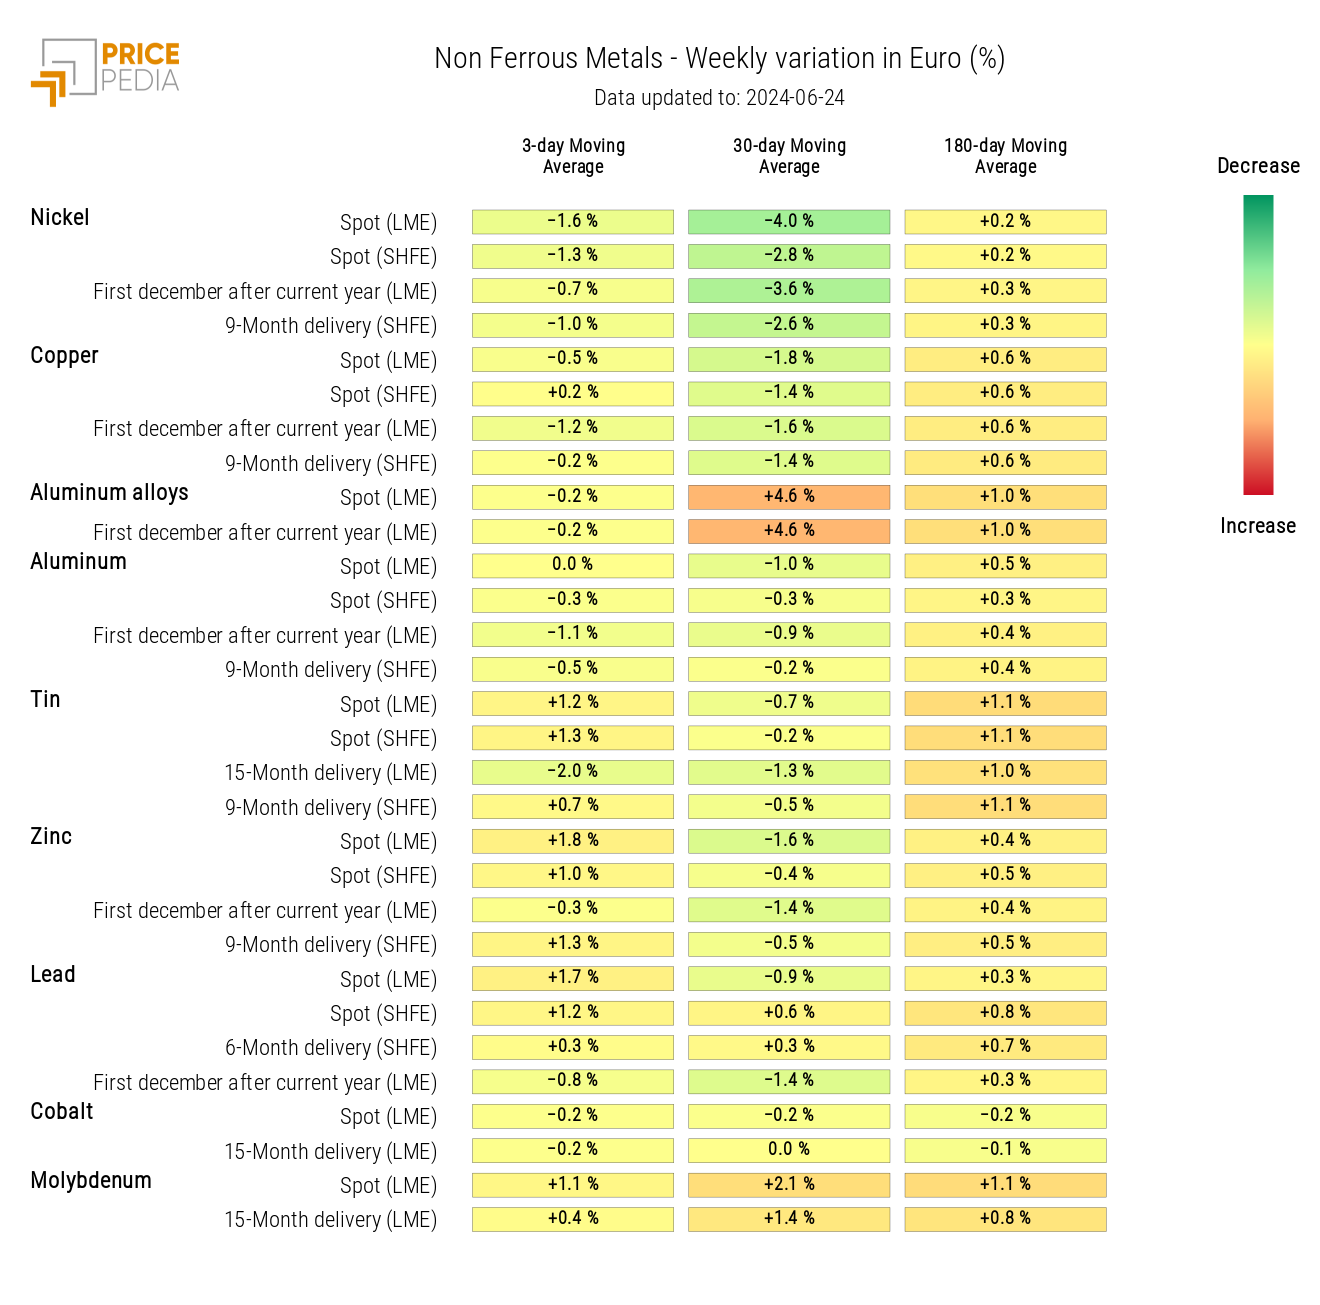
The non-ferrous metals heatmap indicates a slight increase in the prices of molybdenum and lead, against a weak decline in the prices of nickel.
HeatMap of Non-Ferrous Industrial Metal Prices in Euros
FOOD PRODUCTS
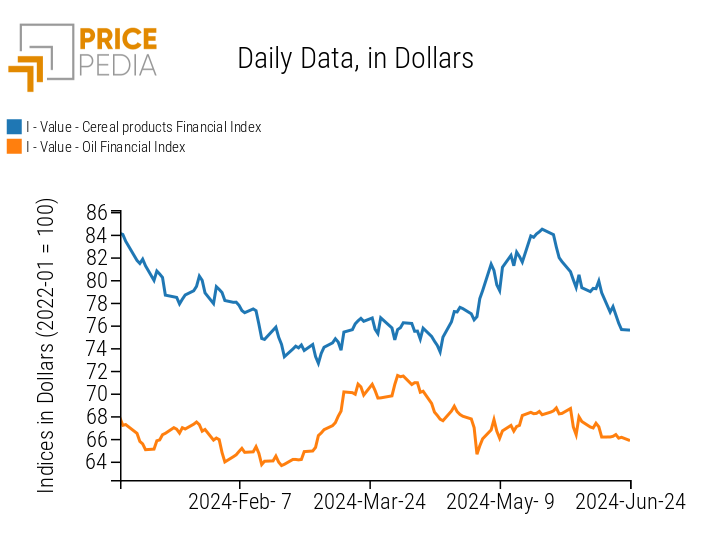
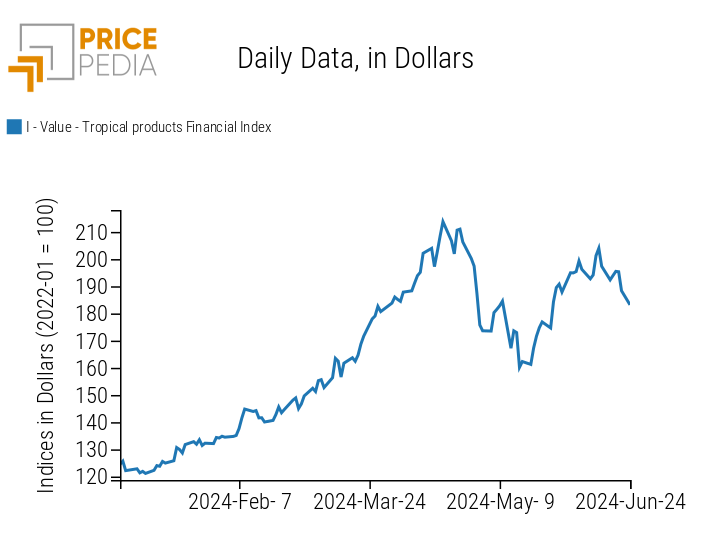
An analysis of financial indices for food products shows a reduction in the prices of cereals and tropical products.
The prices of food oils remain relatively stable, showing mostly lateral fluctuations.
| PricePedia Financial Indices of Food Prices in Dollars | |
| Cereals and Oils | Tropical Products |
|
|
CEREALS
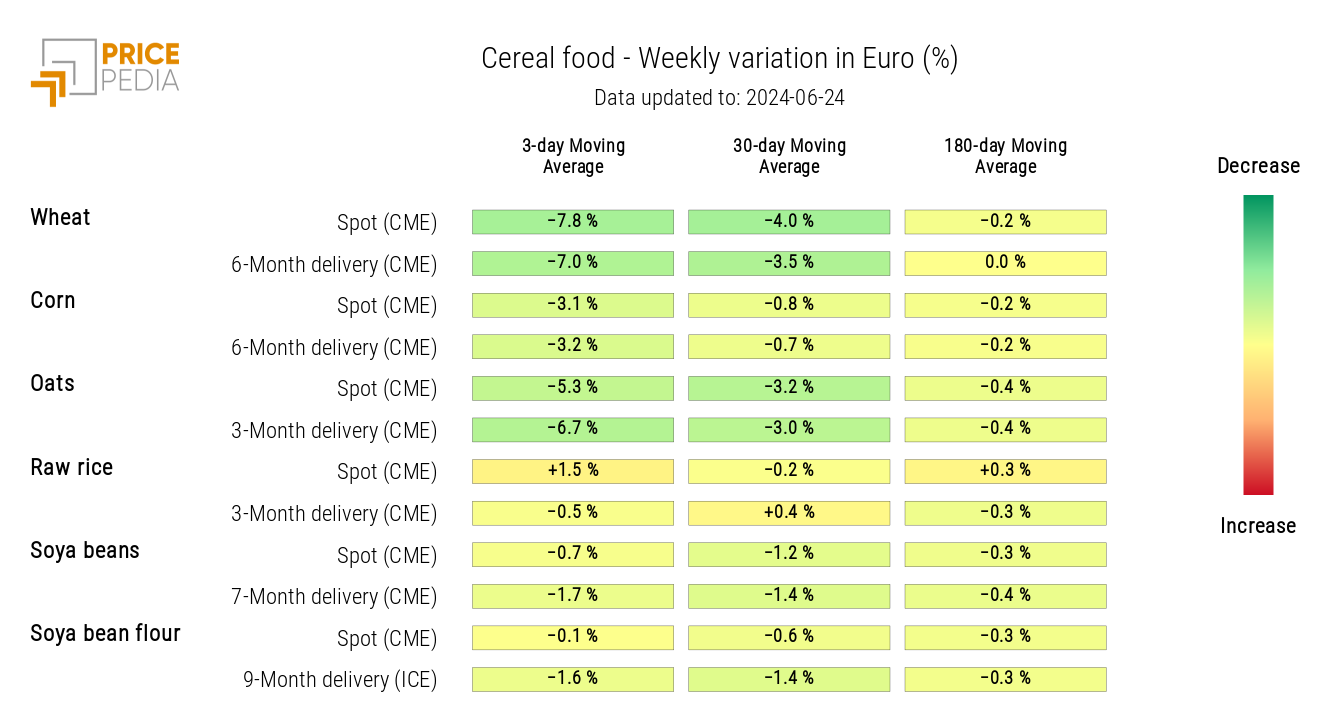
The cereals heatmap highlights the recent decline in wheat and oat prices.
Corn prices show a negative weekly variation (though weak), despite adverse weather conditions compromising the harvest.
HeatMap of Cereal Prices in Euros
TROPICAL PRODUCTS
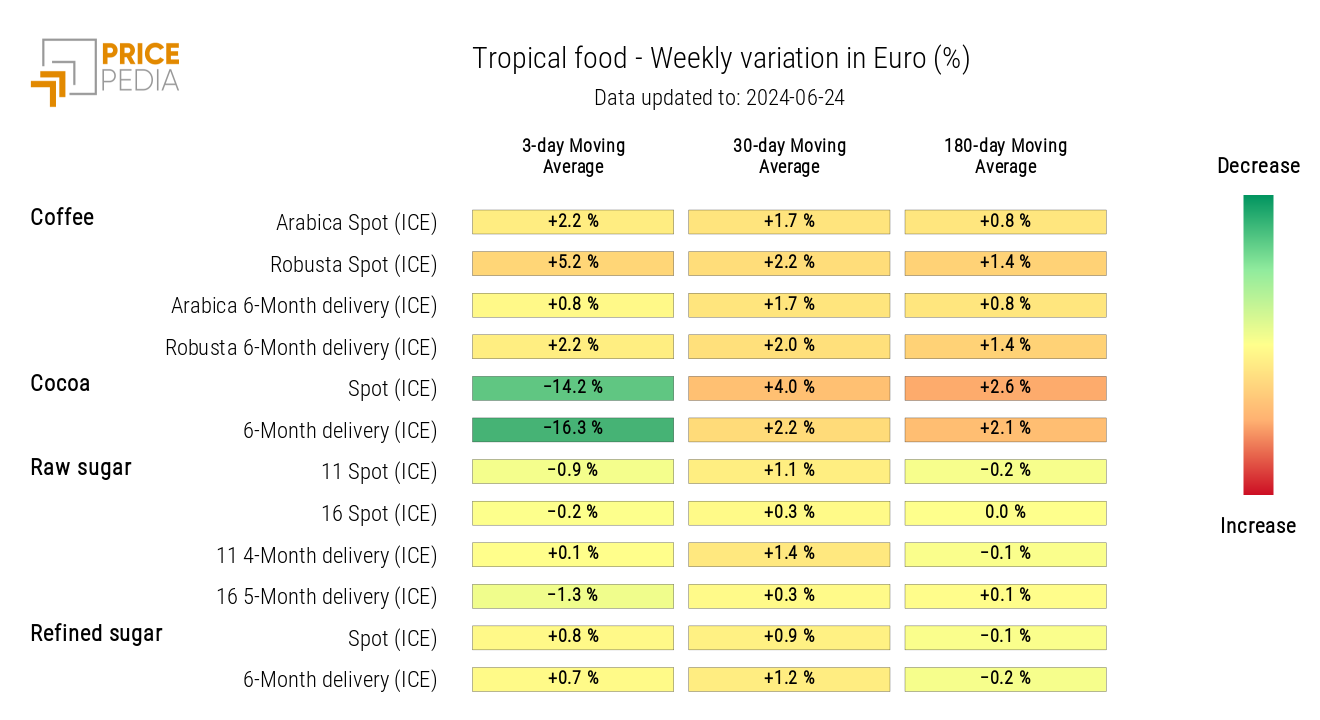
The analysis of the tropical food products heatmap reveals divergent price dynamics.
The variation in the 3-day moving average indicates a sharp decline in cocoa prices, which contrasts with the recent rise in coffee prices.
HeatMap of Tropical Food Prices in Euros
