Reduction in agricultural commodity prices intensifies
Encouraging data on slowing US inflation increases the likelihood of a first rate cut in September
Published by Luca Sazzini. .
Conjunctural Indicators Commodities Financial WeekUS Inflation Growth Slows Down
This week, new data on the Personal Consumption Expenditures (PCE) index, the Federal Reserve's preferred measure for monitoring inflation data, were released. The main advantages of this index are the inclusion of a broader range of expenses compared to those in the Consumer Price Index (CPI) and the use of variable weights that can account for changes in consumer preferences.
The data for May 2024 indicate a year-on-year reduction for both the PCE index and the core index, which excludes the more volatile components (energy and food).
Both indices stood at 2.6% in May, compared to the previous data of 2.7% and 2.8% recorded in April by the PCE and core PCE, respectively.
Monthly variations also provide encouraging signs, with the PCE remaining unchanged and the core PCE showing a modest increase of 0.1% m/m.
Overall, the data on the two PCE indices both indicated a slowdown in US inflation, which is consistent with the possibility of a first rate cut by the Federal Reserve at the September 2024 meeting.
Decline in European Business Sentiment
The European Commission's Economic Sentiment Indicator (ESI) fell slightly to 95.9, from the previous 96.1, indicating a more pessimistic outlook among European businesses.
The sectors that saw deterioration in June include industry, services, retail trade, and construction.
The employment index also declined, while price expectations in services and anticipated consumer inflation increased.
Currently, analysts do not expect a reversal of the ongoing disinflation trend; however, concerns remain about more persistent core inflation during the summer months.
Growth forecasts for the eurozone's GDP in the second and third quarters remain between 0.2% and 0.3% q/q.
Commodity Markets Performance
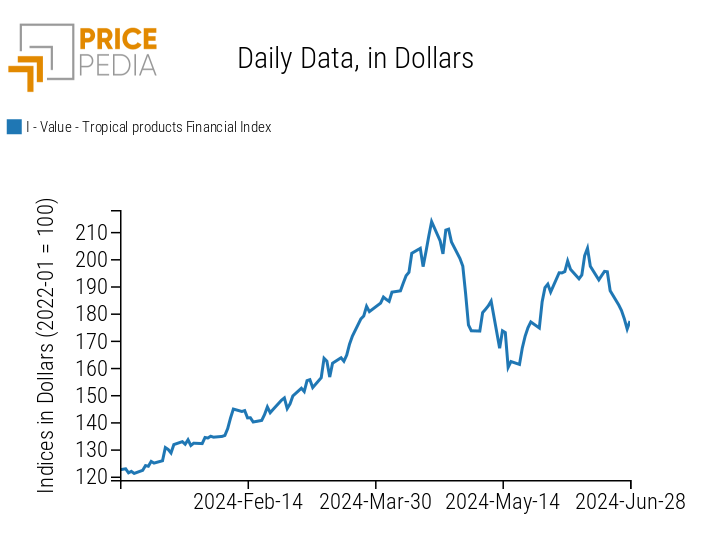
This week, financial prices of commodities maintain a downward trend, except for energy prices which remain mostly stable. The strongest declines were recorded in the food sector, with price reductions for both cereals and tropicals, primarily driven by a collapse in cocoa prices.
The energy market eases the upward trend of recent weeks, with mostly lateral price movements, while industrial metal markets have not deviated from their recent dynamics.
The ferrous metals market shows a slight price reduction, more pronounced in China, while the non-ferrous market remains characterized by a clear downward trend, although there were some weak positive fluctuations in recent days.
ENERGY
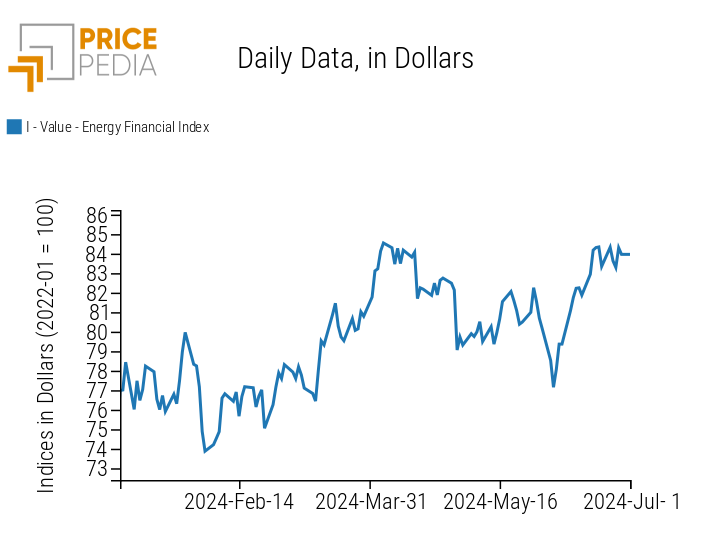
The PricePedia financial index of energy products halted the growth of recent weeks, experiencing some minor fluctuations that did not significantly alter the price level.
PricePedia Financial Index of Energy Prices in Dollars
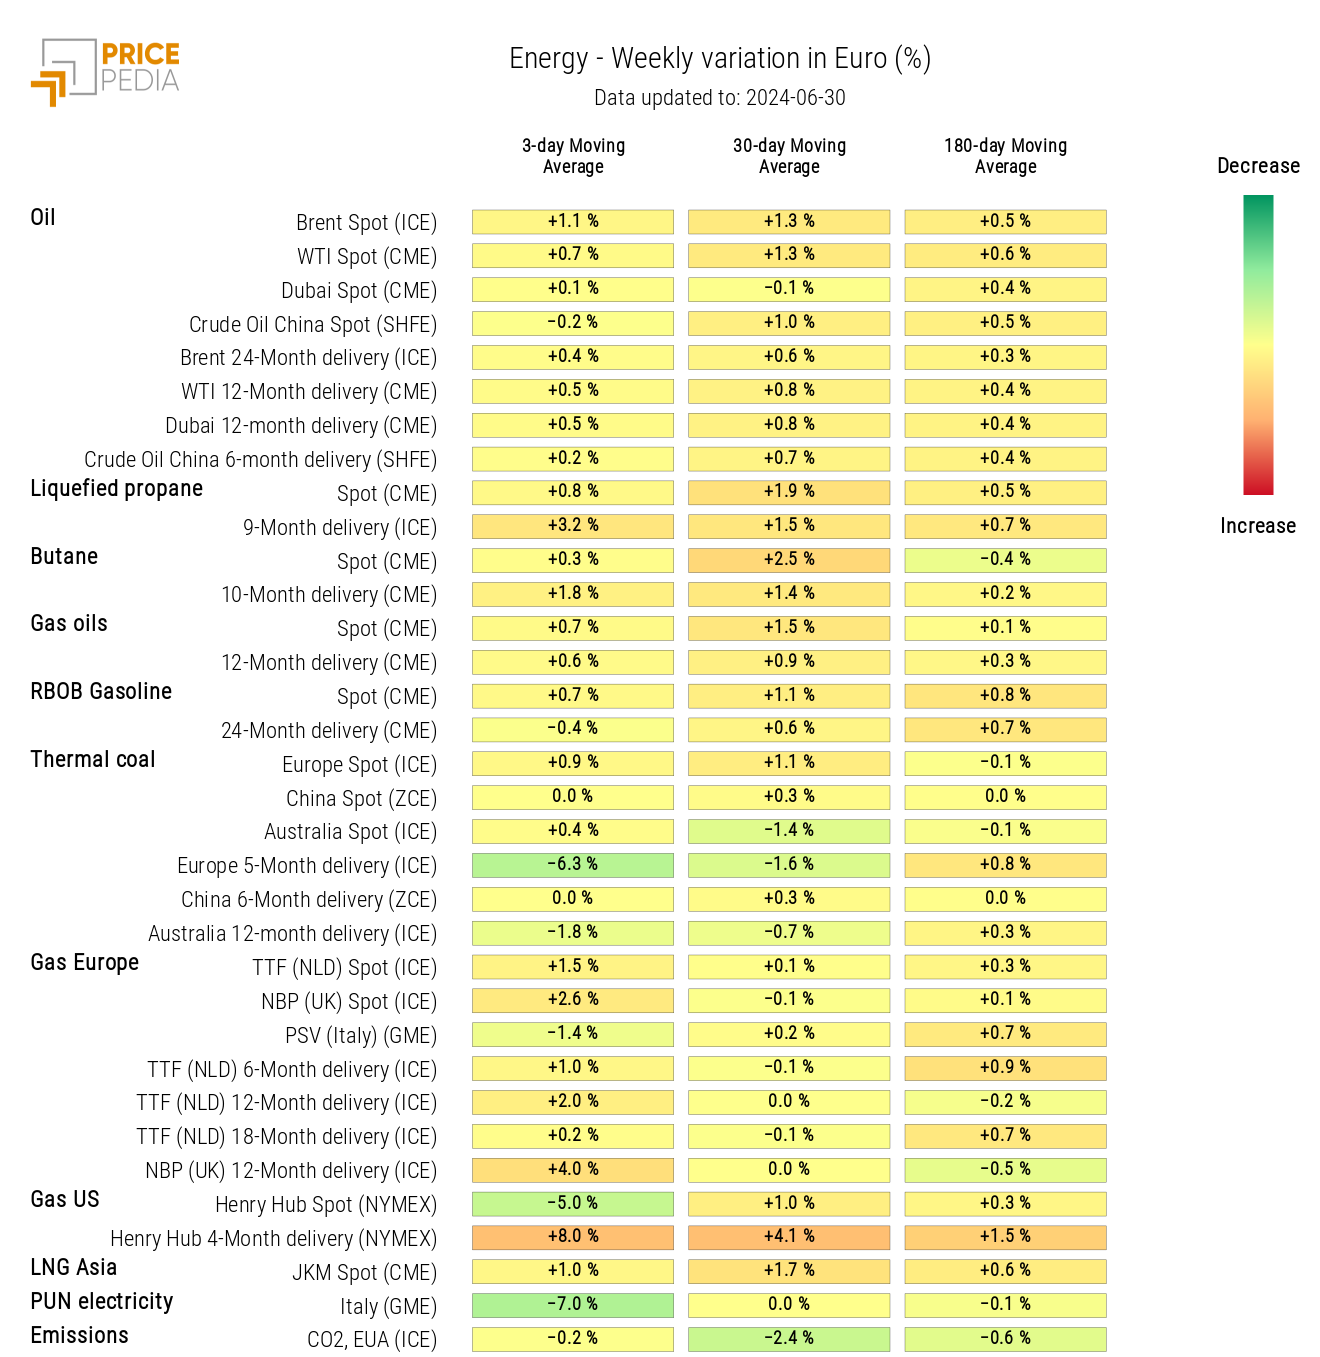
The energy heatmap shows a slight increase in oil and LNG Asia prices, against a reduction in the PUN (Single National Price).
There is also a divergent trend between the spot price of Henry Hub (US gas) and the related continuous future with a 4-month expiration, which saw an increase opposing the reduction in the spot contract price.
HeatMap of Energy Prices in Euros
PLASTICS
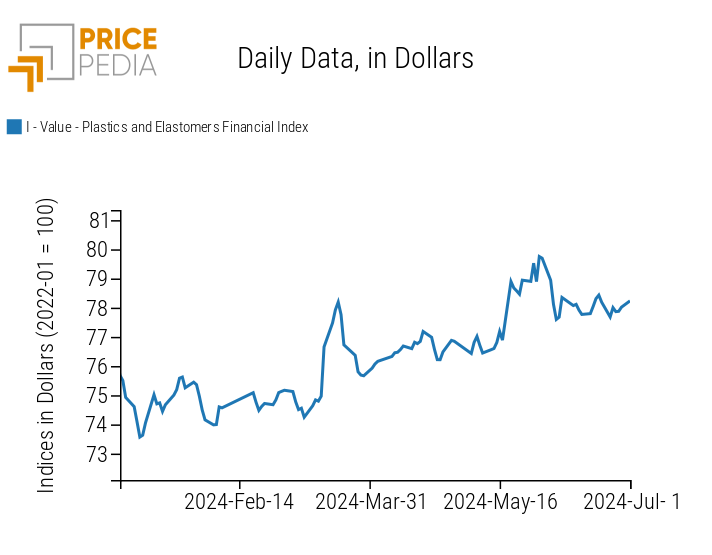
The financial index of plastics quoted in China remains relatively stable, experiencing mostly lateral price variations.
PricePedia Financial Indices of Plastics Prices in Dollars
FERROUS METALS
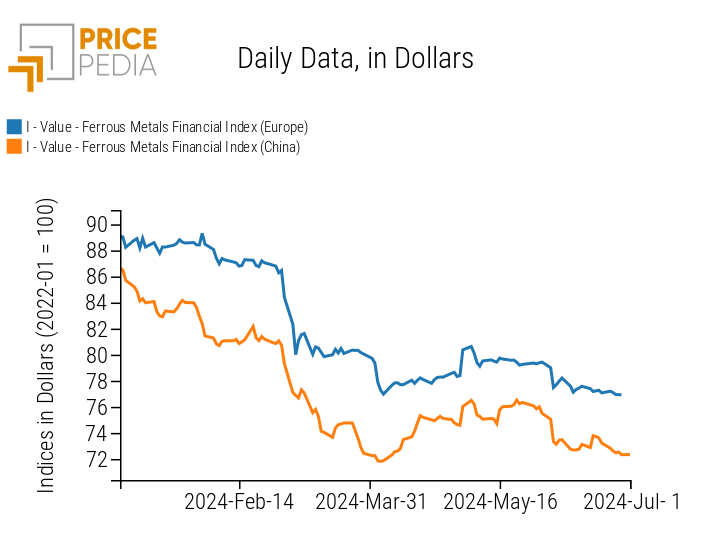
The Chinese financial index of ferrous metals follows a slight price reduction due to the decline in the price of steel rebar quoted on the Shanghai Futures Exchange, while the European index maintains relatively stable price levels.
PricePedia Financial Indices of Ferrous Metals Prices in Dollars
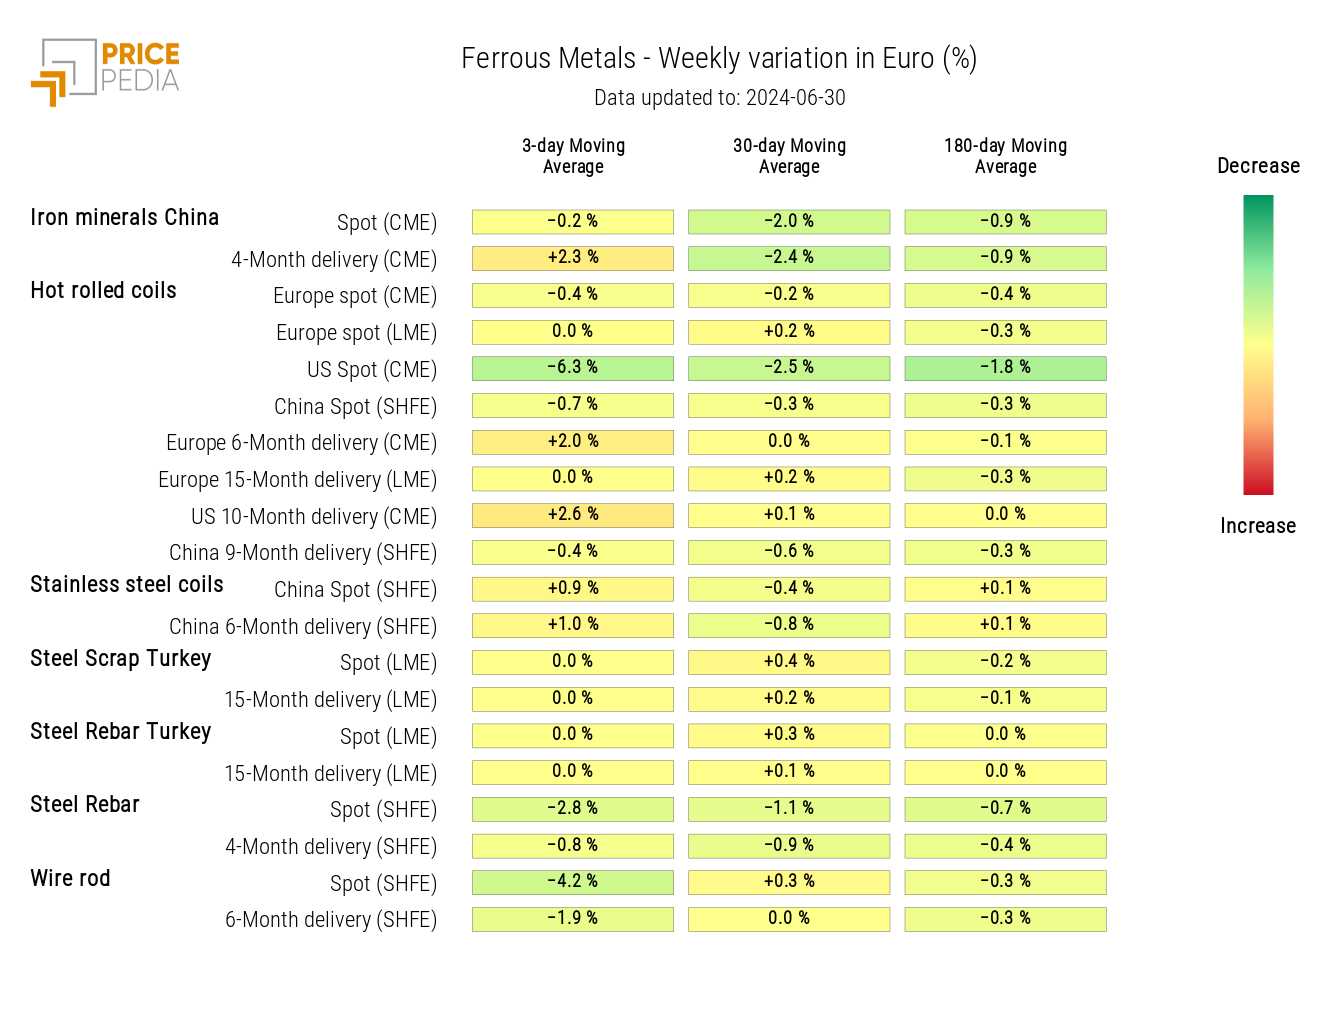
The heatmap of ferrous prices is characterized by a prevalence of negative signs in materials quoted on the Shanghai Futures Exchange (SHFE), with a maximum of -3% in the weekly change of the three-month moving average of steel rebar prices.
HeatMap of Ferrous Prices in Euros
Do you want to stay up-to-date on commodity market trends?
Sign up for PricePedia newsletter: it's free!
INDUSTRIAL NON-FERROUS METALS
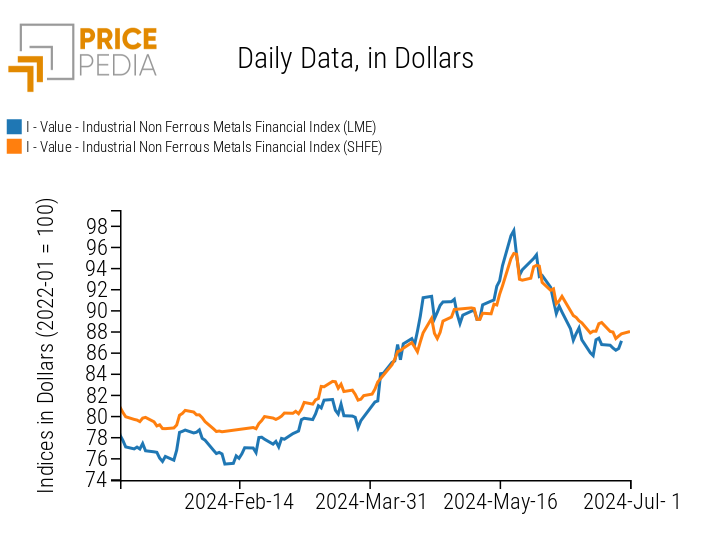
The financial indices of non-ferrous metals quoted on the London Metal Exchange (LME) and Shanghai Futures Exchange (SHFE) remain characterized by a negative trend, although they registered a slight positive fluctuation in recent days.
PricePedia Financial Indices of Industrial Non-Ferrous Metals Prices in Dollars
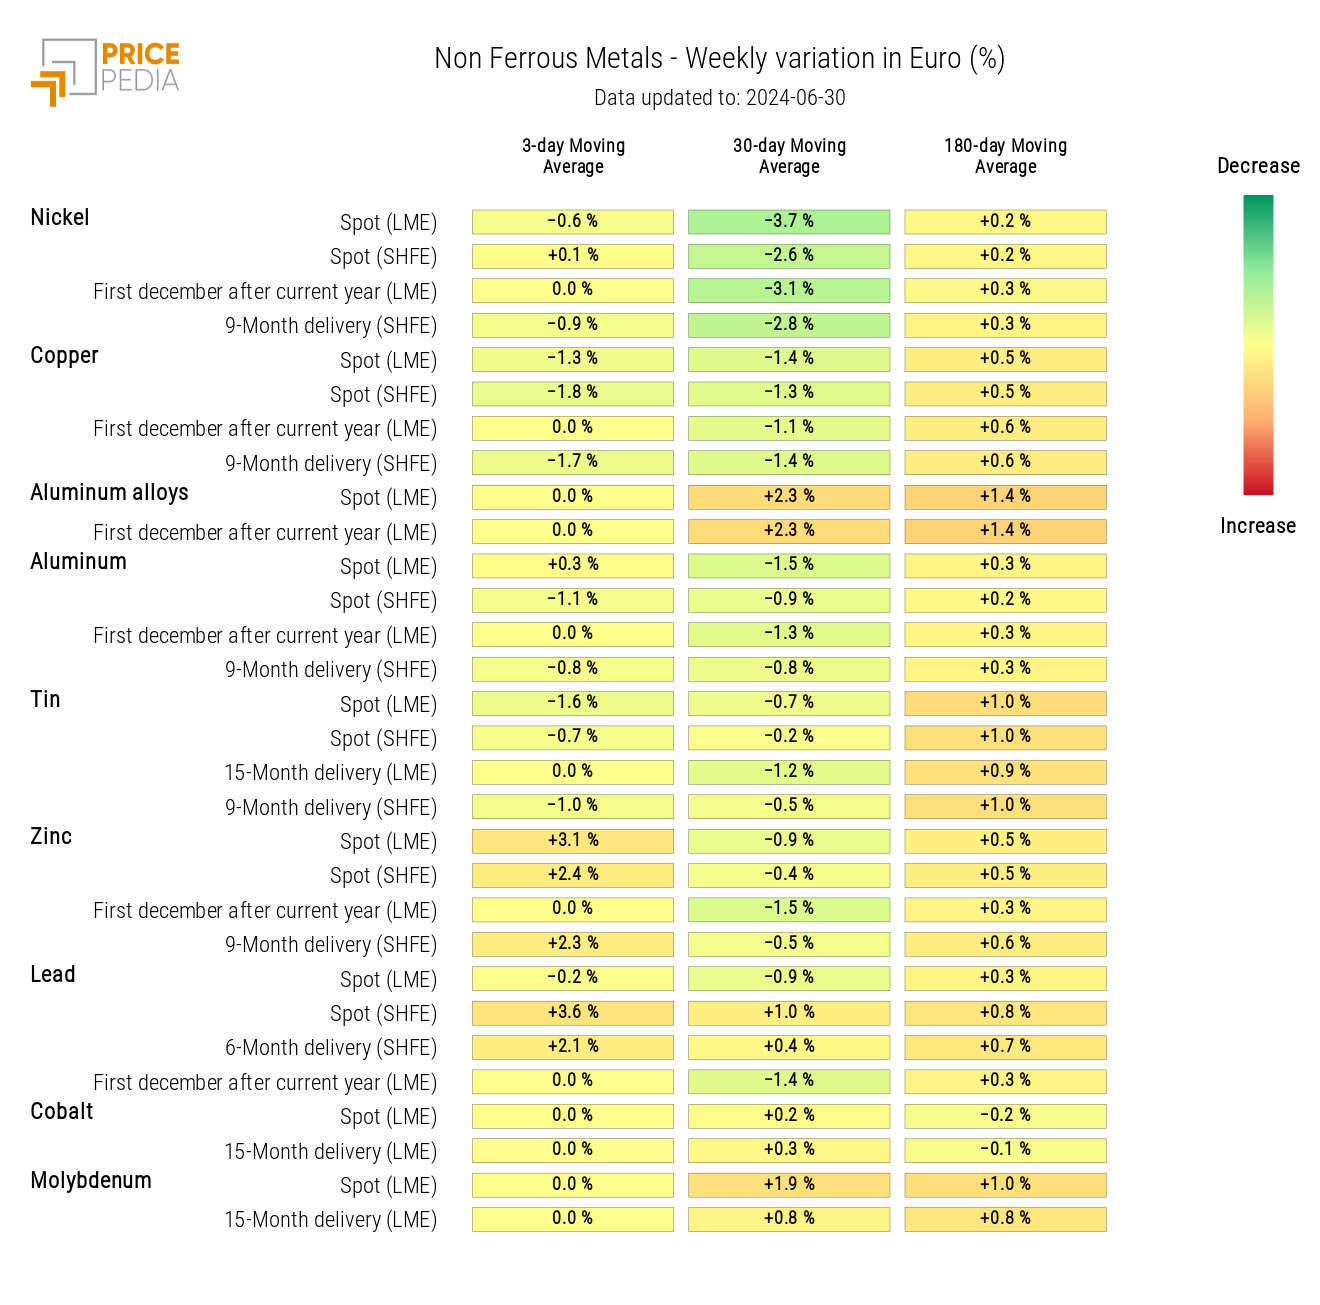
The non-ferrous heatmap shows very limited weekly changes in the three-month moving average prices monitored. On one hand, copper shows the most significant negative change; on the other, zinc the positive one.
HeatMap of Non-Ferrous Prices in Euros
FOOD
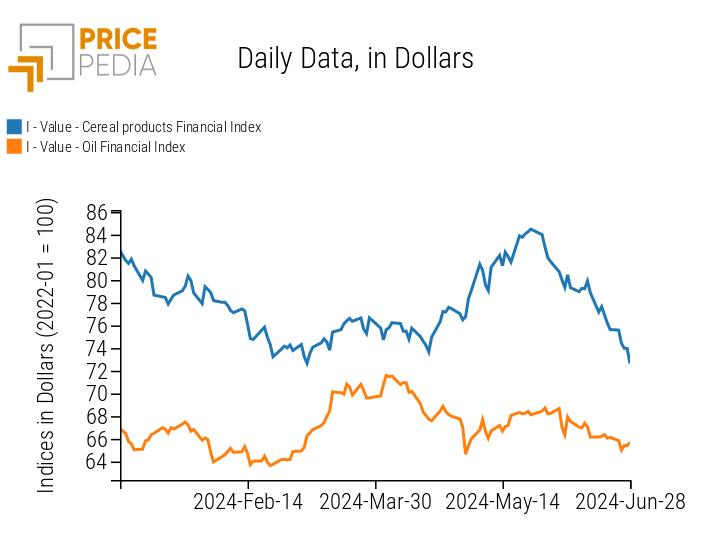
The financial indices of food products follow downward trends of varying intensity.
The price declines for cereals and tropicals are much more intense compared to those of edible oils, which show much more stable prices.
| PricePedia Financial Indices of Food Prices in Dollars | |
| Cereals and Oils | Tropicals |
|
|
CEREALS
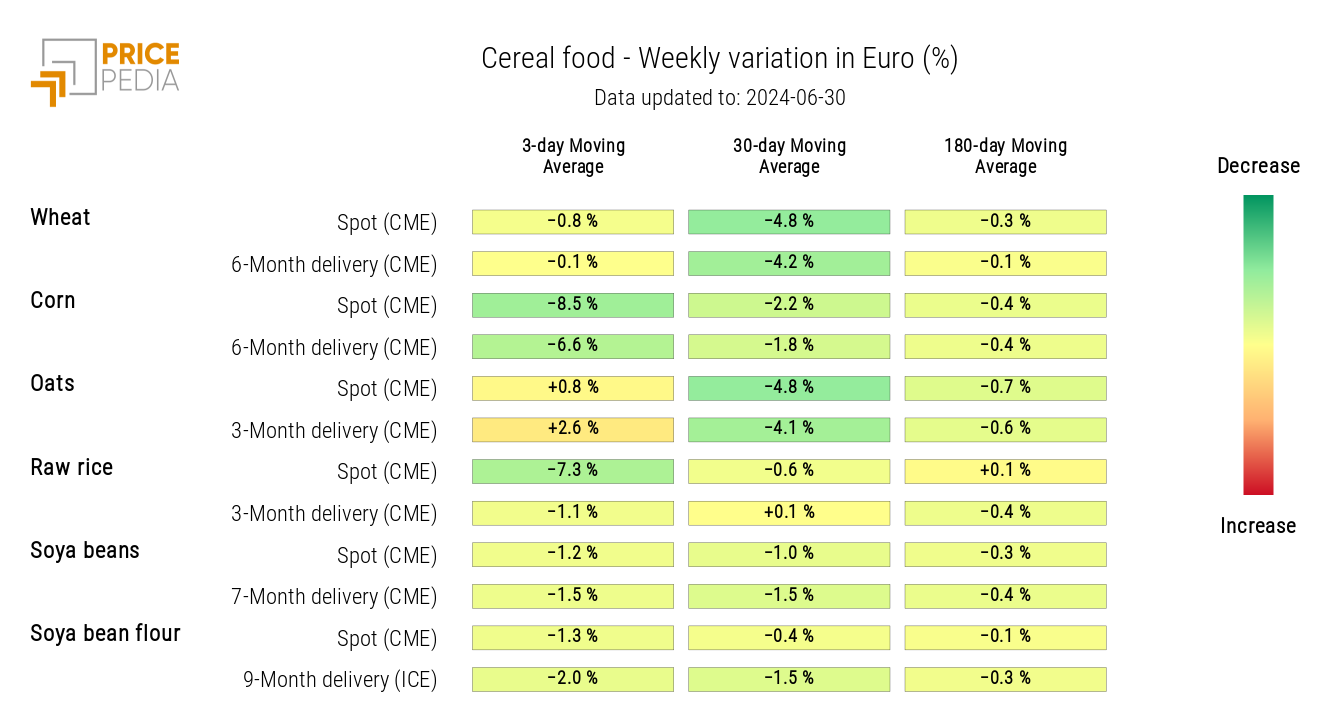
The heatmap shows a general decline in cereal prices, particularly pronounced for corn and rough rice.
HeatMap of Cereal Prices in Euros
TROPICALS
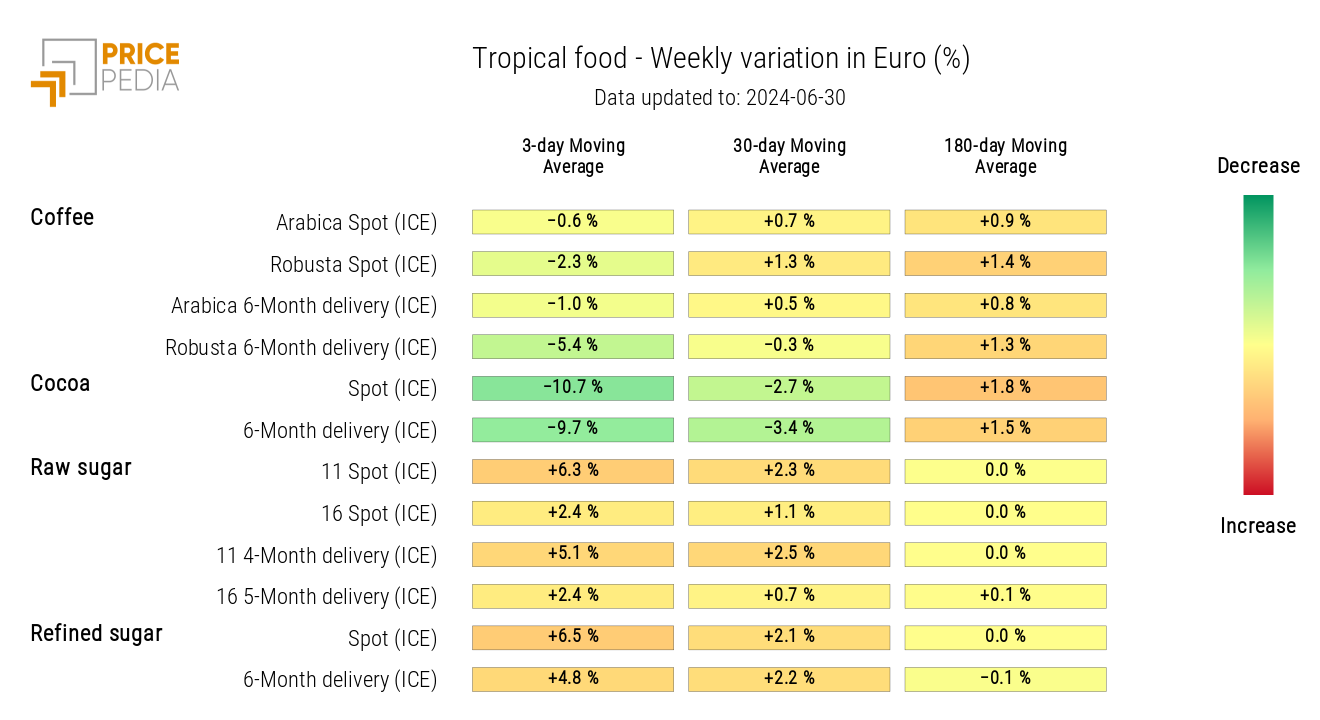
The analysis of the tropical food heatmap highlights the collapse in cocoa prices, against a more moderate increase in sugar prices.
Forecasts for the next cocoa harvest are particularly positive for both Ghana and Cameroon. In addition to the arrival of more favorable weather, supplies of pesticides and fertilizers are expected to contribute to improving the next season's harvest.
HeatMap of Tropical Food Prices in Euros
