Divergences in commodity prices increase
PricePedia's Monthly Update for June 2024
Published by Pasquale Marzano. .
Last Price Global Economic TrendsThe PricePedia monthly commodity price update for June 2024 has been published. The table below provides descriptive statistics, referring to the last 12 months, of the main aggregates of commodity prices: Industrials[1], Energy, Food, and Precious Metals.
| Effective period | Average | Minimum | Maximum | Standard deviation | Variation of the period | |
|---|---|---|---|---|---|---|
| I - Last Price EU - Food Total Index (Europe) | 2023-07 - 2024-06 | 107 | 104 (2023-07) | 111 (2024-06) | 2.17 | +6.72% |
| I - Last Price EU - Precious Metals Total Index (Europe) | 2023-07 - 2024-06 | 94.1 | 86.1 (2023-07) | 111 (2024-06) | 8.54 | +28.62% |
| I - Last Price EU - Energy Total Index (Europe) | 2023-07 - 2024-06 | 98.6 | 92.4 (2023-12) | 111 (2023-09) | 5.60 | -2.63% |
| I - Last Price EU - Industrials Index (Europe) | 2023-07 - 2024-06 | 89.7 | 88.3 (2023-12) | 91.0 (2024-05) | 0.8431 | +0.02% |
Since July 2023, the prices that have increased the most are those of Food (+6.7%) and, especially, Precious metals (+28.6%). The former were supported by climatic events affecting many productions (such as cocoa, olive oil, etc.); the latter, by ongoing geopolitical crises that have led many investors to prefer their purchase as safe-haven assets.
Regarding the PricePedia index of energy commodities, since July 2023, there has been an overall slight reduction, close to -3%. This average variation results from a much more erratic and differentiated path among the price dynamics of individual commodities. Over the past year, in addition to the reduction in oil prices similar to that of the aggregate index, there have been significant decreases in the price of natural gas (-5.8%) and especially of liquefied natural gas and coal, both at -18%.
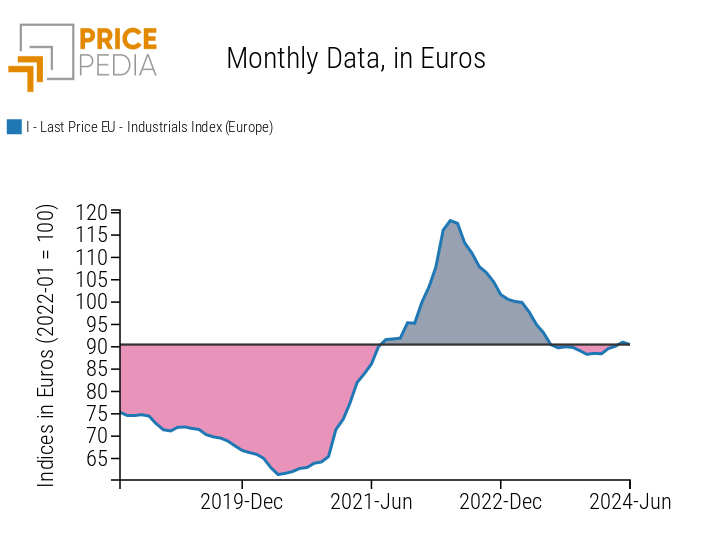
A flat dynamic, on the other hand, characterizes the PricePedia index of industrial commodity prices. In June 2024, it stands at the same values as in July 2023. Over the last twelve months, the range of recorded monthly variations has also been contained, between -3% and +1.5%, compared to greater fluctuations historically recorded.
The following graphs show how the volatility of the index has changed over the past 12 months compared to the previous six years.
Comparison of Industrial Index Dynamics
Last 6 years
Last 12 months
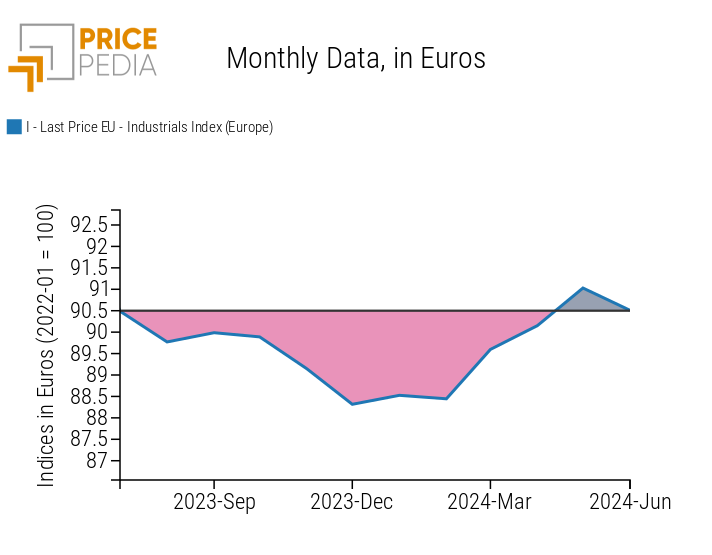
Industrial Commodities
While in aggregate, commodity prices have moved sideways, at the level of individual product families, there is greater dynamism.
The graph below shows the percentage change in June 2024 compared to July 2023 of the main price indices, in euros, for each product family.
June 2024, variations (%) in euro with respect to July 2023
Source: PricePedia
Paper
In June 2024, the Paper index is the only one that shows levels higher than those of January 2022. In the last month, growth was +1.4%, leading to an overall increase over the past twelve months of +9.7%.
Among paper products, from July 2023 to June 2024, the prices of coniferous chemical wood pulp and hardwood chemical pulp grew by +26% and +42%, respectively.
Recycling paper also experienced significant growth: in the same period, its prices increased by around +25%.
Textile Fibers
Contrary to the upward trend in paper prices, textile fiber prices decreased. In June 2024, they recorded an overall reduction of -8.5% compared to July 2023. The most significant decline was in the prices of cotton and wool, which fell by over -13% since last summer. However, synthetic fibers held steady, decreasing by only -2% over the same period.
Industrial Metals
Industrial metals showed divergent dynamics between non-ferrous and ferrous metals. In June 2024, the former increased by +3.9% compared to July 2023, driven by financial operators' attempts to anticipate future demand increases for non-ferrous metals for energy transition; during the same period, the latter showed a -4% decline, due to weak demand in China because of the construction sector crisis.
Chemical Products
Similarly divergent are the price dynamics of chemical commodity families. While organic chemicals showed a weak increase of +2.6%, there was a significant decline in the prices of inorganic chemicals since July 2023. The reasons lie in the stickiness[2] of the prices of different commodities. Organic prices, being less sticky, had collapsed between summer 2022 and summer 2023 by -28%, while inorganic prices fell "only" by -14%. The low global demand conditions in the second half of 2023 and the first half of 2024 led to a progressive erosion of the prices of inorganic chemical commodities that had remained relatively high.
Do you want to stay up-to-date on commodity market trends?
Sign up for PricePedia newsletter: it's free!
1. The PricePedia Industrials index is the aggregation of indices related to the following categories: Ferrous Metals, Non-Ferrous Metals, Wood and Paper, Chemicals: Specialty, Organic Chemicals, Inorganic Chemicals, Plastics and Elastomers, and Textile Fibers.
2. Determinants of commodity price stickiness.
Pasquale Marzano
Economist and data scientist. At PricePedia he deals with the analysis of commodity markets, forecasting models for raw material prices and management of reference databases.
You may be interested in:

Monthly commodity prices update for March 2025
Published by Pasquale Marzano. .
Last Price Global Economic TrendsPrice stability: counterbalancing forces or statistical randomness? [ Read all ]

Monthly commodity prices update for February 2025
Published by Pasquale Marzano. .
Last Price Global Economic TrendsDiverging price dynamics behind the apparent calm [ Read all ]
Monthly commodity prices update for January 2025
Published by Pasquale Marzano. .
Last Price Global Economic TrendsDifferentiated signals of commodity price recovery [ Read all ]