Commodity prices: increasingly short trend phases
Concerns for global maritime trade
Published by Luca Sazzini. .
Conjunctural Indicators Commodities Financial WeekIn the article from last week "Positive rebound in financial commodity prices", an increase in prices for all major commodity market families was highlighted. This week, the upward price trend only affected the tropical food family, due to the increase in cocoa and coffee prices. All other price families recorded weekly price reductions, especially the energy sector.
The weakening of Hurricane Beryl has, in fact, alleviated some supply concerns, bringing Brent (ICE) levels back around $85/barrel.
Currently, commodity prices continue to be characterized by price fluctuations mainly determined by short-term factors, rather than structural changes in supply and demand. Before witnessing a lasting recovery in commodity prices, a greater easing of monetary policy by the ECB and the FED will be necessary to further stimulate the recovery of global demand.
With the latest meeting, the European Central Bank has begun to initiate a phase of expansionary monetary policy by making a 25 basis point cut. However, the ECB remains very cautious about making further rate cuts and maintains an approach strongly linked to inflation data. No changes are expected from the current interest rates at the meeting on July 18 next week. The next cut will probably be made in September, provided that further confirmation of achieving the inflation rate target is obtained.
In contrast to the ECB, the Federal Reserve has not yet started easing its monetary policy and has not expressly declared when the next interest rate cut will take place. For this reason, it becomes important to analyze the inflation trend to anticipate the most likely date for the first interest rate cut.
Inflation Trend
USA
The data regarding the Consumer Price Index (CPI) of the United States signaled a reduction in inflation in the month of June, surpassing analysts' forecasts.
The CPI recorded a monthly price decrease of – 0.1% m/m, against expectations of a price increase of 0.1% m/m.
The annual price variation showed a slowdown in inflation to 3% y/y, compared to 3.3% y/y last month.
The core index, which excludes more volatile items (energy and food), recorded a monthly growth of 0.1% m/m, against the 0.2% estimated by analysts. On an annual basis, the index showed a price increase of 3.3% y/y, below the May data (3.4% y/y).
These reassuring data on US inflation strengthen expectations of a first rate cut by the FED for the month of September 2024. The news that particularly encouraged the market was the monthly drop in prices recorded by the US CPI. If further reductions in American inflation are recorded in the coming months, the FED could even make two cuts by the end of the year.
China
The Chinese Consumer Price Index indicates a slowdown in inflation to 0.2% y/y for June 2024, compared to the previous data of 0.3%. The slowdown in inflation is attributable to the current deflation in the food sector (-2.1% y/y) and the transportation and telecommunications sector (-0.3% y/y), as well as the slowdown in fuel inflation from 6.3% y/y to 5.6% y/y.
The core inflation remained unchanged on an annual basis at 0.6% y/y, but experienced a monthly reduction of -0.1% m/m.
For the coming months, consumer price changes are expected to remain positive and below 1%, at least until the end of 2024.
Increase in Shipping Costs
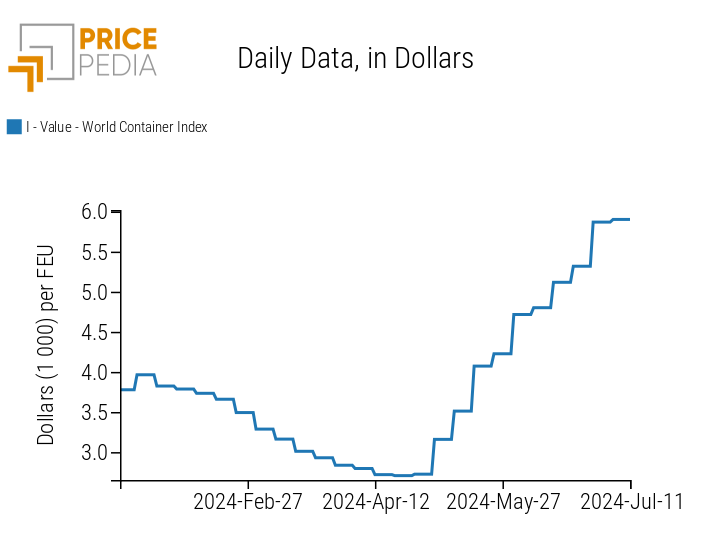
The reduction of navigation through the Red Sea and the Panama Canal has been putting pressure on global maritime trade for several months. Since the outbreak of the war in the Middle East, shipping costs have continued to rise, and to date, the World Container Index, a measure of global maritime transport costs, has shown no sign of price reduction.
Since April, in fact, prices on major trade routes departing from Shanghai that transit through the Red Sea have continued to rise and today more than double their previous levels.
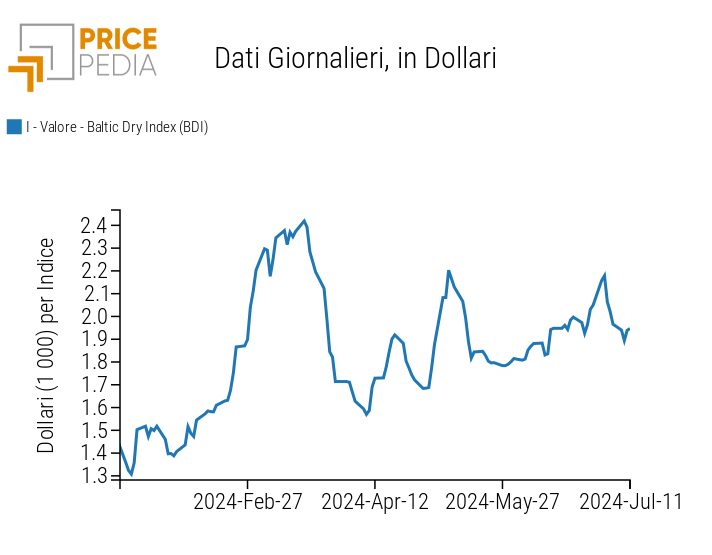
From the analysis of the Baltic Dry Index (BDI), the world's reference index for bulk carriers, numerous periods of price increases have emerged, with the latest relative maximum reached at the beginning of July. The BDI, being a volatile index, has recorded several phases characterized by negative price changes, but observing the trend net of fluctuations, a strong rise compared to early 2024 levels is evident.
Below are the graphs showing the two indices just described.
| World Container Index (WCI) | Baltic Dry Index (BDI) |
|
|
ENERGY
The PricePedia financial energy price index recorded a price reduction in the first days of the week, followed by a slight recovery in the final days.
PricePedia Financial Index of energy prices in dollars
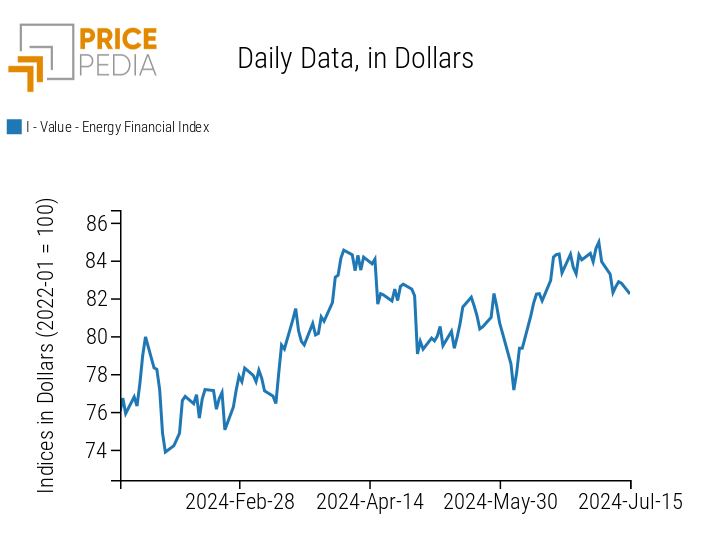
The weakening of Hurricane Beryl has alleviated supply concerns, favoring the decline in energy prices.
Fortunately, most of the energy infrastructure seems to have emerged unscathed, and some infrastructures are already resuming operations, such as the port of Corpus Christi, an important export hub for US crude oil.
Below is the heatmap of energy prices expressed in euros, showing the main reductions recorded during the week.
HeatMap of energy prices in euros
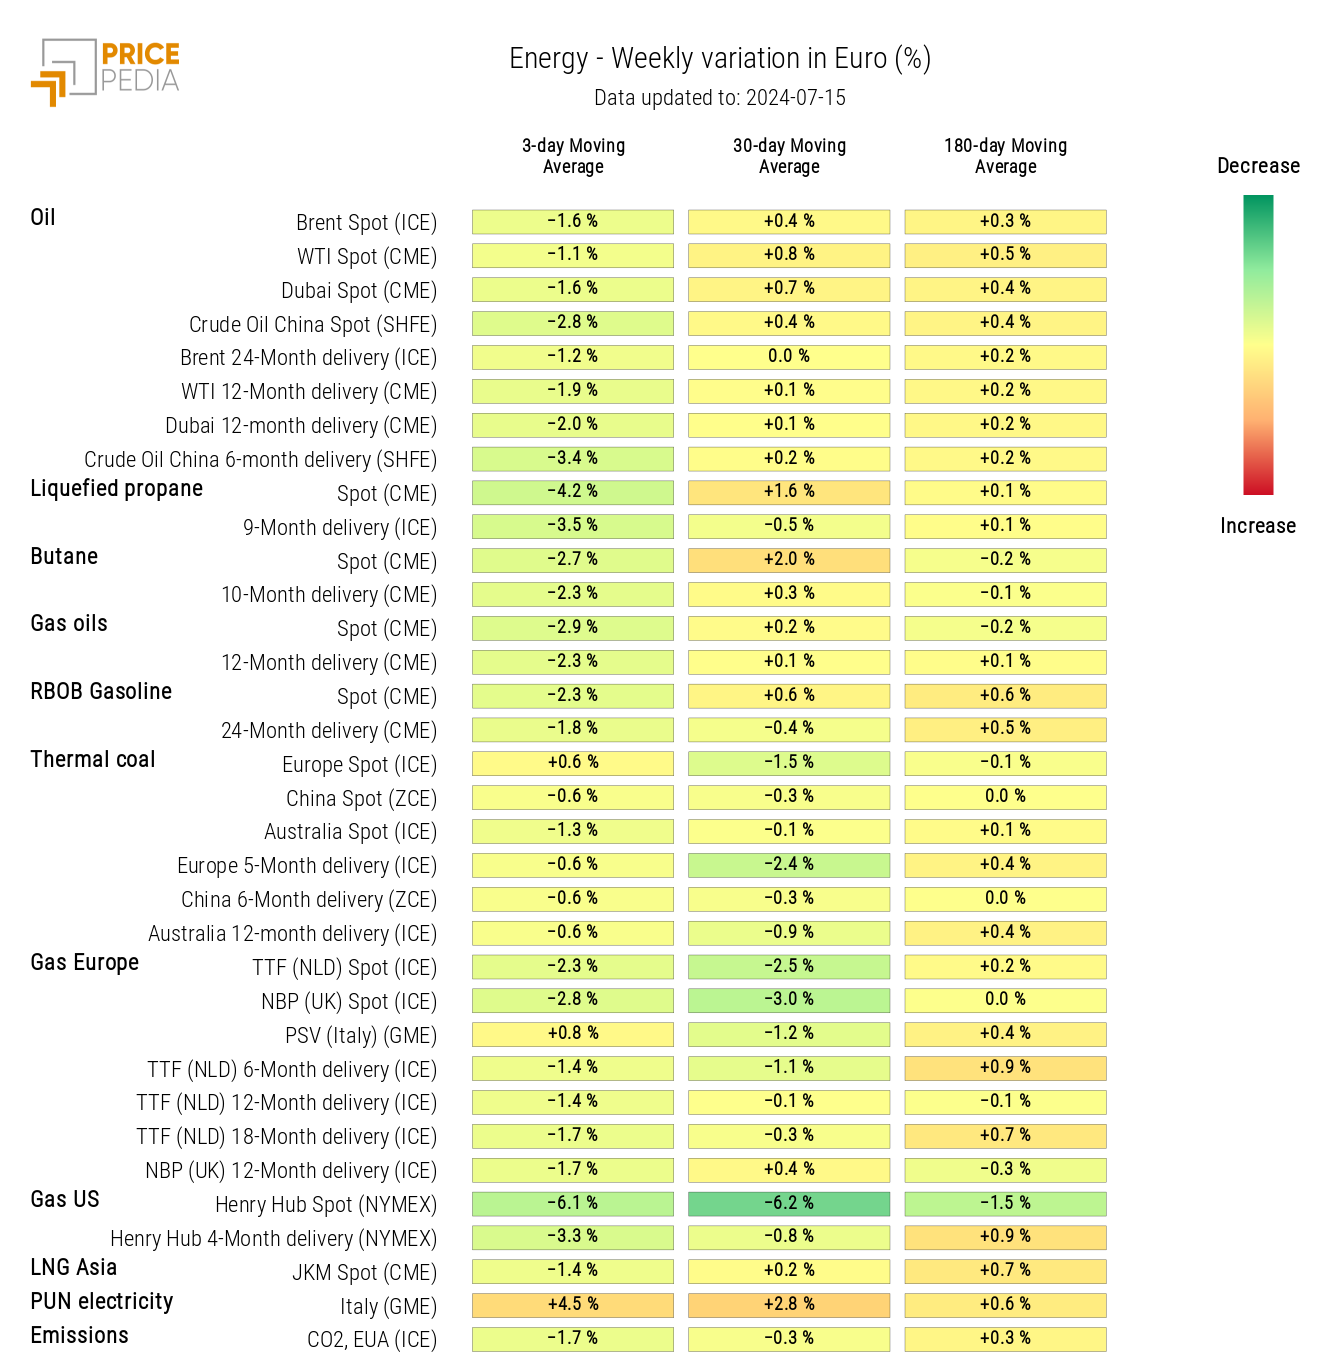
The PricePedia energy prices heatmap is colored green, except for the PUN, which records an increase, although not significant because it depends on the strong intra-week price variability.
PLASTICS
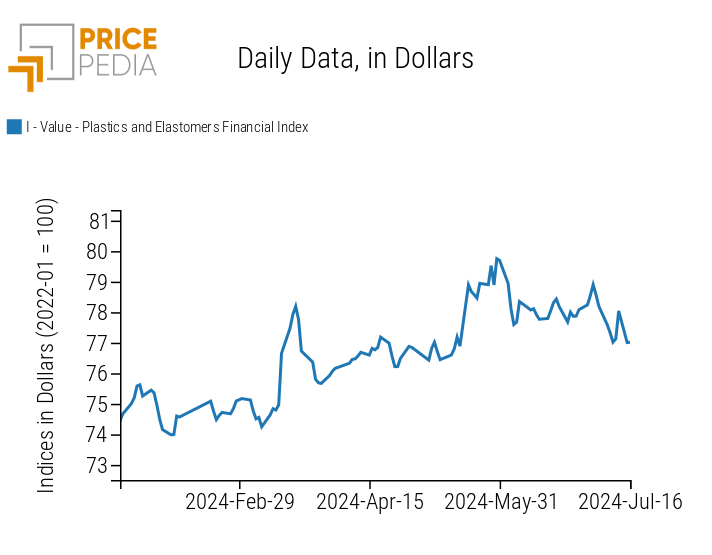
The financial index of plastics quoted in China undergoes a weekly reduction aligned with the reduction in oil prices.
PricePedia Financial Index of plastics prices in dollars
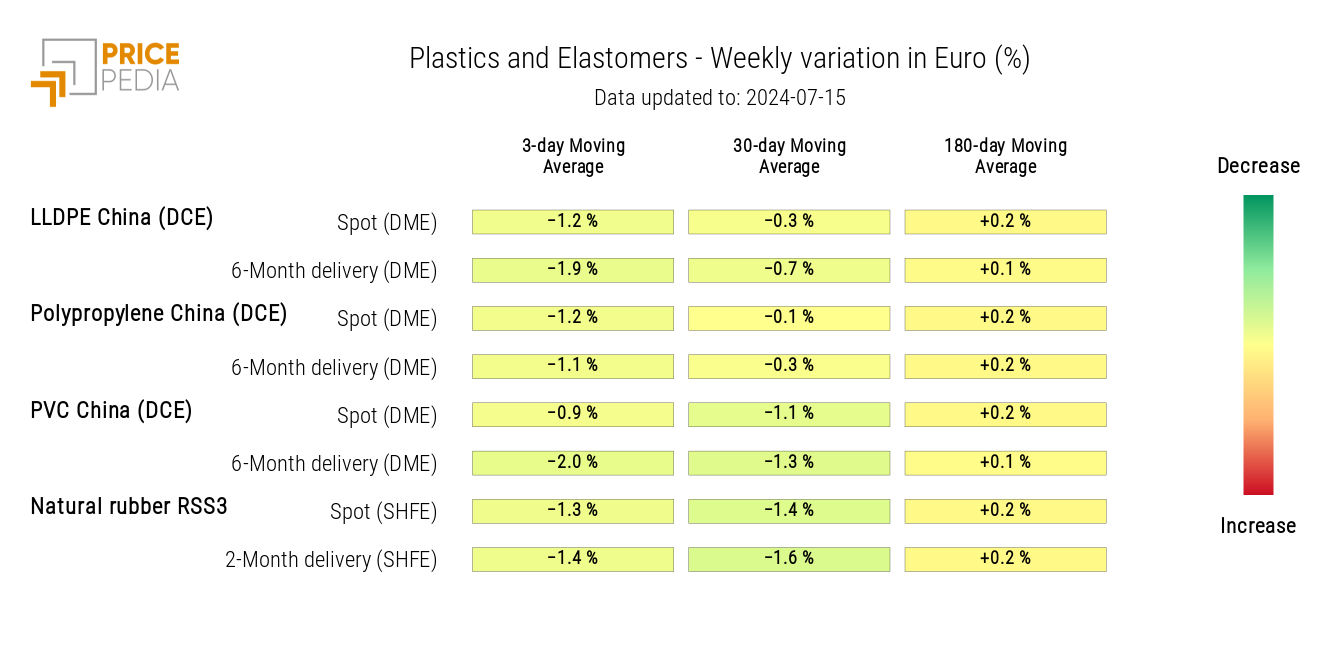
The heatmap of plastics and elastomers highlights a general reduction in all financial prices contained in the index graphed above.
HeatMap of plastics prices in euros
FERROUS METALS
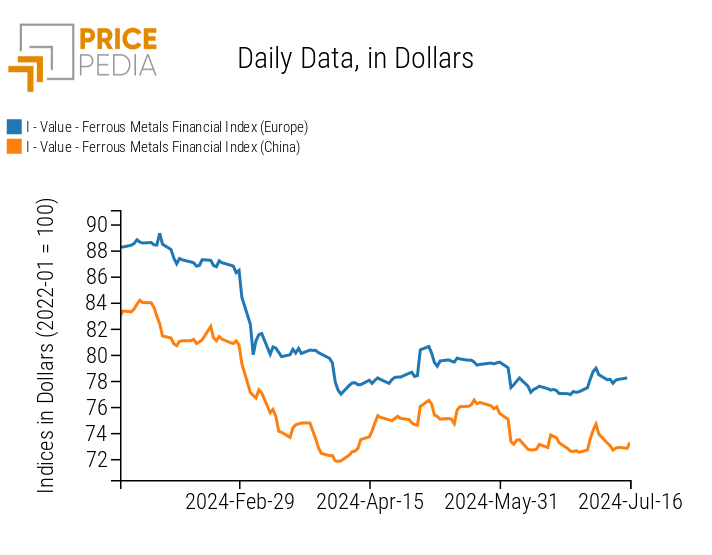
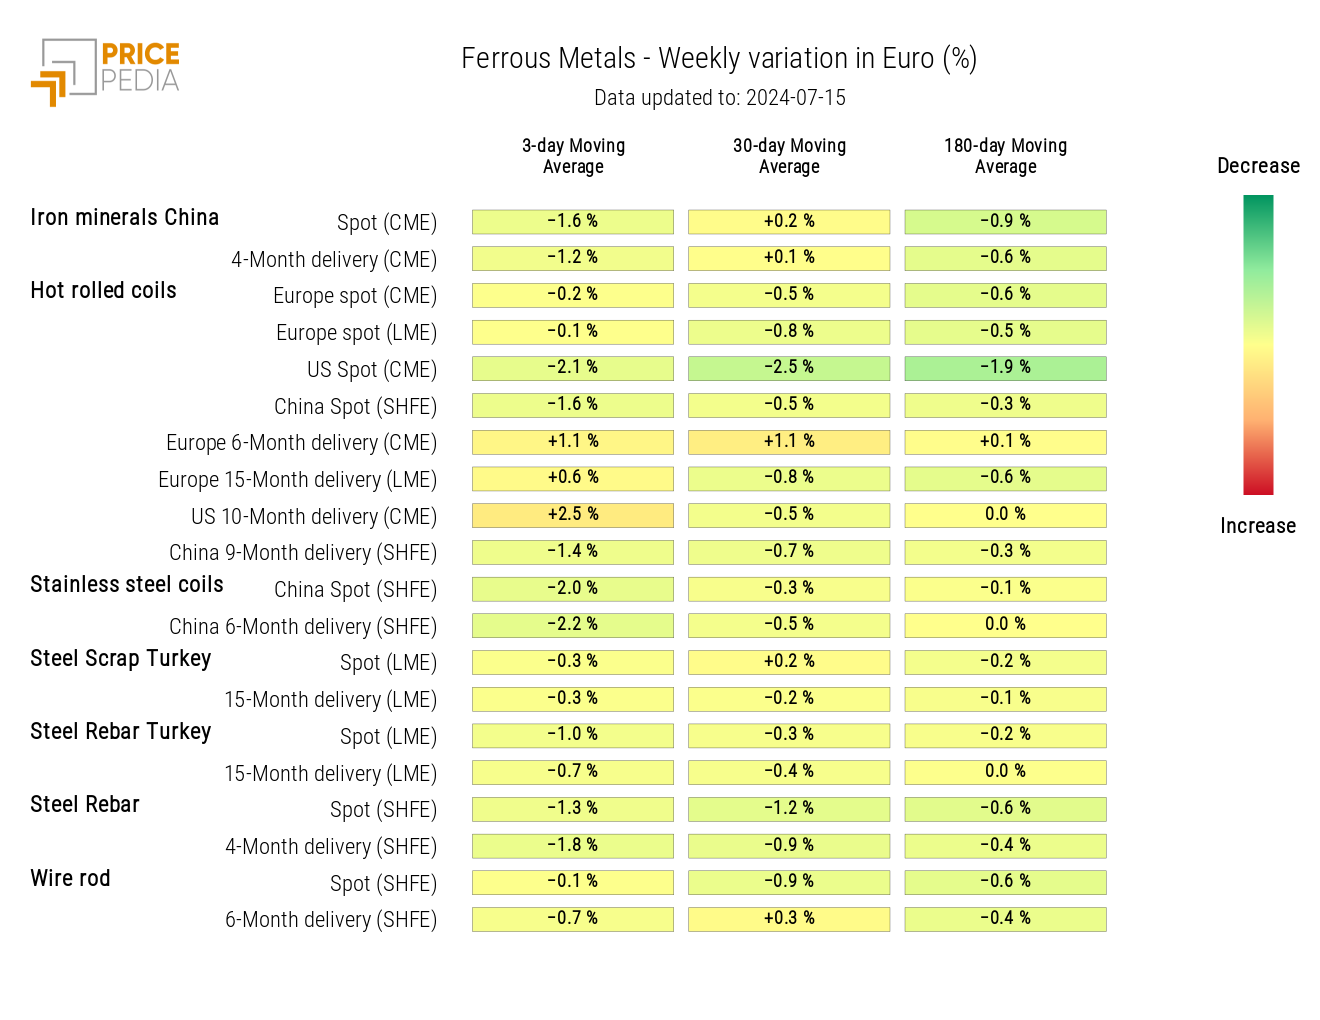
This week, both ferrous metal indices are once again following a price reduction trend, more pronounced for the Chinese index.
PricePedia Financial Index of ferrous metal prices in dollars
The heatmap of financial prices for ferrous metals confirms the downward trend in prices for ferrous materials traded on major international markets.
HeatMap of ferrous metal prices in euros
Do you want to stay up-to-date on commodity market trends?
Sign up for PricePedia newsletter: it's free!
NON-FERROUS INDUSTRIAL
The financial indices of non-ferrous metals quoted on the financial markets of the London Metal Exchange (LME) and the Shanghai Futures Exchange (SHFE) show a reduction in non-ferrous metal prices.
PricePedia Financial Indices of non-ferrous industrial metal prices in dollars
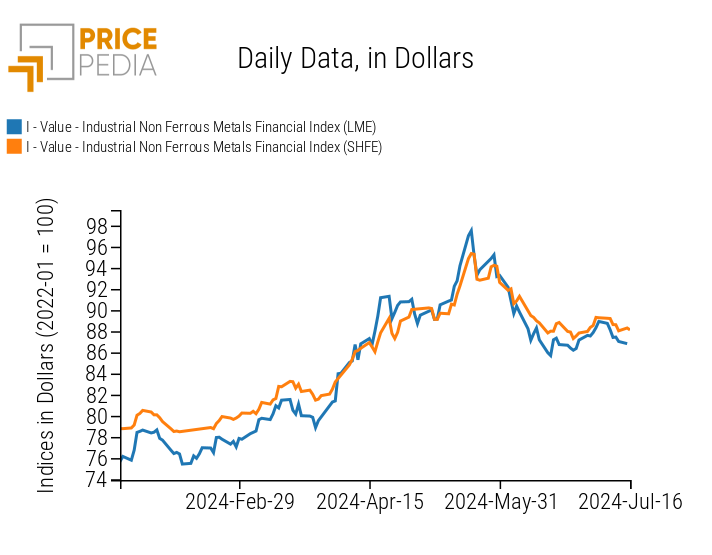
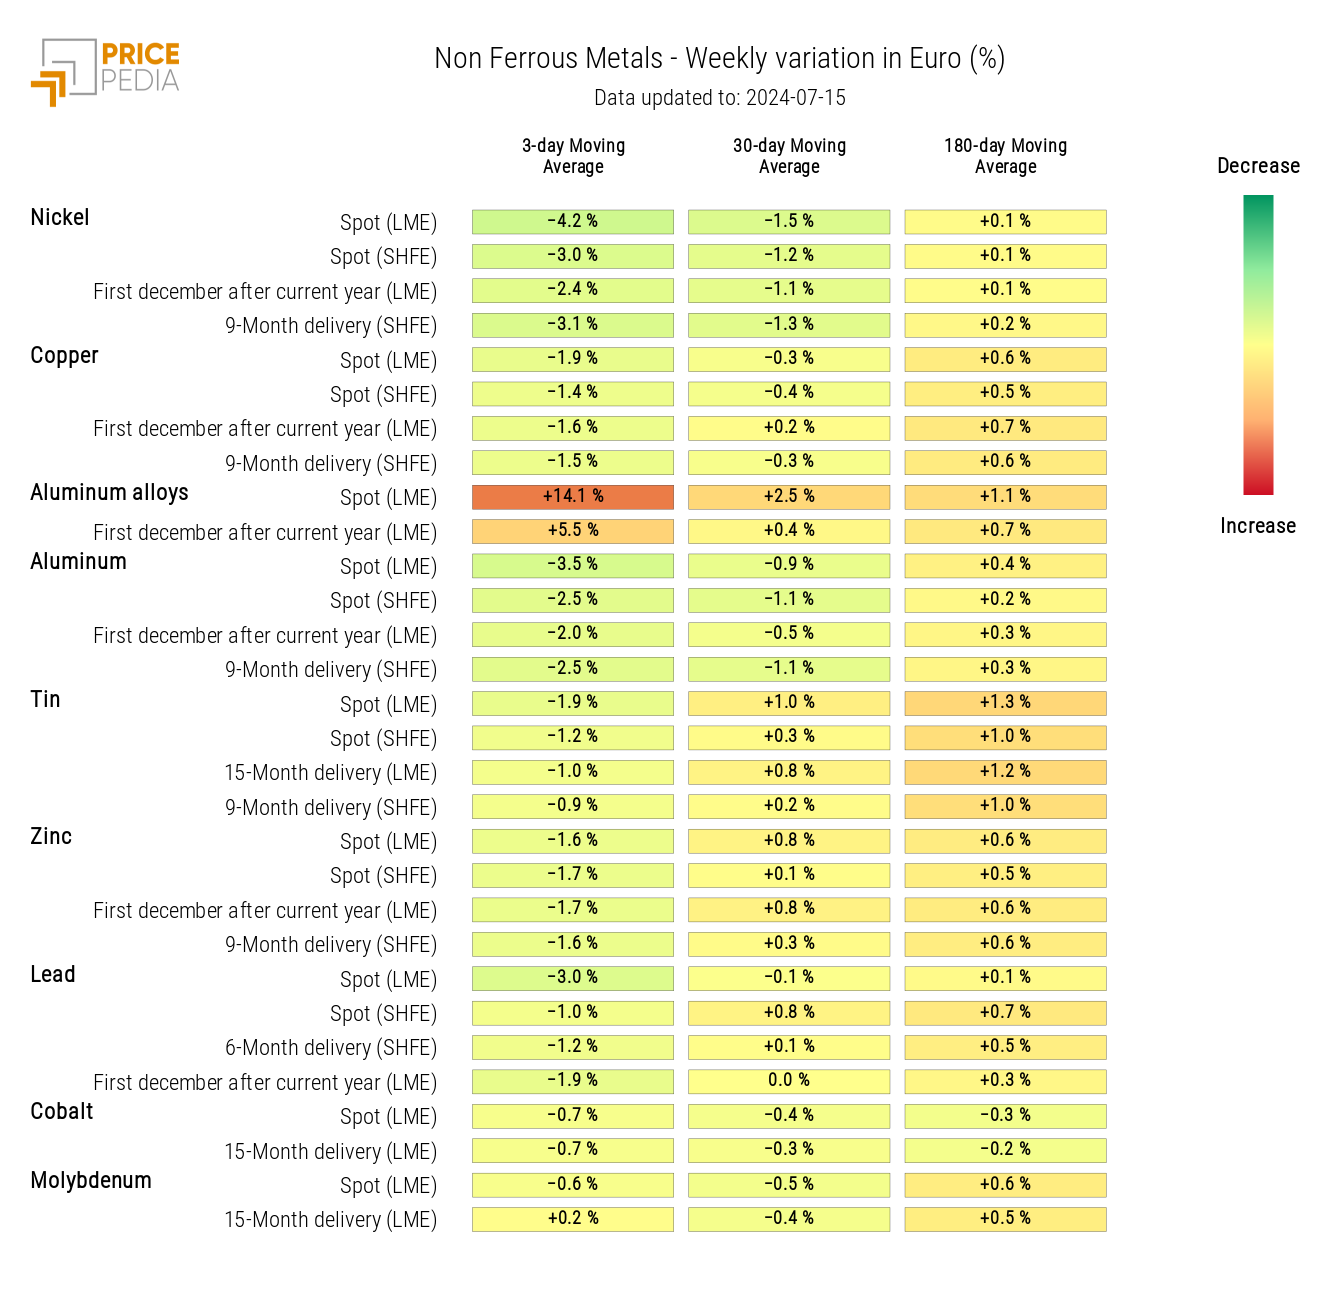
Except for tin and aluminum alloys, which recover the price drop from the previous week, non-ferrous prices are mostly characterized by negative weekly variations. This includes the reduction in nickel prices, despite recent mine closures due to an excess supply from Indonesia.
HeatMap of non-ferrous metal prices in euros
FOOD
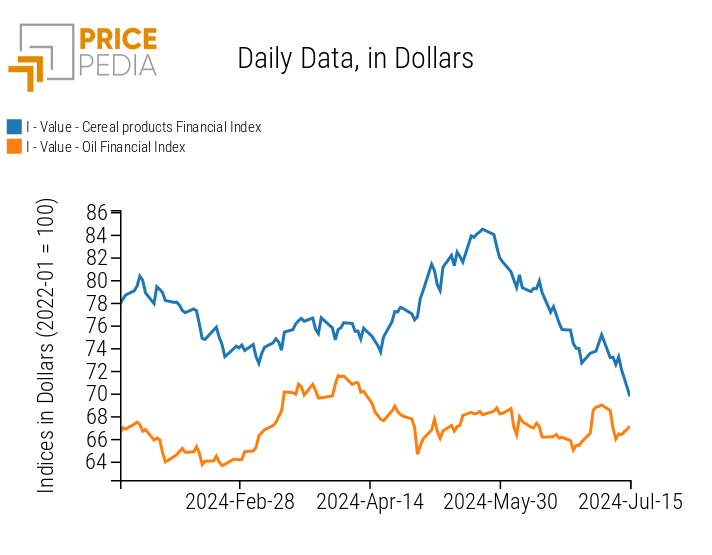
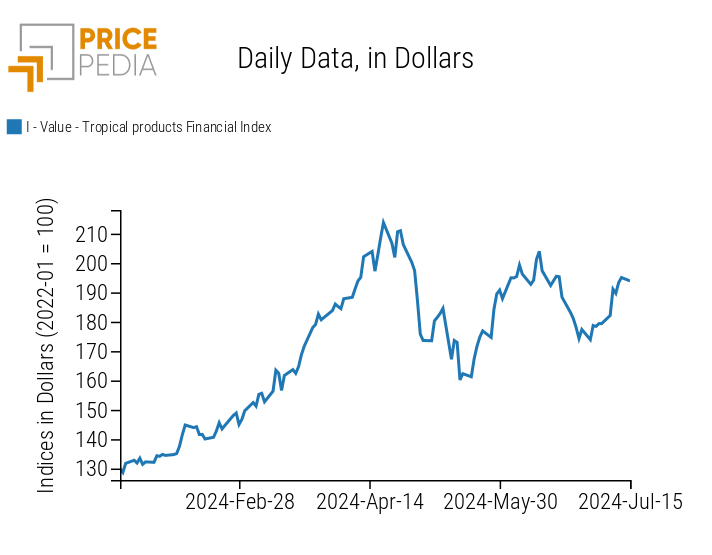
After the positive fluctuations recorded last week, the prices of the grain and edible oil indices return to follow downward trends. The growth of the tropical index persists, driven by rising coffee and cocoa prices.
| PricePedia Financial Indices of food prices in dollars | |
| Grains and Oils | Tropical |
|
|
CEREALS
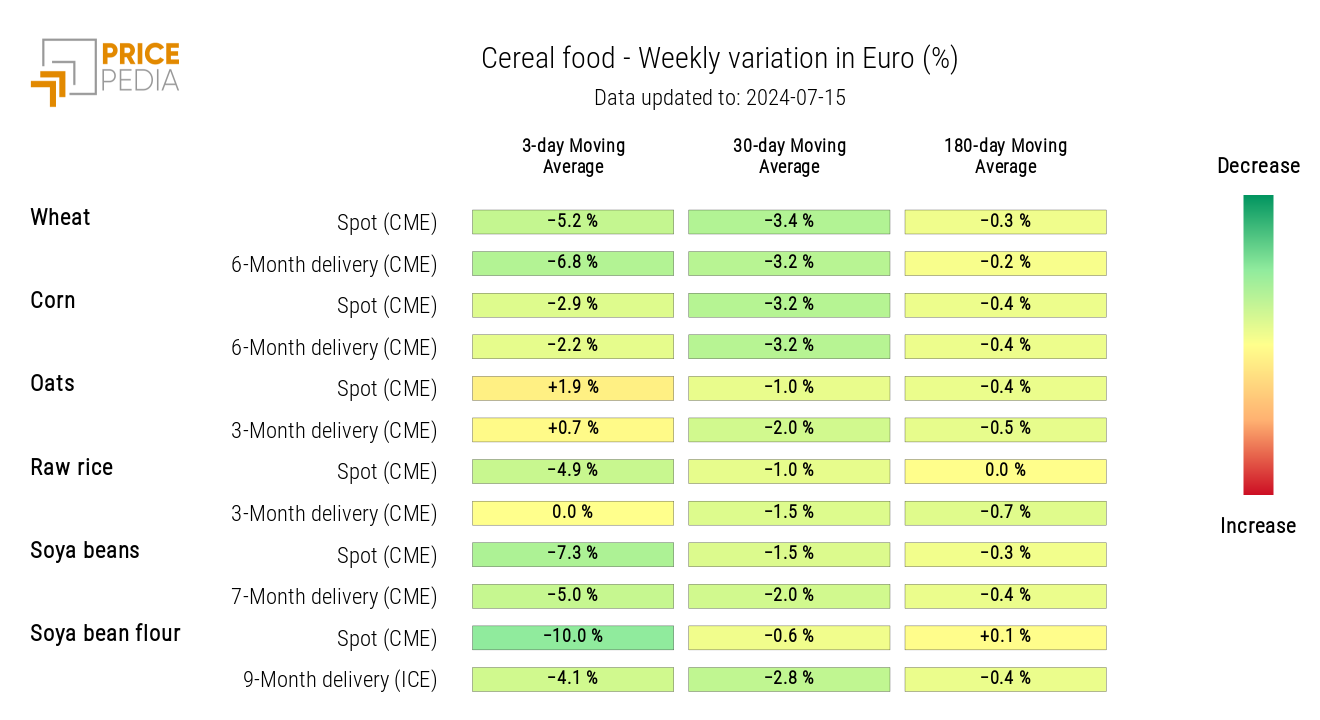
Except for oats, the heatmap of cereals signals a weekly reduction in price levels.
HeatMap of cereal prices in euros
TROPICAL
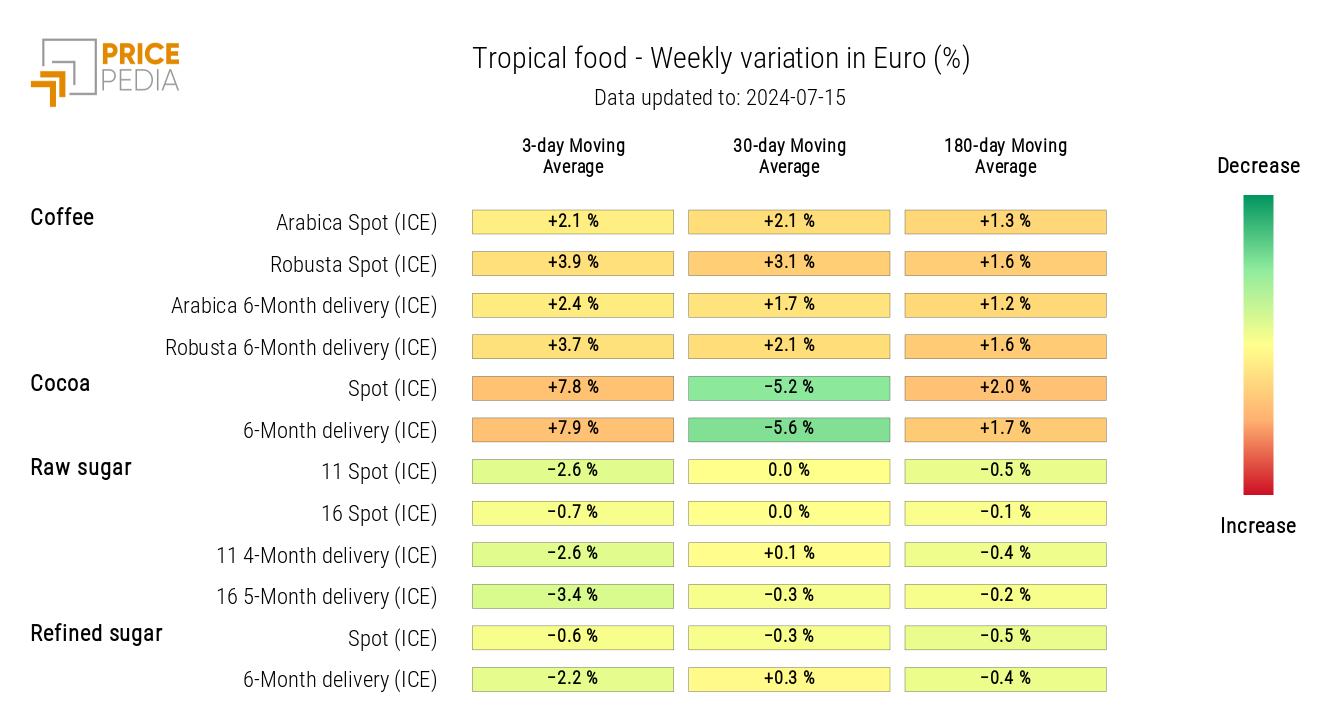
The tropical heatmap highlights in red the increase in coffee and cocoa prices, against a drop in sugar prices.
HeatMap of tropical food prices in euros
OILS
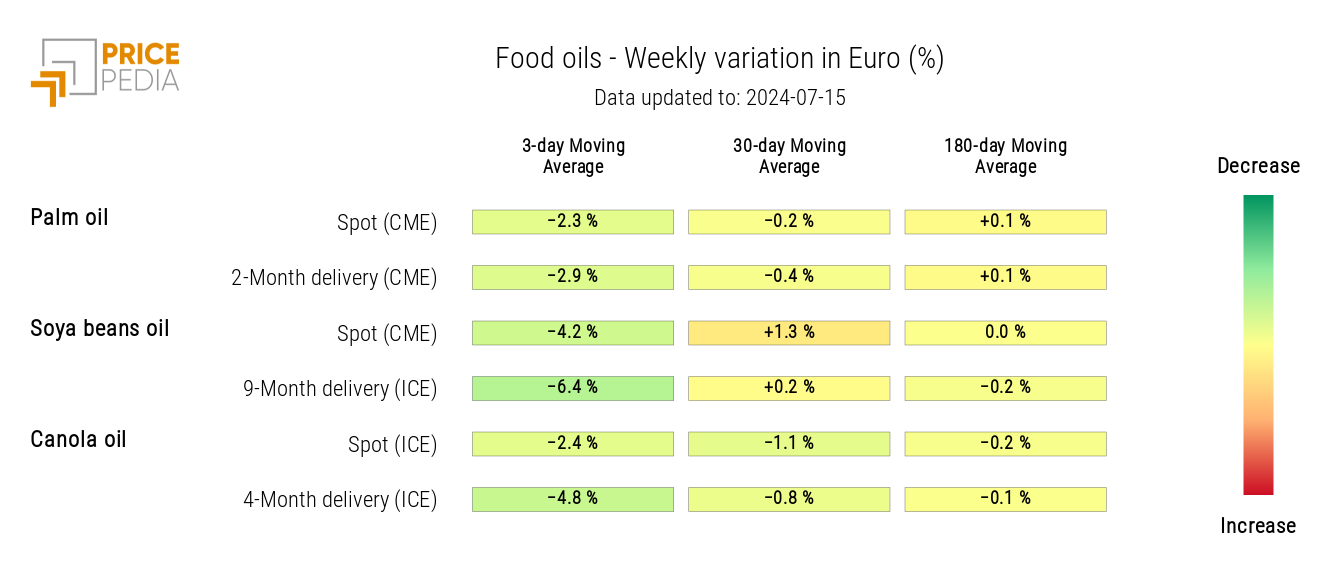
The oil heatmap signals a decline in prices, opposing the growth recorded in the previous week.
HeatMap of oil prices in euros
