Metals market analysis: a cluster approach
For market analysis purposes, it is useful to distinguish metals into three different clusters
Published by Luca Sazzini. .
Ferrous Metals Non Ferrous Metals Analysis tools and methodologiesMetals represent a large number of elements present in nature. In the periodic table, out of 118 elements, 91 are considered metals and 7 are semimetals.
Among these elements defined within the family of metals, various subgroups composed of homogeneous elements can be distinguished.
For the purpose of economic analysis of the markets, in which different metals are traded, it is useful to distinguish the five types of materials in which a metal can be marketed:
- ore: raw material from which primary metal is worked and extracted;
- scrap: alternative raw material to ore; its importance is increasing due to the development of the circular economy;
- pure metal: type of metal characterized by a metallic form and composed of atoms of a single element;
- metal alloy: metal characterized by a metallic form and composed of atoms of multiple elements;
- ferroalloy: alloy of the metal with iron used as a production input in metallurgical processes;
- chemical compound: type of metal chemically bonded to other elements, such as oxygen, chlorine, or sulfur.
An important element for conducting a market analysis is identifying statistical clusters, which are sets of elements with homogeneous characteristics, divided based on specific criteria.
The most complex choice for performing an analysis with a cluster approach is to establish effective criteria for dividing the market into groups composed of elements as homogeneous as possible.
In this analysis, two indices are proposed to divide the metals market into different types of clusters:
- The first is given by the ratio between the price of the pure metal and the price of the metal in the form of ore;
- The second is given by the ratio between the price of the metal in the form of oxide and its price in the form of ore.
Based on the results of these two simple indicators, three subclasses have been identified that can be used to analyze the different metals markets.
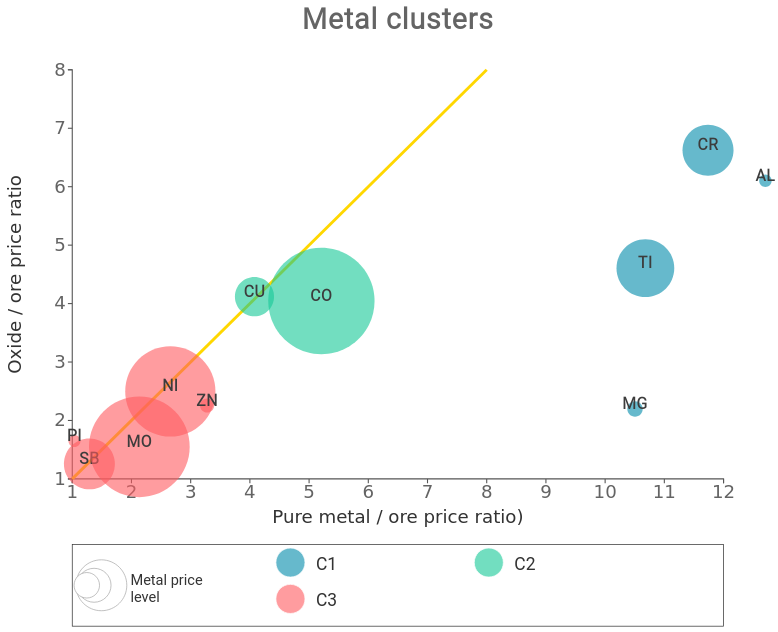
The graph below depicts the statistical analysis of the metals market, using a cluster approach based on the two previously described indicators.
Division of the metals market into 3 statistical clusters

In the graph, the acronyms of the main metals are surrounded by circles of different sizes and colors.
The size of the circle is a variable given by the level of the metal's price; the higher it is, the larger the area of the surrounding circle. For example, since cobalt (CO) has price levels that are about 10 times those of aluminum (AL), it is characterized by a circle with a diameter 10 times larger.
The color of the circle indicates the cluster to which the metal belongs.
Another feature evident from the graph is the presence of a yellow bisector that divides the graph into two parts.
By bisector, we mean the geometric locus that identifies the cases where the value of the x-axis (ratio between the price of pure metal and the price of ore) is identical to the value of the y-axis (ratio between the price of oxide and the price of ore).
The legend represented in the rectangle below the graph highlights the colors of the three identified clusters:
- the first cluster is colored blue;
- the second cluster is colored green;
- the third cluster is colored pink.
Below is a detailed description of each type of cluster that has been identified.
Do you want to stay up-to-date on commodity market trends?
Sign up for PricePedia newsletter: it's free!
Cluster 1
In this cluster, those elements characterized by an oxide price significantly lower than that of pure metal are grouped.
The positioning on the scatter plot of these elements is, in fact, well below the bisector, indicating that the ratio between the price of the oxide and the ore is significantly lower than the ratio between the price of the pure metal and the ore.
This suggests that the elements belonging to this cluster are characterized by transformations from ore to oxide that are less complex and costly compared to transformations from ore to pure metal.
This difference in price ratios means that the oxide price is more dependent on the ore price than the metal is.
The metals analyzed that have been grouped into this type of cluster are: chromium, aluminum, titanium, and magnesium.
Cluster 2
In this cluster, the elements characterized by an oxide price similar to that of pure metal are grouped.
The positioning of the different elements in terms of the price metal/price ore ratio and the price oxide/price ore ratio is, in fact, very close to the bisector drawn on the graph, indicating, precisely, an oxide price similar to that of the metal.
What characterizes these elements is a relatively high ratio between the metal (and oxide) price and the ore price. The transformation from ore to oxide or metal is, therefore, relatively complex and costly.
This also means that the metal and oxide prices are relatively less dependent on the ore price.
The metals analyzed that fall into this second type of cluster are copper and cobalt.
Cluster 3
In this cluster, those "elements" that, as in the case of cluster 2, are characterized by a ratio between metal price and ore price similar to the ratio between oxide price and ore price are grouped.
However, unlike cluster 2, the ratio between the metal (and oxide) price and the ore price is relatively low, indicating lower costs (compared to those in cluster 2) to transform the ore into metal or oxide.
This also means that the metal and oxide prices are relatively more dependent on the ore price.
A characteristic common to both cluster 2 and cluster 3 is that (except for antimony and cobalt which are mainly traded in the form of a chemical compound) all other elements belonging to these clusters (copper, zinc, nickel, molybdenum, and lead) are mainly traded in the form of pure metals, whose financial prices are quoted on the London Metal Exchange (LME)
Conclusion
The analysis conducted in this article suggests a practical approach to market analysis of metals using statistical clusters.
The analysis revealed that the prices in the first cluster are characterized by transformations from ore to oxide that are less complex and costly compared to transformations from ore to pure metal.
Conversely, the metals in the second and third clusters have similar transformation costs from ore to oxide and from ore to pure metal. However, the difference that distinguishes the second cluster from the third is that the second is characterized by higher transformation costs from ore to oxide or metal.


