Chinese demand drives down industrial metal prices
On the other side of the Pacific, US GDP growth and inflation exceeded expectations
Published by Luca Sazzini. .
Conjunctural Indicators Commodities Financial WeekThis week, non-ferrous metal prices have returned to late March levels, completely erasing the gains recorded in April and May.
The downward phase in non-ferrous metal financial prices was caused by weak Chinese demand and concerns over protectionist policies by the United States1. However, this trend has been significantly exacerbated by the conclusion of the third Chinese plenum, which did not reveal any short-term policies to support Chinese demand for metals.
The absence of government stimulus measures, combined with the prolonged real estate crisis, has increased concerns among market operators who were expecting government interventions to boost metal demand.
The only policies to support industrial metals that emerged from the third Chinese plenum are related to the energy transition. The Chinese Communist Party has indeed announced its intention to reduce carbon emissions to promote green and sustainable development, which will increase long-term demand for metals used in electric vehicles, batteries, and renewable energy. However, in the short term, the lack of immediate interventions will prolong the weakness in Chinese demand, which remains the primary driver of the decline in non-ferrous metal financial prices.
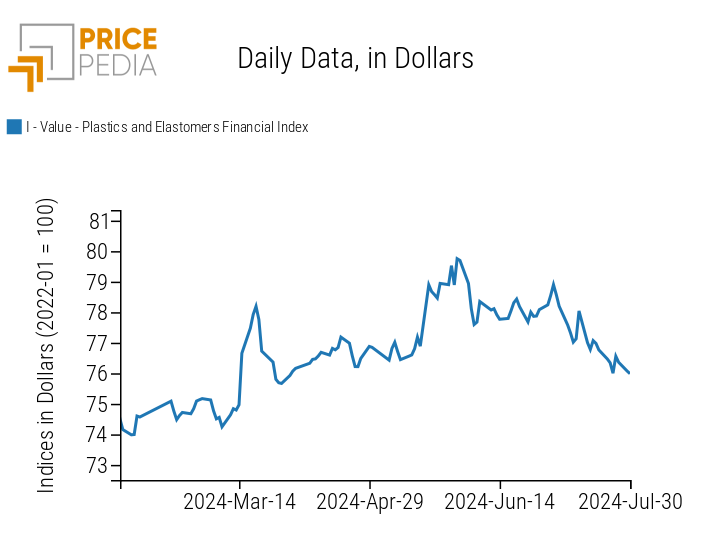
The price dynamics of oil continued to show a decline, despite a brief positive oscillation. The same trend was observed for the financial prices of plastic materials, which tend to be strongly influenced by the dynamics of Brent.
U.S. Economic Outlook
In the second quarter, there was a growth in the GDP and U.S. inflation exceeded analysts' expectations.
The annualized quarterly growth of the GDP of the United States in the second quarter of 2024 was 2.8%, significantly above the consensus forecasts (2%) and a sharp acceleration from the previous quarter (1.4%). This unexpected growth is attributed to an improvement in consumption (2.3% q/q ann. from 1.5%) and private investments (8.4% from a previous 4.4%).
The core PCE inflation growth for the second quarter of 2024 was 2.9%, compared to expectations of 2.7%. This data is therefore negative, despite some improvement from the previous quarter (3.7%).
The growth in GDP, coupled with a higher-than-expected inflation rate, reduces the likelihood of a FED interest rate cut in September 2024.
It also makes it almost certain that, for next week's meeting, the FED will keep interest rates unchanged.
Purchasing Managers' Index (PMI)
The flash estimates of the composite PMI for the United States and Europe are 55 and 50.1 points, respectively.
The U.S. figure remains positive, showing an improvement from June (54.8) and staying well above the 50-point threshold, indicating economic growth. Conversely, the European composite index shows a decline from June (50.9), suggesting potential stagnation in GDP.
Analyzing the manufacturing sector data, deteriorations are evident in both the U.S. and Europe.
The U.S. manufacturing PMI dropped from 51.6 to 49.5, indicating a contraction in the manufacturing sector.
In Europe, the July manufacturing PMI stands at 45.6, well below the 50-point threshold and further down from June (45.8).
[1] See the article: "Commodity prices falling for very different reasons "
ENERGY
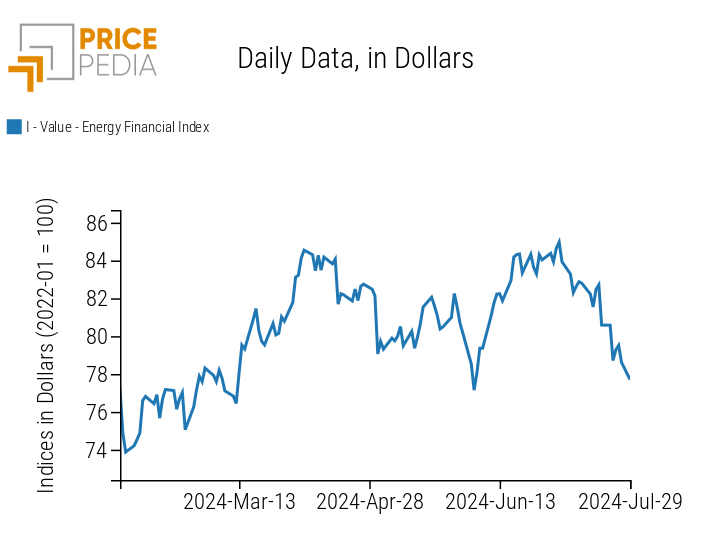
The PricePedia financial index of energy products continues its downward trend despite a slight positive fluctuation.
PricePedia Financial Index of Energy Prices in USD
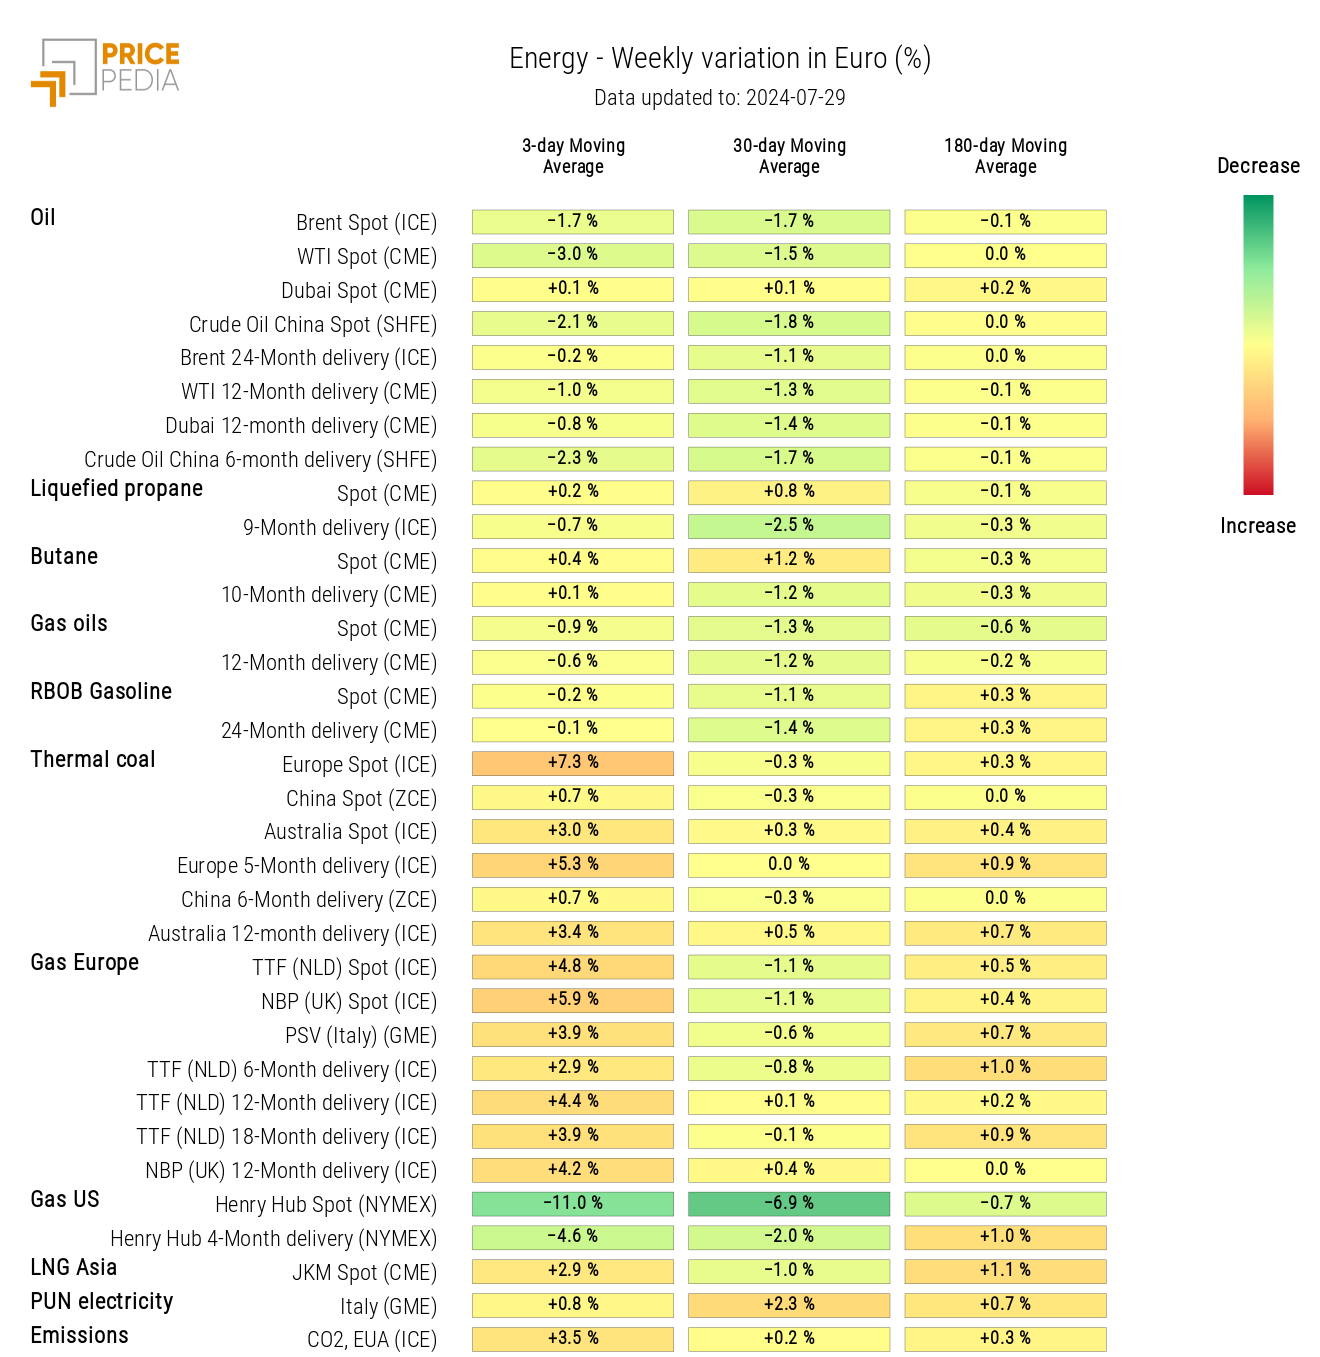
The heatmap indicates a negative weekly change in the 3-day moving average for oil prices, more pronounced for the WTI spot price quoted on the Intercontinental Exchange (ICE).
HeatMap of Energy Prices in Euro
PLASTICS
The financial index of plastics quoted in China records a decrease in prices, in line with Brent quotations.
PricePedia Financial Index of Plastics Prices in USD
FERROUS
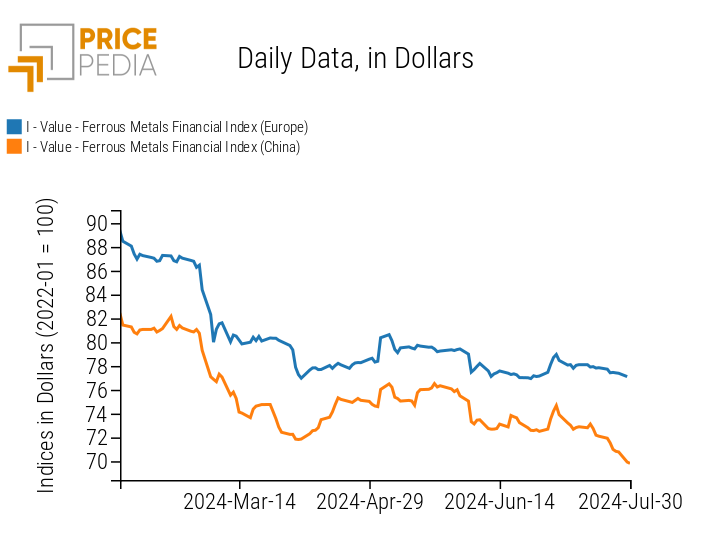
The financial index of ferrous metals in Europe remains relatively stable, while the index for ferrous metals in China shows an increased price decline.
PricePedia Financial Index of Ferrous Metal Prices in USD
Do you want to stay up-to-date on commodity market trends?
Sign up for PricePedia newsletter: it's free!
INDUSTRIAL NON-FERROUS
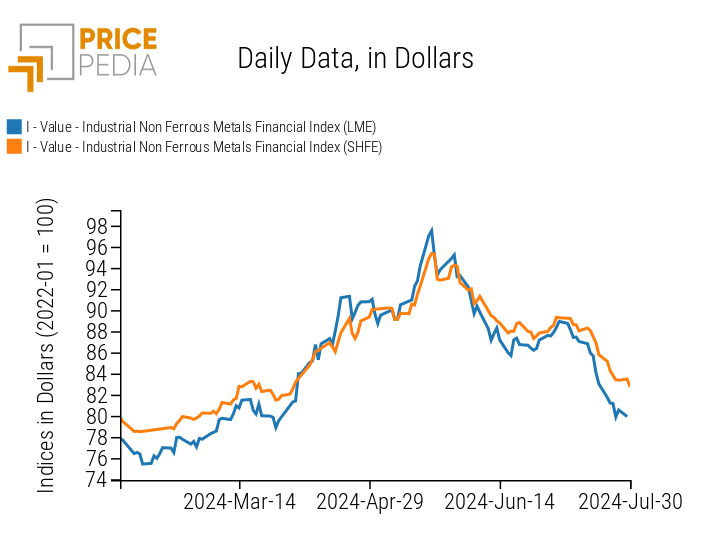
Both financial indices of non-ferrous metals show a decline in prices.
The reduction is slightly more pronounced at the London Metal Exchange (LME) compared to the Shanghai Futures Exchange (SHFE).
PricePedia Financial Index of Industrial Non-Ferrous Metal Prices in USD
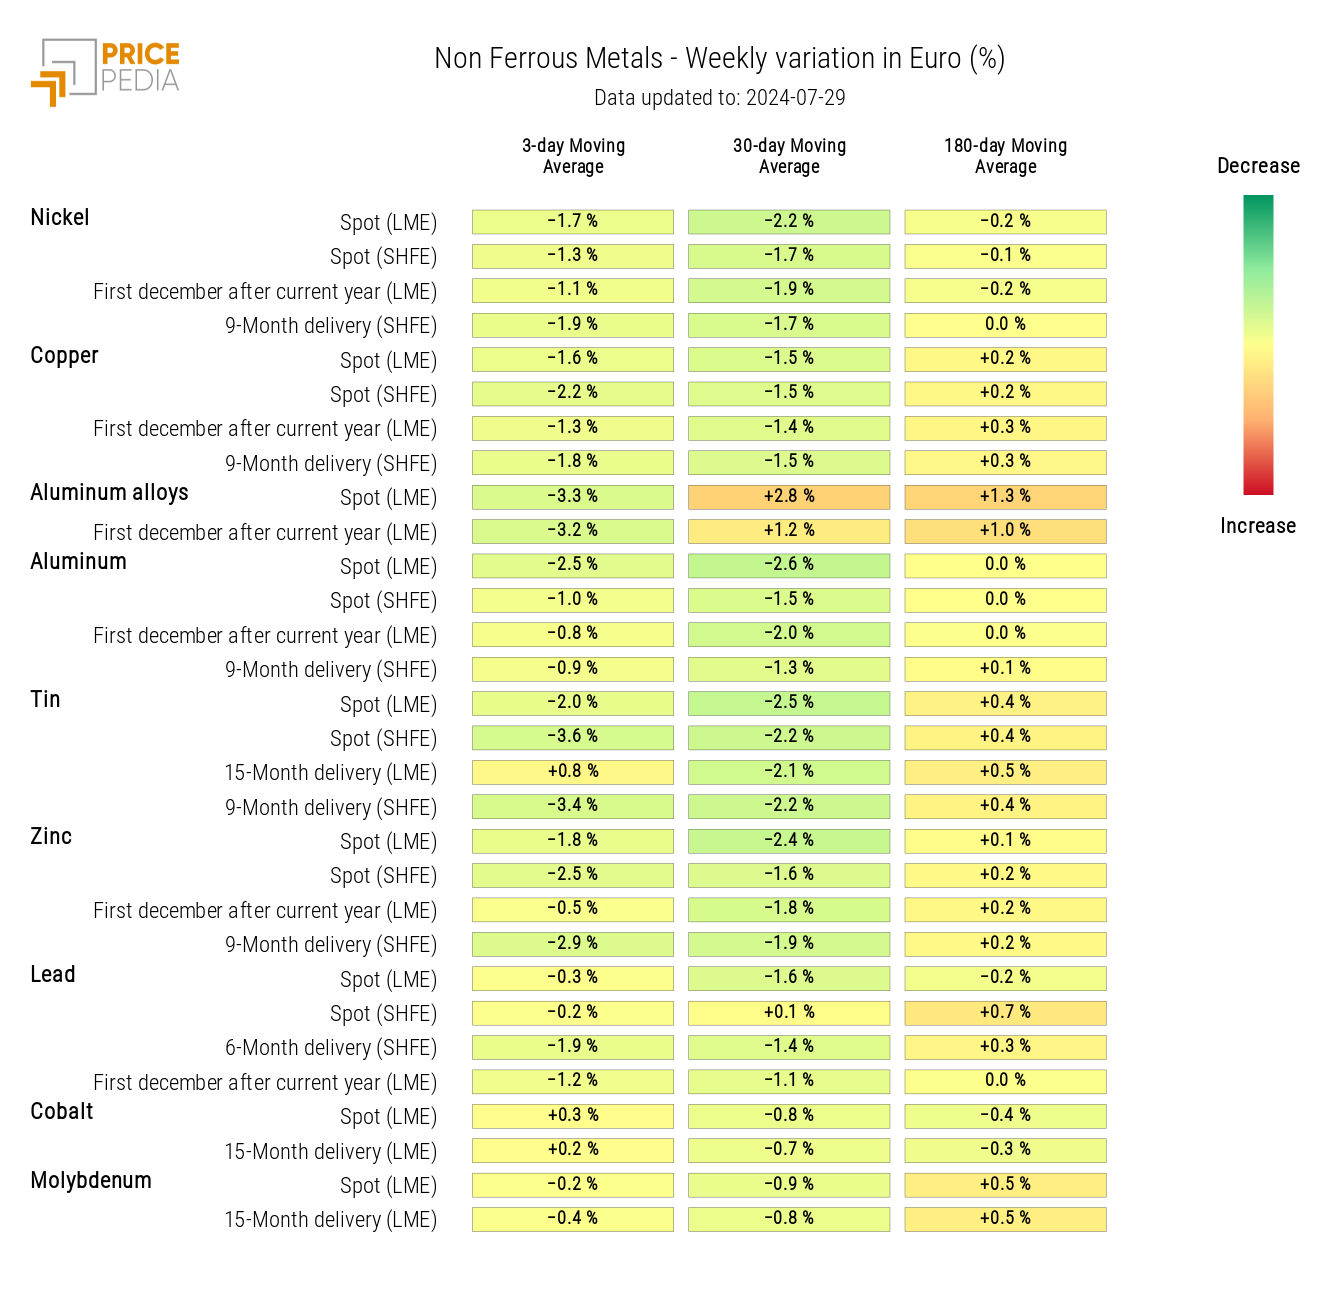
A general decline in non-ferrous metal prices is evident from the non-ferrous heatmap.
HeatMap of Non-Ferrous Metal Prices in Euro
FOOD
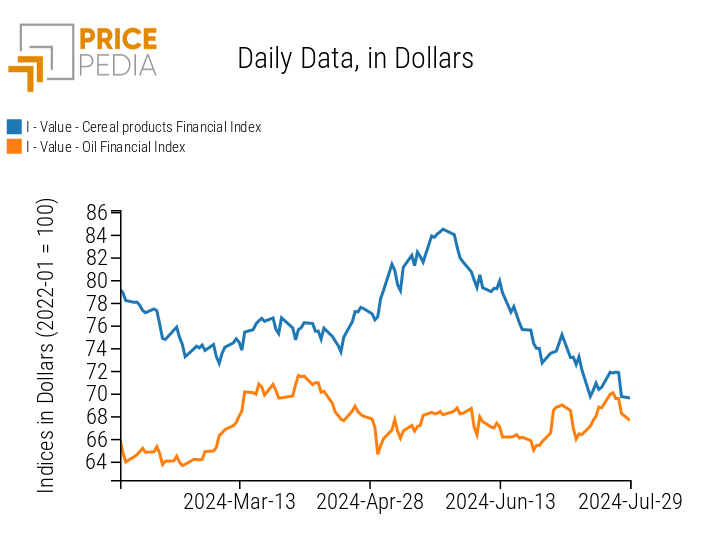
This week, the financial indices of cereals and oils experienced positive price changes in the early days, followed by a sharp adjustment on Friday, especially for grains.
Early in the week, the price increase was also driven by forecasts of reduced rainfall in the United States. The uncertainty surrounding this issue led to Friday's adjustment.
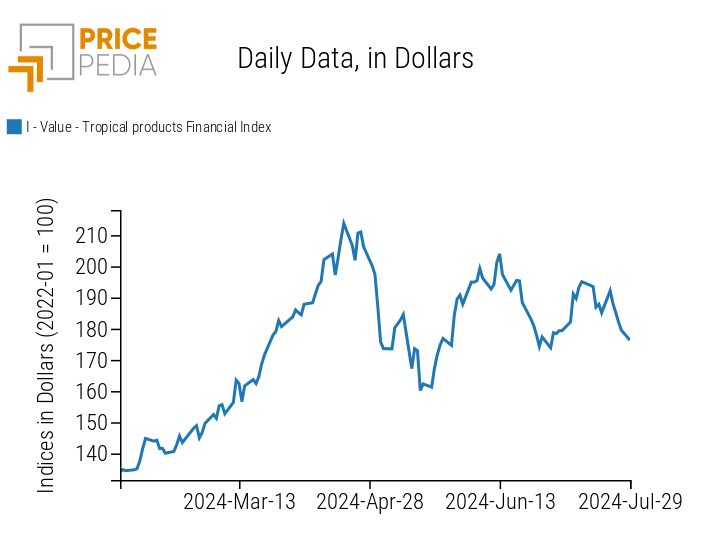
The tropical index also declined this week.
| PricePedia Financial Indices of Food Prices in Dollars | |
| Grains and Oils | Tropical |
|
|
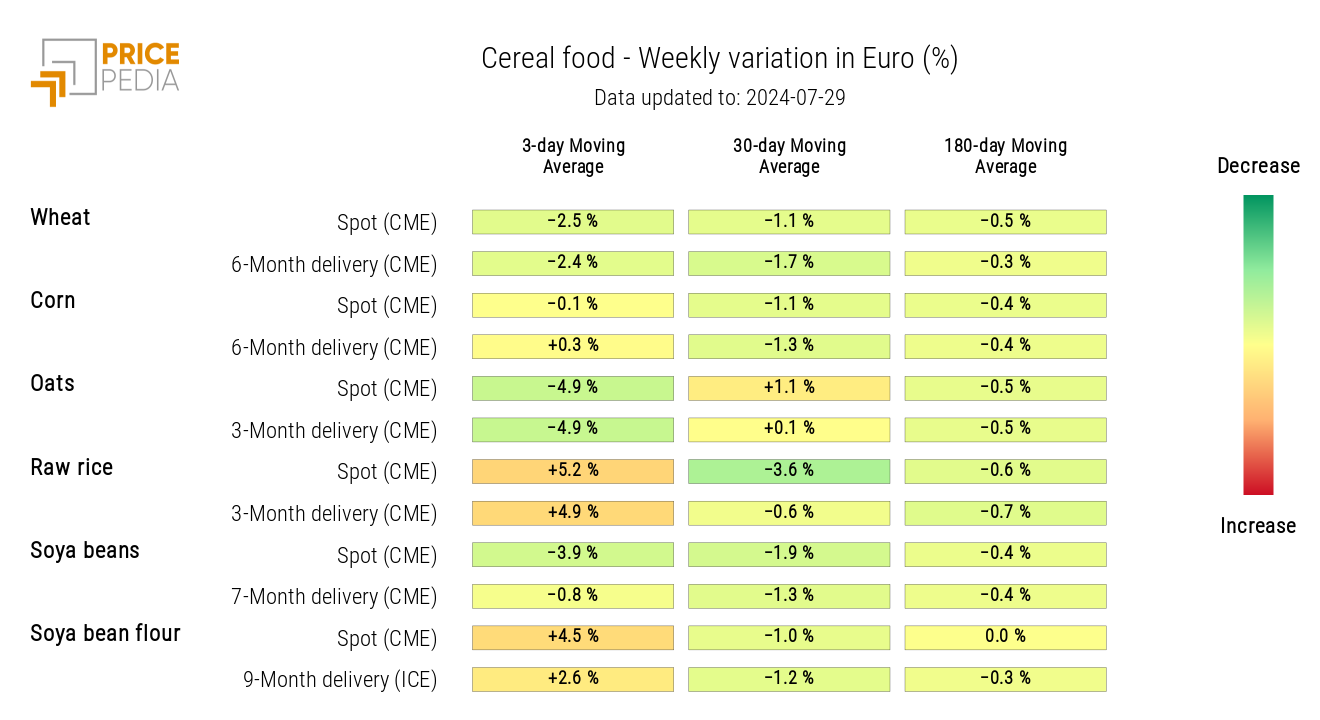
CEREALS
The heatmap indicates an increase in the prices of rough rice and soybean meal, despite a decrease in the prices of oats, soybeans, and wheat.
HeatMap of Grain Prices in Euros
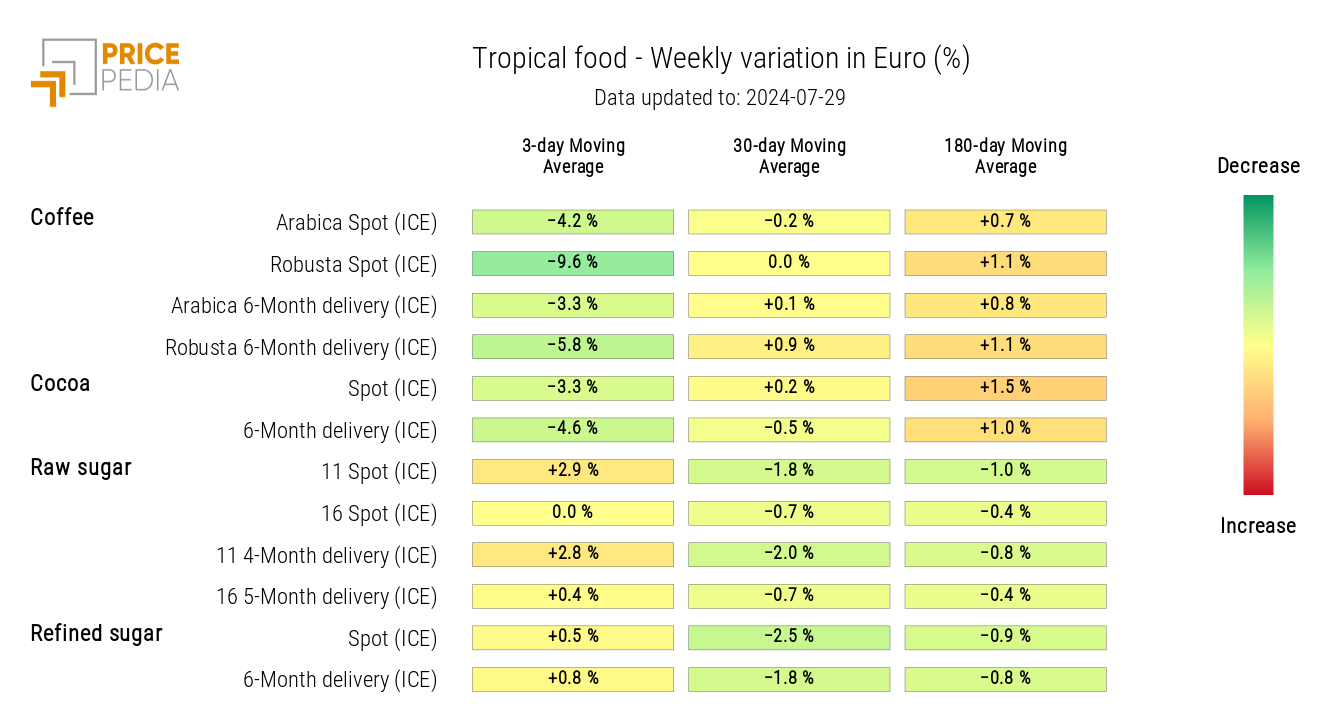
TROPICAL
The heatmap indicates a weekly decrease in the 3-day moving average of coffee and cocoa prices.
HeatMap of Tropical Food Prices in Euros
OILS
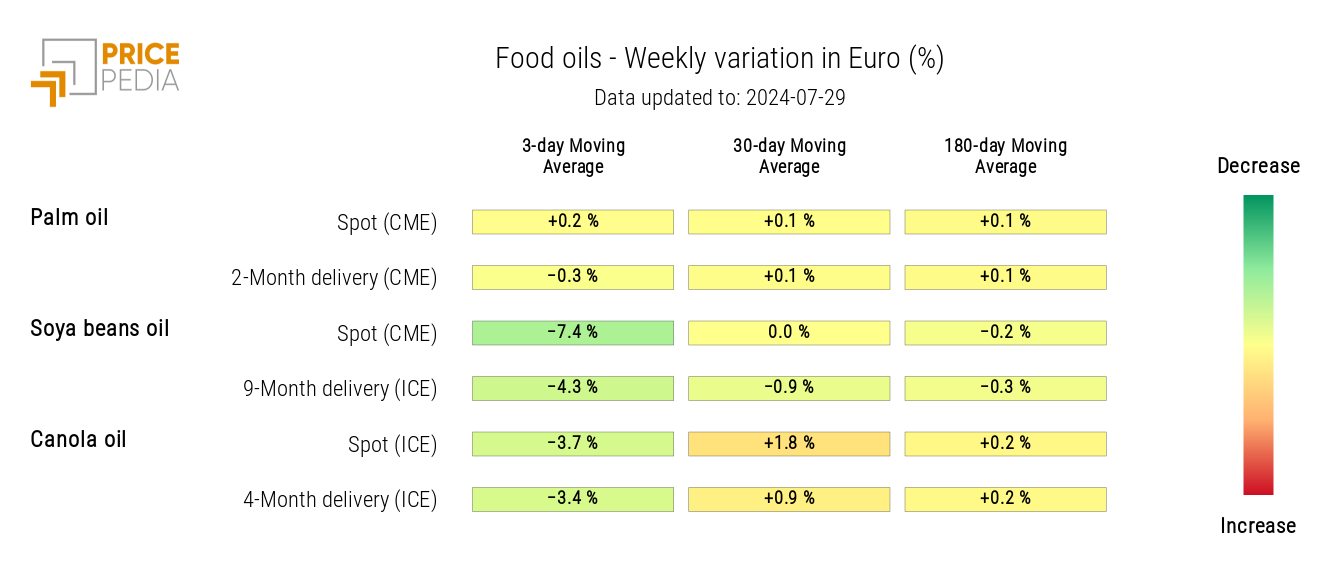
The heatmap of edible oils shows a reduction in the three-day moving average of soybean oil and canola oil prices.
HeatMap of Edible Oil Prices in Euros
