World steel input prices
Globalisation of inputs produces links in the world steel industry
Published by Luca Sazzini. .
Ferrous Metals Price Drivers
The global steel market is characterized by various tariff and trade barriers that differ across different geographical areas.
Many countries adopt anti-dumping duties and safeguard measures to protect local producers from low-cost steel imports from third countries. The aim is to counteract unfair price competition and support the local industry.
The regionalization of the global steel industry due to protectionist interventions by various countries is, however, at least partially mitigated by the globalization of key production inputs. Therefore, to conduct an analysis of the global steel market, it can be useful to focus on the prices of various steel inputs to verify their degree of globalization and whether there are geographic areas with cost advantages compared to the rest of the world.
This article focuses on the global prices of the three main steel inputs: iron ore, iron scrap, and coke coal.
Analysis of Iron Ore Prices
The key production input for the steel industry is iron ore, which forms the base element for steel production.
There are two types of iron ores: untreated iron ores and agglomerated ores. The latter are produced through processes that combine fine particles of iron ore into larger and more stable forms. Agglomerated ores improve furnace efficiency, reduce fuel consumption, and enhance the quality of the produced iron.
Prices of Untreated Iron Ore
Iron ore prices are negotiated both in financial markets and in regional markets.
The following chart compares the financial prices of Chinese iron ore, quoted on the Dalian Commodity Exchange (DCE) and the Chicago Mercantile Exchange (CME), with the customs prices of iron ore in the Chinese and European markets.
Financial and Customs Prices of Iron Ore
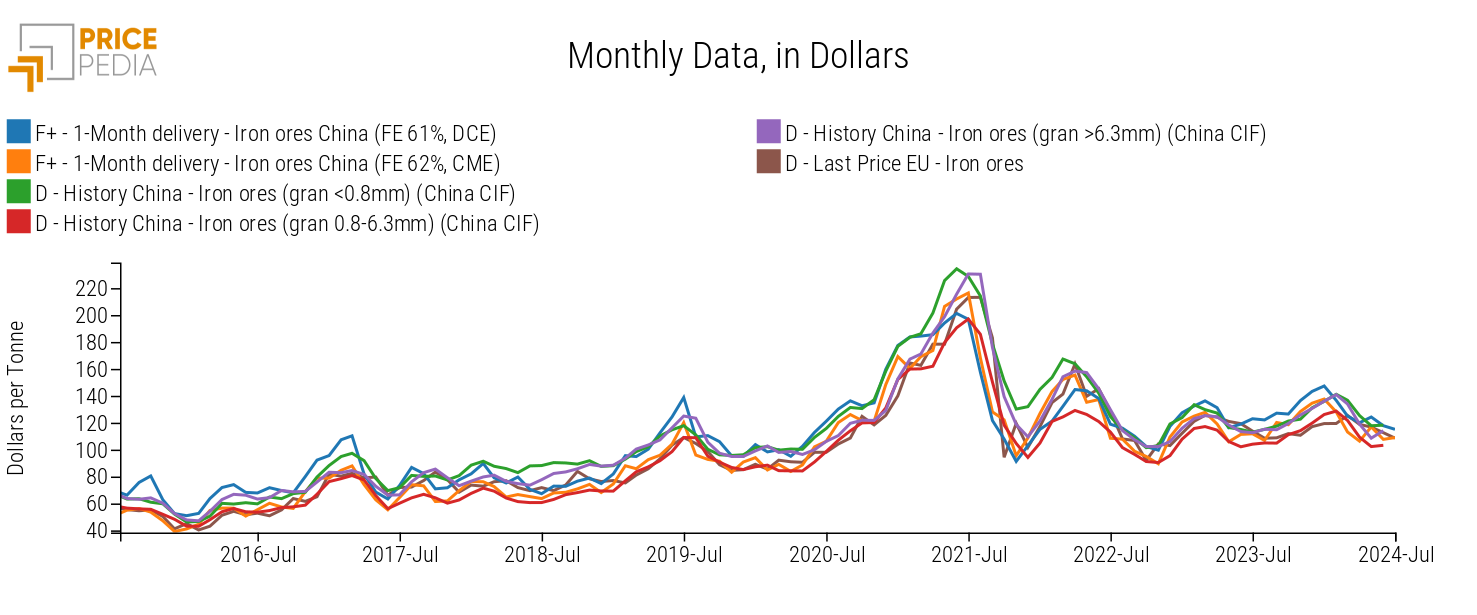
The analysis of the chart reveals a high correlation between the financial prices and the customs prices of the two different regional markets.
European and Chinese prices, besides being characterized by similar price levels, tend to follow the same price dynamics quoted in the various financial markets.
The following table compares the various average prices of iron ore from 2019 to the present for the DCE and CME financial markets and the regional markets of China and Europe.
Average Annual Prices of Untreated Iron Ore, in Dollars per Ton
| 2019 | 2020 | 2021 | 2022 | 2023 | 2024 | |
|---|---|---|---|---|---|---|
| F+-1 Month Delivery-Iron Ore China (FE 61%, DCE) | 106 | 120 | 158 | 122 | 129 | 126 |
| F+-1 Month Delivery-Iron Ore China (FE 62%, CME) | 93 | 107 | 160 | 121 | 119 | 117 |
| D-Historical China-Iron Ore (gran. < 0.8 mm) (China CIF) | 102 | 118 | 187 | 133 | 122 | 131 |
| D-Historical China-Iron Ore (gran. 0.8-6.3 mm) (China CIF) | 90 | 101 | 154 | 110 | 110 | 118 |
| D-Historical China-Iron Ore (gran. >6.3 mm) (China CIF) | 104 | 109 | 175 | 128 | 120 | 128 |
| D-Last Price EU-Iron Ore | 91 | 102 | 163 | 124 | 116 | 120 |
The table shows a single average price for iron ore traded in the European and Chinese customs markets, differentiated by particle size. The distinction of Chinese prices allows us to highlight how the prices of ore with particles smaller than 0.8 mm and larger than 6.3 mm have been on average higher than those characterized by particles between 0.8 mm and 6.3 mm.
This data can be explained by the fines, due to their greater use in the production of agglomerated iron ore, and for the larger sizes, since they are more in demand for use in blast furnaces.
Prices of Agglomerated Iron Ore
The following table compares the prices of agglomerated ores present in the regional markets of China, Europe, and the United States.
Average Annual Prices of Agglomerated Iron Ores, in Dollars per Ton
| 2019 | 2020 | 2021 | 2022 | 2023 | 2024 | |
|---|---|---|---|---|---|---|
| H-Historical China-Agglomerated Iron Ores (China CIF) | 123 | 131 | 214 | 161 | 131 | 138 |
| H-Last Price EU-Agglomerated Iron Ores | 130 | 122 | 211 | 175 | 149 | 161 |
| H-Historical USA-Agglomerated Iron Ore (USA CIF) | 157 | 133 | 223 | 216 | 179 | 189 |
The analysis of prices reveals that China has a cost advantage compared to the European Union and, especially, the United States.
Scrap Prices Analysis
Scrap is a steelmaking input that is expected to become increasingly important due to the energy transition. This production input offers two fundamental advantages:
- Reduces energy consumption: producing steel from scrap requires significantly less energy compared to producing steel from iron ore;
- Reduces emissions: recycling metal scrap reduces greenhouse gas emissions, as it involves fewer extraction and processing activities.
The financial prices of steel scrap are quoted on the London Metal Exchange (LME), based on the prices of scrap delivered in Turkey according to Platts.
The following graph correlates these financial prices with the customs prices of the European and United States markets.
Financial and Customs Prices of Iron Scrap
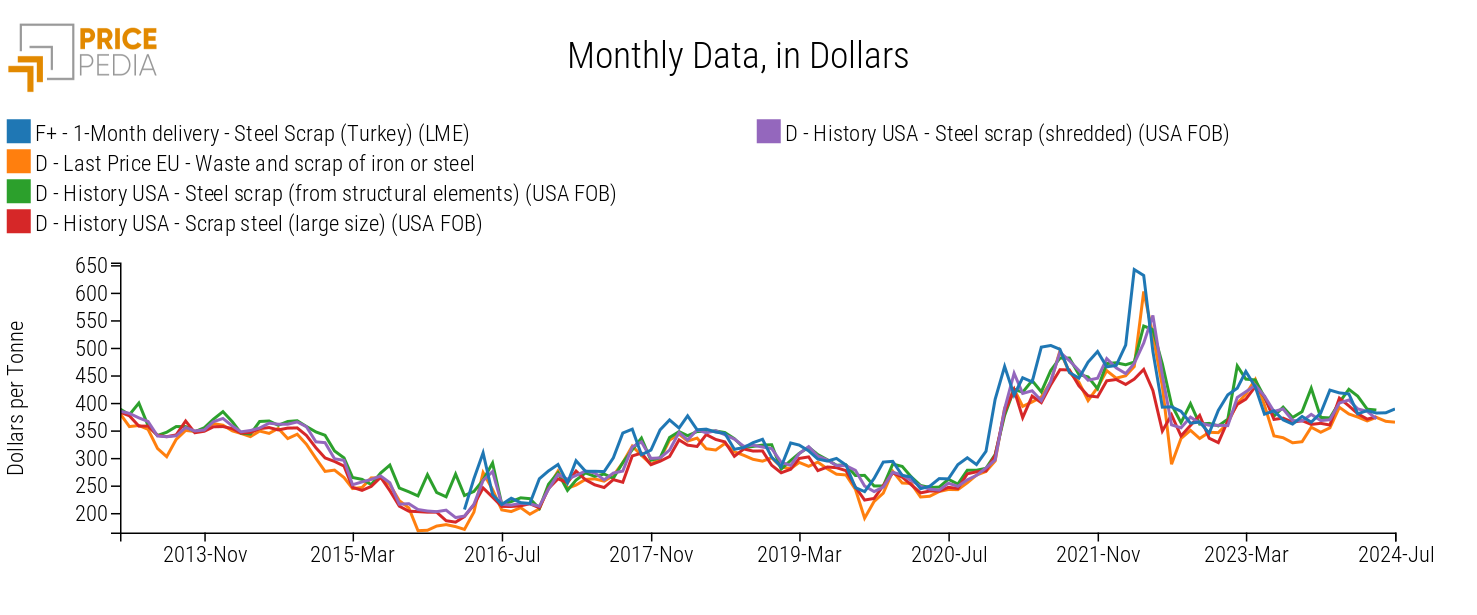
The customs market prices in Europe and the United States are strongly aligned with each other and tend to follow the financial benchmark of Turkish LME iron scrap.
The following table compares the annual average financial prices of scrap with the regional prices of the EU and USA.
Average Annual Prices of Iron Scrap, in Dollars per Ton
| 2019 | 2020 | 2021 | 2022 | 2023 | 2024 | |
|---|---|---|---|---|---|---|
| F+-1-Month Delivery-Steel Scrap Turkey (LME) | 288 | 287 | 466 | 447 | 397 | 394 |
| H-Last Price EU-Steel Scrap | 262 | 255 | 428 | 410 | 367 | 378 |
| H-Historical USA-Steel Scrap (Structural Elements) (USA FOB) | 284 | 270 | 441 | 433 | 402 | 403 |
| H-Historical USA-Steel Scrap (Large Sizes) (USA FOB) | 268 | 260 | 420 | 389 | 381 | 386 |
| H-Historical USA-Steel Scrap (Shredded) (USA FOB) | 283 | 262 | 443 | 423 | 388 | 390 |
The data in the table shows a strong similarity between the prices in the European market and the USA market. An interesting aspect that distinguishes US prices from European ones is the categorization of scrap prices in the United States. In the USA, prices are differentiated between structural steel scrap, large steel scrap, and shredded steel scrap.
The three types of scrap, while having very similar prices, show slight differences in levels primarily due to the quality of the scrap. For example, the prices of structural steel scrap have been, on average, the highest over the past five years, thanks to the higher quality resulting from a higher steel content and lower presence of impurities. Conversely, the prices of large steel scrap have generally been lower, as they require additional processing, such as crushing, before being used in metallurgical processes.
Coal Price Analysis
A third particularly relevant input for the steel industry is coking coal, which is used as fuel and reducing agent in metallurgical processes.
The financial price of coking coal is quoted on the Dalian Commodity Exchange (DCE) and is significantly different from the financial prices of other types of coal, such as thermal coal.
The demand for coking coal is closely tied to steel production, whereas the demand for thermal coal is dependent on energy consumption, which can be influenced by seasonal factors and the availability of alternative energy sources (such as natural gas, nuclear energy, and renewables).
These differences can lead to different price dynamics between the financial prices of coking coal and those of thermal coal.
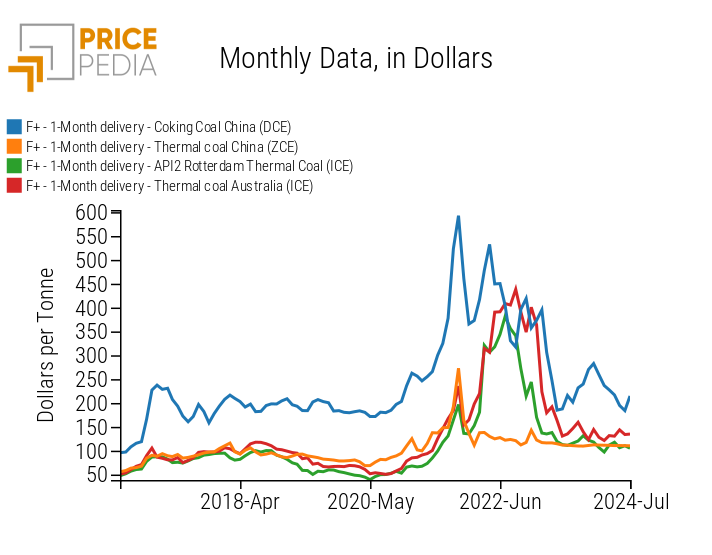
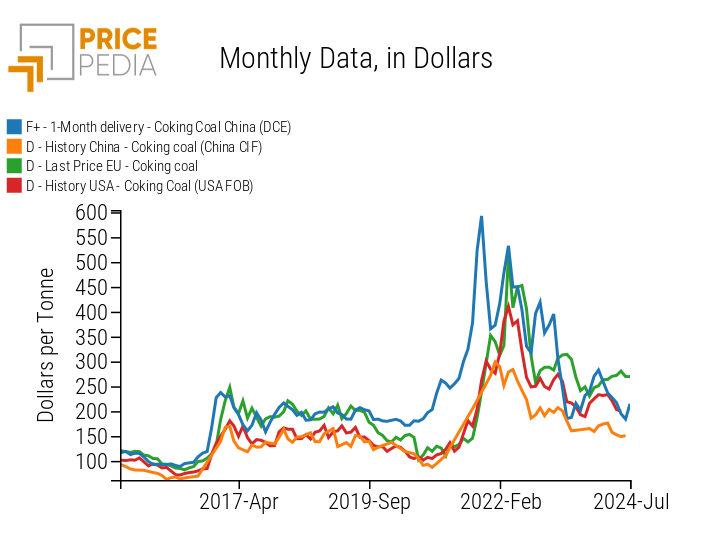
Below are two charts: the first compares the financial prices of coking coal with the financial prices of thermal coal, and the second compares the financial price of coking coal with those in the customs markets of Europe, the United States, and China.
| Comparison of Coal Financial Prices | Comparison of Coking Coal Prices |
|
|
The left graph illustrates the difference between the financial prices of coking coal and the financial prices of thermal coal, both in terms of price levels and dynamics. Furthermore, an additional distinction between Chinese financial prices of thermal coal and European and Australian financial prices emerges, especially following the war in Ukraine.
The right graph indicates that the financial prices of coking coal do not seem to drive the prices in the physical markets.
The following table compares the financial price of coking coal with the respective physical prices in the EU, USA, and China.
Average Annual Prices of Coking Coal, in Dollars per Ton
| 2019 | 2020 | 2021 | 2022 | 2023 | 2024 | |
|---|---|---|---|---|---|---|
| F+-One Month Delivery-Coking Coal China (DCE) | 194 | 188 | 350 | 409 | 258 | 219 |
| D-Historical China-Coking Coal (China CIF) | 138 | 112 | 183 | 242 | 178 | 162 |
| D-Last Price EU-Coking Coal | 188 | 134 | 178 | 363 | 275 | 268 |
| D-Historical USA-Coking Coal (USA FOB) | 150 | 114 | 182 | 312 | 228 | 218 |
The Chinese customs prices of coking coal are generally lower than the other types of prices reported in the table.
In particular, China appears to show a cost advantage over the European Union, as it manages to import coking coal at a significantly lower price. The United States also registers an advantage over Europe. Indeed, they are significant producers of coking coal, so much so that they can also export it.
Conclusions
From the analysis of the prices of various steel industry inputs, it emerged that the customs prices of iron ore and scrap confirm the existence of a single global market and tend to follow the prices present in the financial markets. This aspect, however, does not seem to apply to coking coal, whose customs prices appear to move independently from the financial prices from the DCE.
Analyzing regional prices, a cost advantage was found for China in both agglomerated iron ore and coking coal.
The United States is at a cost disadvantage for the production of agglomerated iron ore, while Europe is characterized by generally higher costs for both iron ore and coking coal.
Based on this analysis, lower average Chinese steel prices compared to European and American prices seem justified. Conversely, the higher prices of American steel products compared to European ones do not seem justified.
