Understanding procurement markets: the cluster approach
The price dynamics of the last five years can be grouped into five clusters
Published by Giuseppe Pierri. .
Range Analysis tools and methodologiesKnowledge and Clustering Approach in Markets
Humans have developed many techniques to make the process of understanding complex phenomena more efficient. One of the main techniques is generalization. In this context, a particular role is played by the clustering approach. This method is particularly useful when the goal is to understand and analyze a multitude of seemingly distinct cases.
The clustering approach does not imply neglecting the knowledge of the individual case (in the specific case of this article, the market), but rather achieving this knowledge through two steps:
- Definition and understanding of the cluster;
- In-depth study of the individual market, examining the differences from its belonging cluster.
The clustering approach is particularly suitable for the development of markets monitored by PricePedia, considering the wide range of nearly 1000 products present on the platform.
Improving the understanding of markets through this method allows effective management of complexity and obtaining detailed and accurate knowledge of both the cluster and the individual market.
Identification of Clusters in Purchasing Materials Markets
Following the idea presented by Pasquale Marzano in Industrial Commodity Prices: A Year of Flat Calm, the dynamics of EU customs prices present in PricePedia were examined, grouping them based on the following parameters related to price trends from 2019 to today:
- Peak in the 2021-2022 biennium / 2019 Average
- Average of the first half of 2024 / 2019 Average
- Average of the first half of 2024 / 2022 Average
The analysis produced 5 clusters.

The trend of the average prices of the 5 clusters over time is shown in the two graphs below.[1]
On the left, the graphs of the clusters characterized by a growth phase in the 2021/22 biennium followed by a reduction phase, albeit with different intensities, are presented.
On the right, the graphs of the clusters characterized by the absence of a significant reduction phase after 2022 are shown.
If we analyze the products belonging to the three clusters on the left, we can observe that they are characterized by a low degree of differentiation[1]; conversely, those belonging to the two clusters on the right are characterized by a relatively high degree of differentiation. We can therefore identify the clusters on the left as low differentiation products and those on the right as partially differentiated products.
Average Price Trends of Goods by Cluster
| Cluster of Highly Differentiated Goods | Cluster of Partially Differentiated Goods |

|

|
To confirm the correct identification of the two types of products, we present below the median of the price dispersion for each cluster.
Median Price Dispersion for Clusters 1, 2, and 3: Low Differentiation Products
- Cluster 1: 18.9
- Cluster 2: 15.5
- Cluster 3: 20.3
Median Price Dispersion for Clusters 4 and 5: Partially Differentiated Products
- Cluster 4: 31.4
- Cluster 5: 30.6
As expected, the "low differentiation products" clusters show significantly lower price dispersion compared to the "partially differentiated products" clusters.
However, it is important to highlight the existence of heterogeneity in the products, which represents an additional component of price dispersion within each cluster.
Clusters and Product Families
To evaluate the usefulness of cluster analysis, we cross-referenced information regarding macro-families of products with the two groups of identified clusters. For each family, we calculated the ratio of the number of products in the macro-family that belong to the clusters of the second group to the total number of products in the same macro-family. This ratio serves as an indicator of the degree of differentiation of the family.
Table of Differentiation Indices for Product Families
| Product Families | Degree of differentiation |
|---|---|
| Ferrous Metals | 3.1 |
| Energy | 6.3 |
| Plastics and Elastomers | 7.7 |
| Organic Chemicals | 8.2 |
| Wood and Paper | 16.1 |
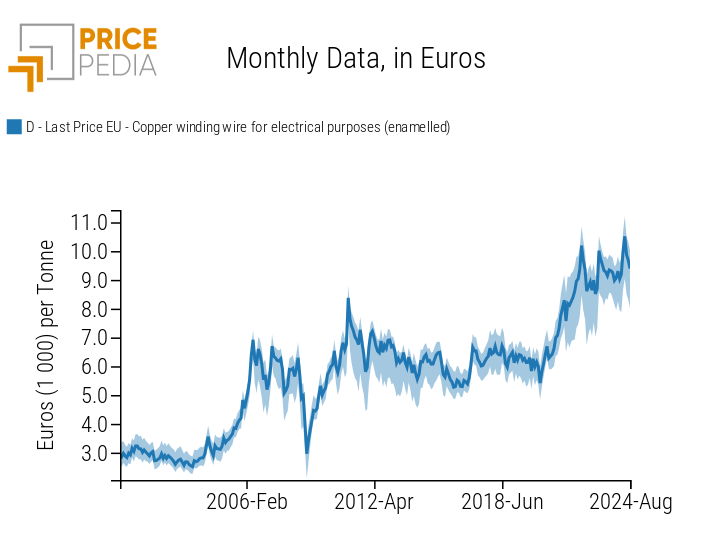
| Non Ferrous Metals | 28.4 |
| Specialty Chemicals | 33.3 |
| Electronic Components | 35.3 |
| Inorganic Chemicals | 36.7 |
| Textile Fibers | 40.5 |
| Food | 45.9 |
| Precious Metals | 50.0 |
| Construction Raw Materials | 60.0 |
| Commercials Products | 69.2 |
| Mechanical Components | 73.7 |
| Electric Components | 76.9 |
The ordering of the product families appears very reasonable. However, upon deeper analysis, it emerges that the degree of differentiation is particularly high for the macro-families of precious materials and, to a lesser extent, for those of inorganic chemicals and non-ferrous metals. For the macro-families of precious materials and non-ferrous metals, this high degree of differentiation can be attributed to the influence of financial market prices, which significantly impact the prices of physical markets.
Conclusions
The clustering approach proves to be an effective method for analyzing and understanding the dynamics of purchasing material markets. Segmenting markets into clusters allows for clear distinctions between low differentiation products and partially differentiated products, highlighting the peculiarities of each group while also considering the interaction of other variables at play, such as heterogeneity. The analysis of prices over the last five years confirms the validity of this method.
Considering the macro-families of products and their differentiation characteristics further enriches the analysis, providing useful information to deepen the understanding of each cluster's characteristics.
The analysis contained in this article represents only the first part of the project to develop knowledge of purchasing material markets through the identification of clusters. The next steps of the project will be to study the determinants underlying the price dynamics of the five identified clusters. Why did some prices record high growth rates in the 2021-2022 biennium, while others showed smaller variations? Why did a phase of growth follow, in some cases, by a more or less intense phase of decline? What are the determinants?
The further step will be to investigate the characteristics that lead a product to be placed in one cluster or another, so that the knowledge of the dynamics and determinants of the cluster can be usefully employed to understand the characteristics of the markets of individual products.
[1] In detail, the graphs show the trend of indexed average prices compared to the average price of the cluster's goods in the year 2019;
[2] See the article: "Properties of Commodity Markets and Price Variability";
[3] The median, compared to the average, is less influenced by extreme values in the price distribution within each cluster, making it a more robust index.
You may be interested in:

Summary measures of commodity financial markets
Published by Luca Sazzini. .
Range Analysis tools and methodologiesHow to extract cross-signals to commodity financial price dynamics [ Read all ]
The price transmission mechanism: how much does market structure matter?
Published by Manuela Agosta. .
Strumenti Competitive Markets Copper Range Sticky prices Analysis tools and methodologiesMarket structure is relevant in explaining how increases in production costs result in increases in the final price [ Read all ]
Properties of Commodity Markets and Price Variability
Published by Manuela Agosta. .
Competitive Markets Range Sticky prices Analysis tools and methodologiesThe price elasticity to changes in demand increases as the degree of differentiation of the good increases [ Read all ]