PricePedia Scenario for August 2024
Stagnation in commodity demand and diversified price dynamics
Published by Pasquale Marzano. .
Forecast ForecastThe PricePedia Scenario has been updated with the information available as of August 2, 2024, and is characterized by a situation of stagnation in global commodity demand due to intensifying geopolitical tensions and a slight contraction in China's manufacturing sector, documented by the manufacturing PMI falling below the threshold of 50. This contraction adds to the difficulties that the European industry is facing since more than 18 months.
In the PricePedia scenario, this stagnation is reflected in the dynamics of the global industrial cycle[1] shown in the following chart.

On the annual average for 2024, the industrial cycle is flat, with levels virtually identical to those recorded in 2023. In the second half of the year, an industrial cycle recovery is expected in relation to the future progressive easing of monetary policies in Europe and the USA.
A more significant growth is anticipated in 2025, with an expected increase in the index of +1.5% compared to the average values of the previous year. This dynamic is expected to continue throughout 2026.
Do you want to stay up-to-date on commodity market trends?
Sign up for PricePedia newsletter: it's free!
Commodity Price Forecast
Below is a table illustrating the annual price changes of the main commodity aggregates (Industrials[2], Commodity[3], Energy, and Food).
| 2023 | 2024 | 2025 | |
|---|---|---|---|
| I-PricePedia Scenario-Commodity Index (Europe) (2-08-2024 Info) | −18.48 | −3.30 | −1.12 |
| I-PricePedia Scenario-Industrials Index (Europe) (2-08-2024 Info) | −13.89 | −3.66 | +2.28 |
| I-PricePedia Scenario-Energy Total Index (Europe) (2-08-2024 Info) | −23.91 | −3.50 | −3.31 |
| I-PricePedia Scenario-Food Total Index (Europe) (2-08-2024 Info) | −4.58 | +0.59 | −0.95 |
The weak demand situation leads to a forecasted reduction in the Commodity index in 2024, with a decrease of -3.3% compared to 2023 values. Except for Food, which shows a slight increase in 2024, price reductions are expected to affect both Industrial and Energy commodities. However, the dynamics of the two aggregates over the next 24 months appear different, with the former recovering in 2025, in line with the increasing trend of the global industrial cycle, and the latter continuing the reduction path started in 2023.
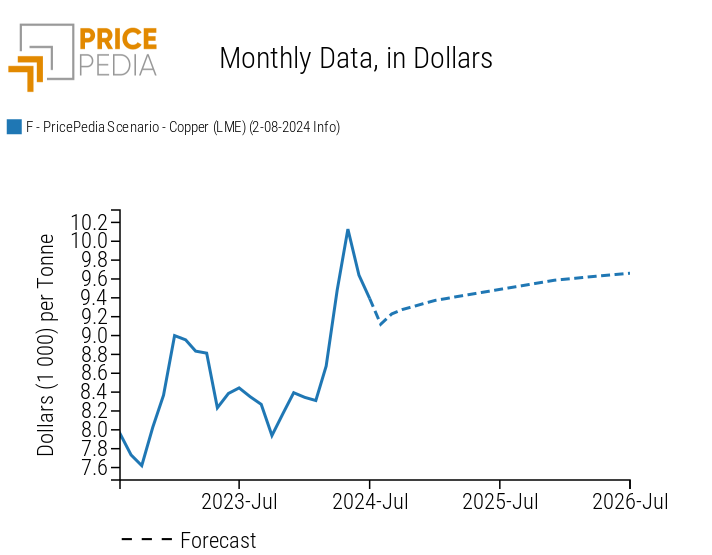
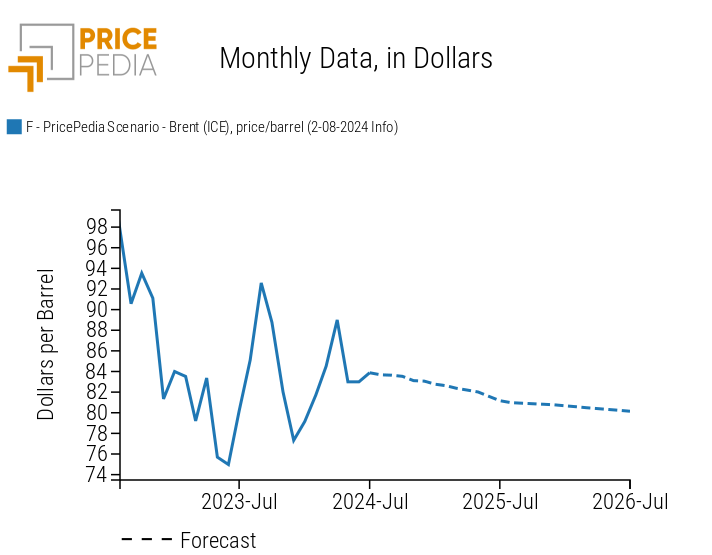
In the following charts, the prices of two products, copper and oil, are shown, representing the dynamics of Industrial and Energy commodities, respectively.
Copper Scenario
Oil Scenario
The price of copper, representing the dynamics of Industrial commodities, is expected to increase over the next two years, following the adjustment that occurred in recent months. The forecasted price increases are supported by the rising demand for copper to be used in the energy transition. By the end of the forecast period, prices are expected to settle just below 9700 US dollars per ton.
Regarding the price of oil, representing the dynamics of Energy commodities, a downward trend is expected. However, geopolitical tensions and effective supply control policies by OPEC counterbalance the current low demand, and thus the descending trend is expected to be rather gradual, keeping oil prices around $80 per barrel.
1. The global industrial cycle index is constructed by purifying the actual dynamics of industrial production from its trend. Since the supply of commodities tends to vary according to long-term economic growth expectations, while the demand for commodities is more linked to actual cyclical uses, the global industrial cycle index tends to reproduce the conditions of tension between demand and supply on the commodity market: when it increases, it means that the demand for commodities increases more than the supply; vice versa when it decreases.
2. The PricePedia Industrials index results from the aggregation of the indices relating to the following product categories: Ferrous, Non-Ferrous, Wood and Paper, Chemicals: Specialty, Organic Chemicals, Inorganic Chemicals, Plastics and Elastomers and Textile Fibres.
3. The PricePedia Commodity index results from the aggregation of the indices relating to industrial, food and energy commodities. Pasquale Marzano
Economist and data scientist. At PricePedia he deals with the analysis of commodity markets, forecasting models for raw material prices and management of reference databases.
You may be interested in:

PricePedia Scenario for March 2026
Published by Pasquale Marzano. .
Forecast ForecastCommodity Prices: how the 2026-2027 forecast is changing in response to the energy shock [ Read all ]

PricePedia scenario for steel tube prices
Published by Luca Sazzini. .
Ferrous Metals Forecast Steel tubes ForecastWhen will steel tube prices reverse their current downward trend? [ Read all ]

Raw material costs and prices in the furniture industry
Published by Pasquale Marzano. .
Forecast Analysis tools and methodologiesAfter the 2021-2022 surge, raw materials have reduced their impact on the sector. What should procurement expect in 2026-2027? [ Read all ]