Commodity prices in equilibrium between low demand and supply restriction
Expectations of lower interest rates support metal prices
Published by Luigi Bidoia. .
Conjunctural Indicators Commodities Financial WeekWeekly Summary of Financial Commodity Prices
This week, commodity markets generally experienced widespread weakness, with the price of oil dropping significantly below $80 per barrel.
The weakness in financial commodity markets is linked to growing concerns about a global economic slowdown, driven by the two largest world economies: the United States and China. In the United States, disappointing July labor market data, including substantial downward revisions to previous months, have fueled fears that the U.S. economy is less resilient than hoped. In China, weaker-than-expected Q2 GDP growth data confirmed a loss of momentum in the world's largest consumer of commodities. Additionally, markets noted that Beijing did not use either the "Third Plenum" conference in mid-July or the subsequent Politburo meeting to revitalize the economy with new stimulus measures.
Concerns about the U.S. and Chinese economies have added to those regarding the European industry, which is being hit by significant reductions in activity levels.
The Exception of Aluminum and Zinc
The prices of aluminum and zinc were two significant exceptions, closing the week at €2,500 and €2,850 per ton, respectively, nearly recovering from the decline seen in July. The support for these prices stems from news of potential supply reductions. As for aluminum, markets reacted to the news of the closure of two major production plants in Switzerland due to the torrential rains that hit the country in the first weeks of July and the partial overflow of the Rhône River.
Potential zinc supply shortages, on the other hand, are linked to Asia, particularly China, which produces nearly half of the world's refined zinc. The rise in zinc ore prices throughout 2024 has squeezed refinery margins, leading major Chinese refineries to plan maintenance and suspend capacity expansion projects. The effects have already been seen with a sharp reduction in SHFE warehouse stocks.
Both prices, along with those of metals in general, also reflected growing expectations for the start of a global interest rate reduction phase beginning in September, as confirmed by recent statements from Fed Chairman Powell. In his speech at the Fed's annual conference in Kansas City at Jackson Hole, Wyoming, Powell stated that the time has come to lower interest rates as inflation risks have diminished while unemployment risks have increased. Markets are almost certain of an initial rate cut at the next Fed meeting on September 18. The uncertainty now lies in the magnitude of the cut, which could be 50 basis points if upcoming U.S. labor market data confirms the worrying picture recently emerging.
The Exception of Gold
Another notable exception to the downward trend in commodity prices is the price of gold, which this week fluctuated around $2,500 per troy ounce (equivalent to just over $80 per gram). Considering that before the pandemic, the price of gold barely exceeded $1,500 per troy ounce, it is evident how gold has become a significant safe haven in recent years.
ENERGY
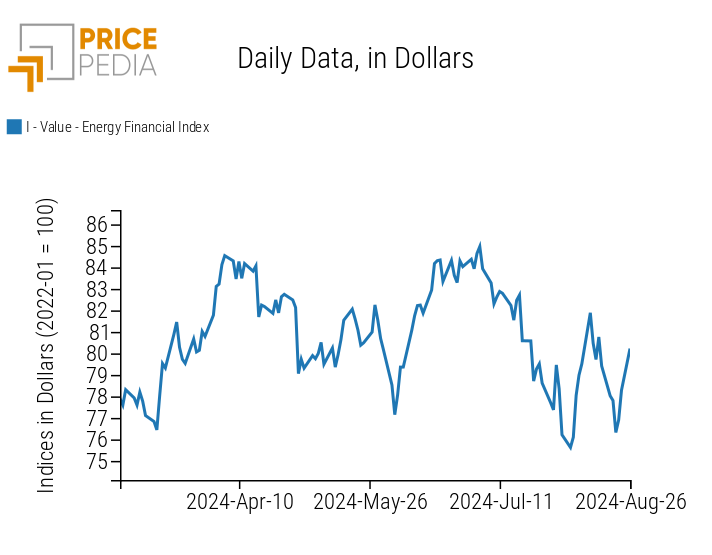
The phase of declining global energy prices continued in the early days of this week, driven by hopes for a truce in the ongoing Israeli-Palestinian conflict and the confirmation that Ukraine's occupation and control of the Sudzha gas station in Russia's Kursk region will not disrupt Russian gas supplies to Europe passing through that station.
The last days of the week saw some adjustments, particularly in the price of oil, amid speculation that OPEC+ might extend current supply restrictions.
PricePedia Financial Index of Energy Prices in Dollars
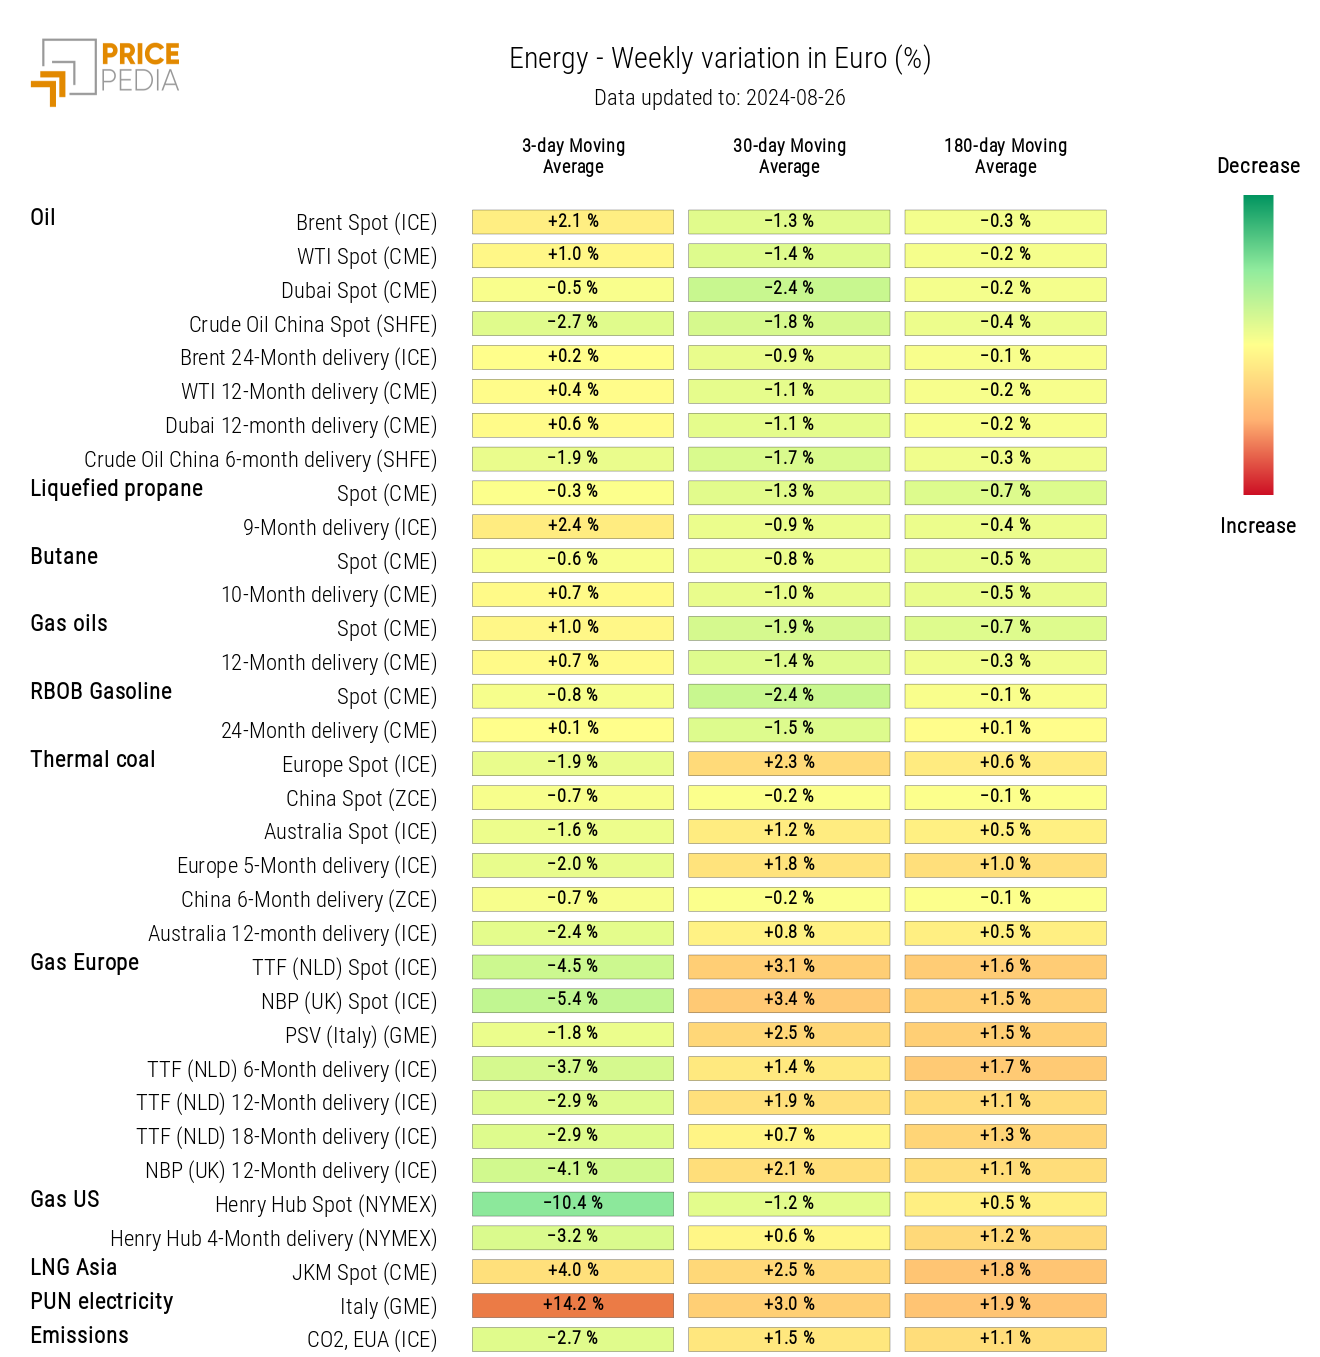
The heatmap below highlights a drop in European natural gas prices and the recovery in oil prices in recent days, which erased the decline recorded earlier in the week.
HeatMap of Energy Prices in Euros
PLASTICS
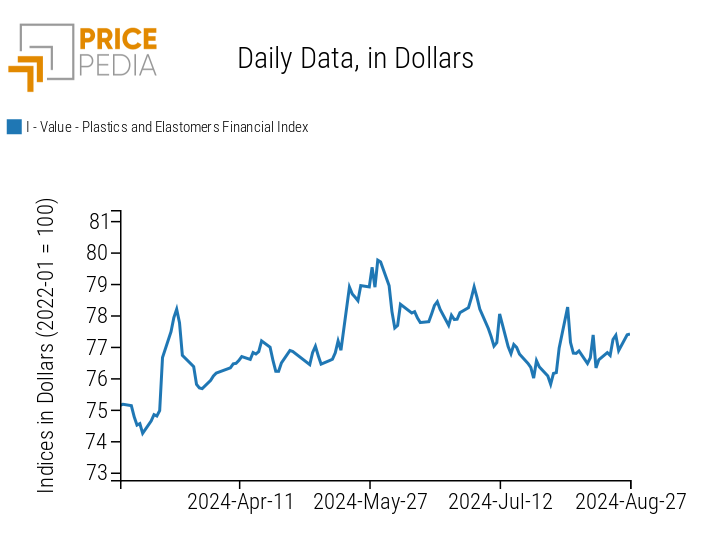
The PricePedia index of financial prices for plastics quoted in China moved sideways this week, interrupting the slight downward trend seen in July and the first part of August.
PricePedia Financial Index of Plastic Prices in Dollars
FERROUS
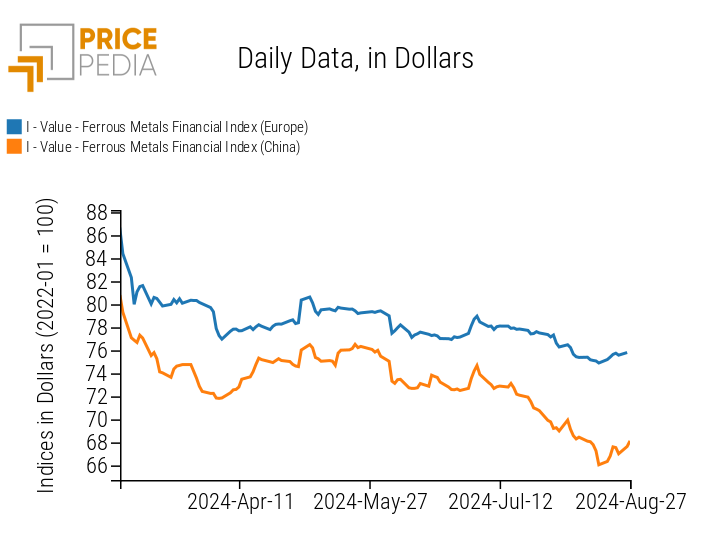
The financial index of ferrous commodity prices interrupted the negative trend that had characterized it for over two months. The price dynamics in the coming weeks will tell us whether this is the start of a new equilibrium period or a temporary interruption of the global steel industry's difficult phase.
PricePedia Financial Index of Ferrous Metal Prices in Dollars
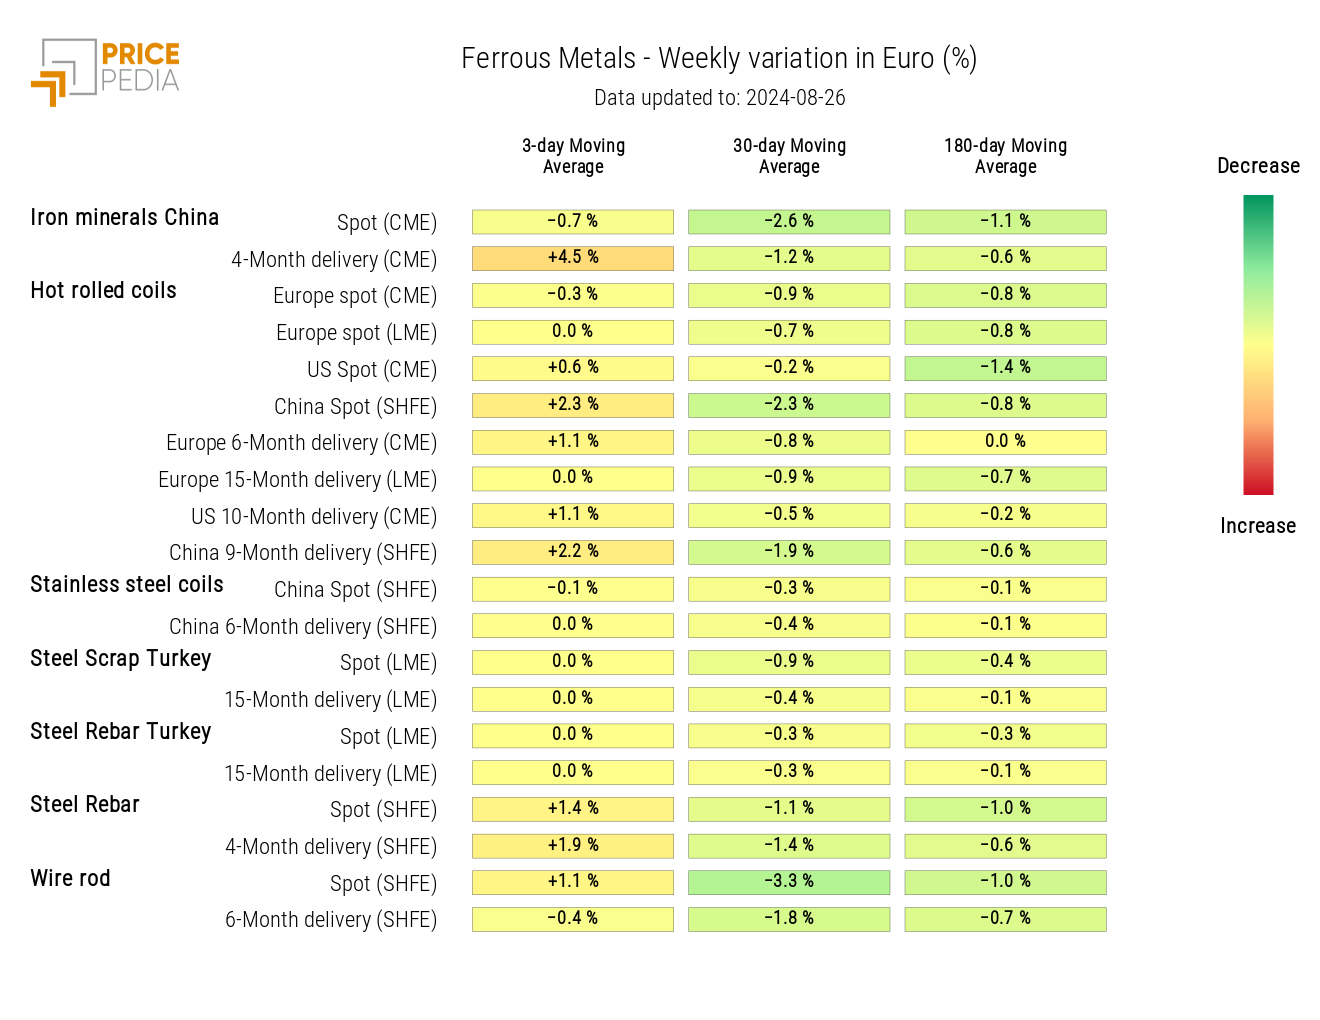
The following heatmap highlights general stability in ferrous metal prices.
HeatMap of Ferrous Metal Prices in Euros
Do you want to stay up-to-date on commodity market trends?
Sign up for PricePedia newsletter: it's free!
INDUSTRIAL NON-FERROUS
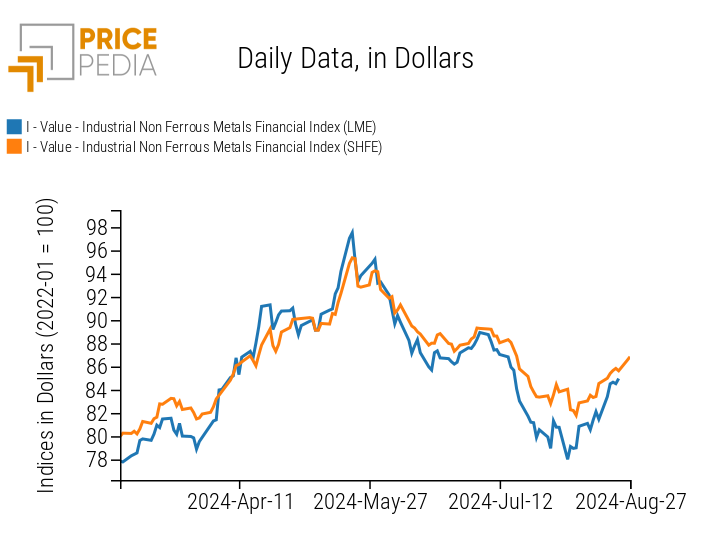
As indicated by the PricePedia index of financial prices for non-ferrous metals, the phase of price increases in non-ferrous metals continued this week, though it remains brief for now. This week's reasons again involve potential temporary supply shortages, as illustrated above.
The prospects of a near-term global interest rate reduction phase were added as an additional supporting factor for prices in the last days of the week.
PricePedia Financial Index of Industrial Non-Ferrous Metal Prices in Dollars
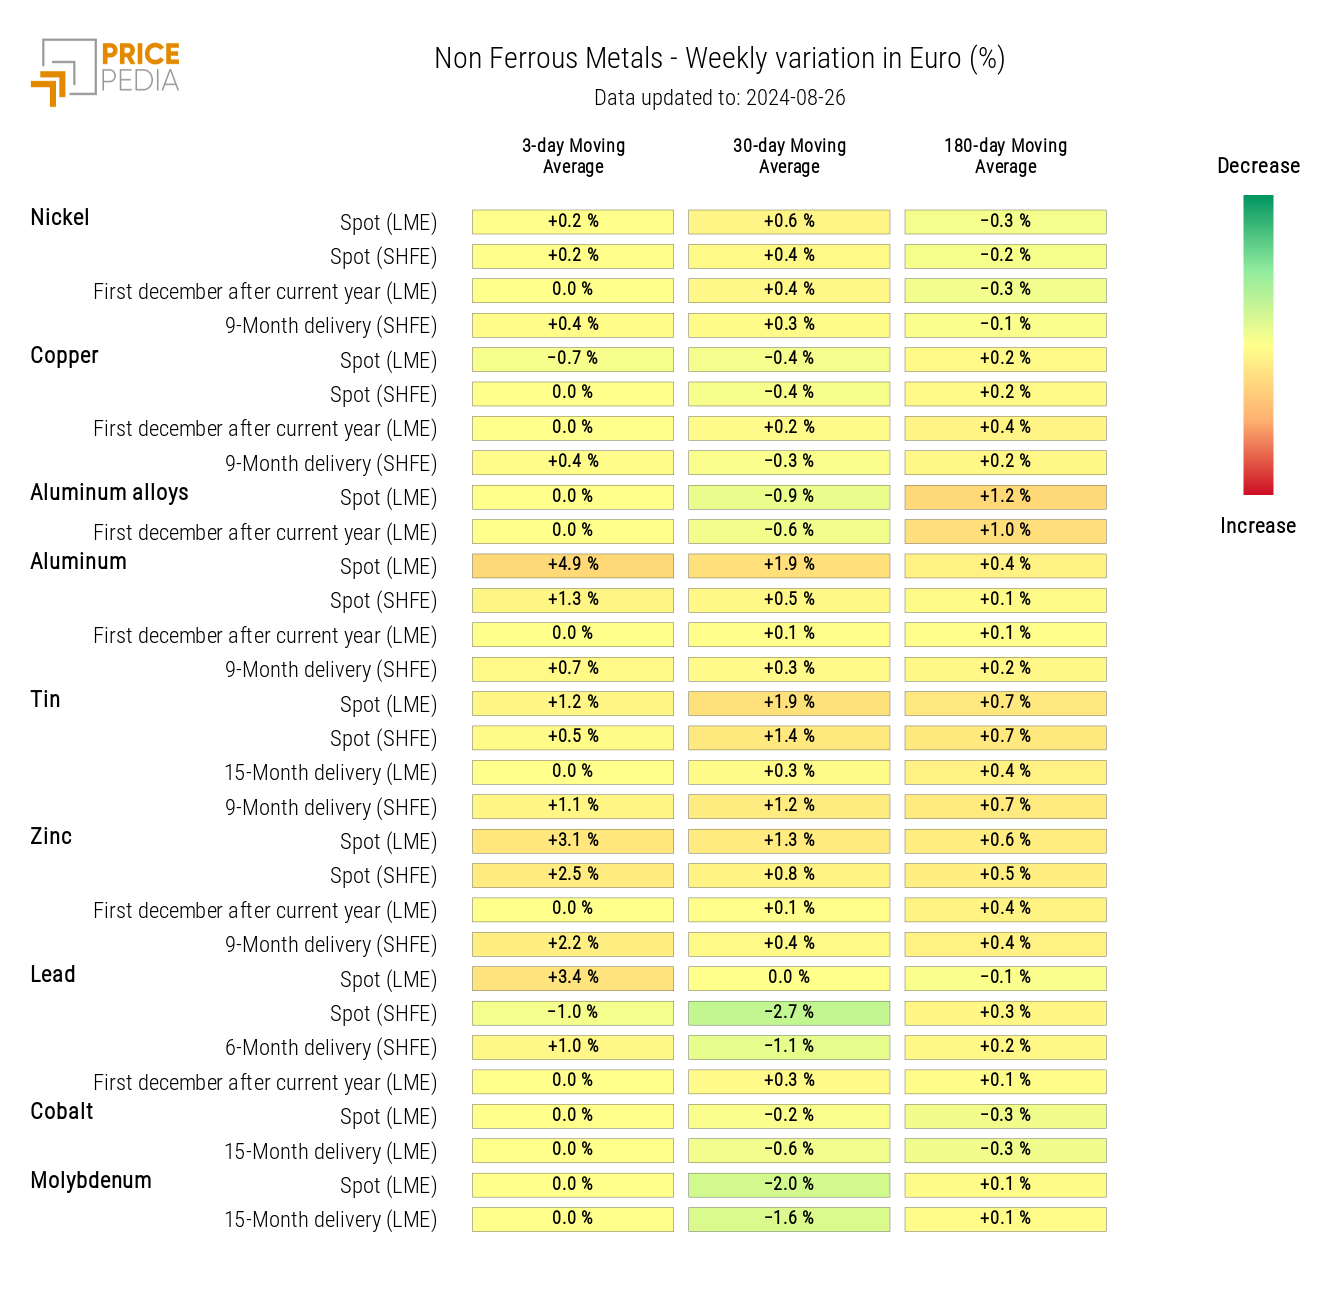
The heatmap below highlights areas with the most significant increases in aluminum, zinc, and lead prices.
HeatMap of Non-Ferrous Metal Prices in Euros
FOOD
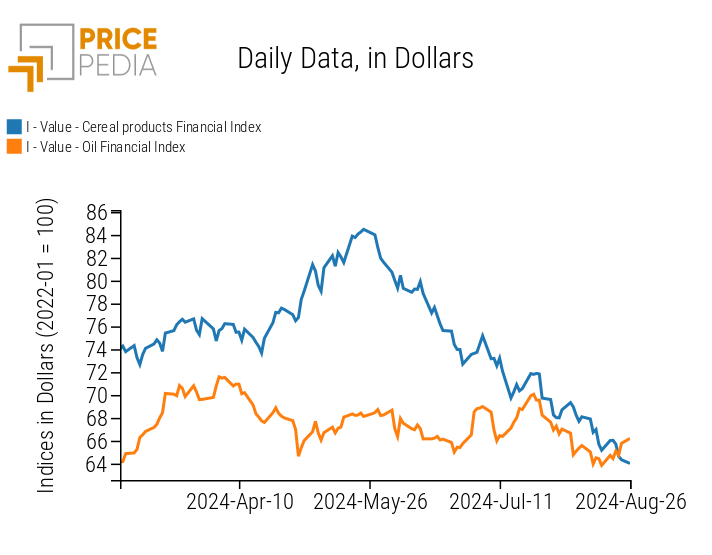
While the phase of declining financial grain prices continues uninterrupted, there were signals this week of a possible trend reversal for the oil price index.
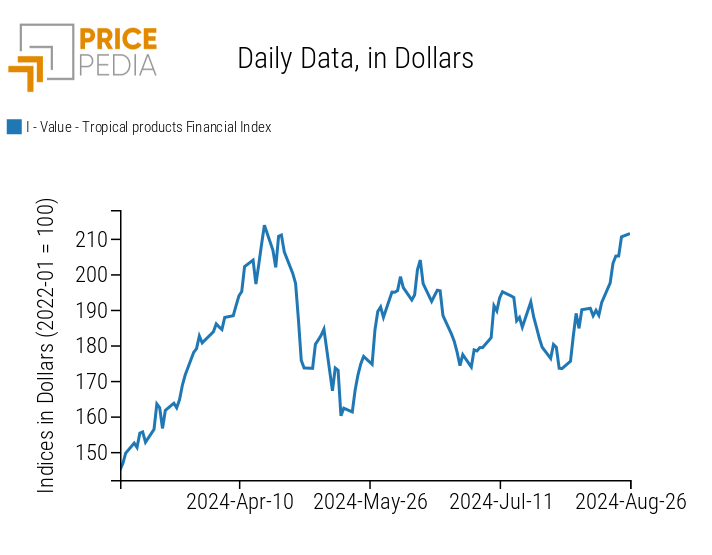
More consistent and prolonged is the current phase of growth in the PricePedia financial index of tropical product prices.
| PricePedia Financial Indices of Food Prices in Dollars | |
| Cereals and Oils | Tropicals |
|
|
CEREALS
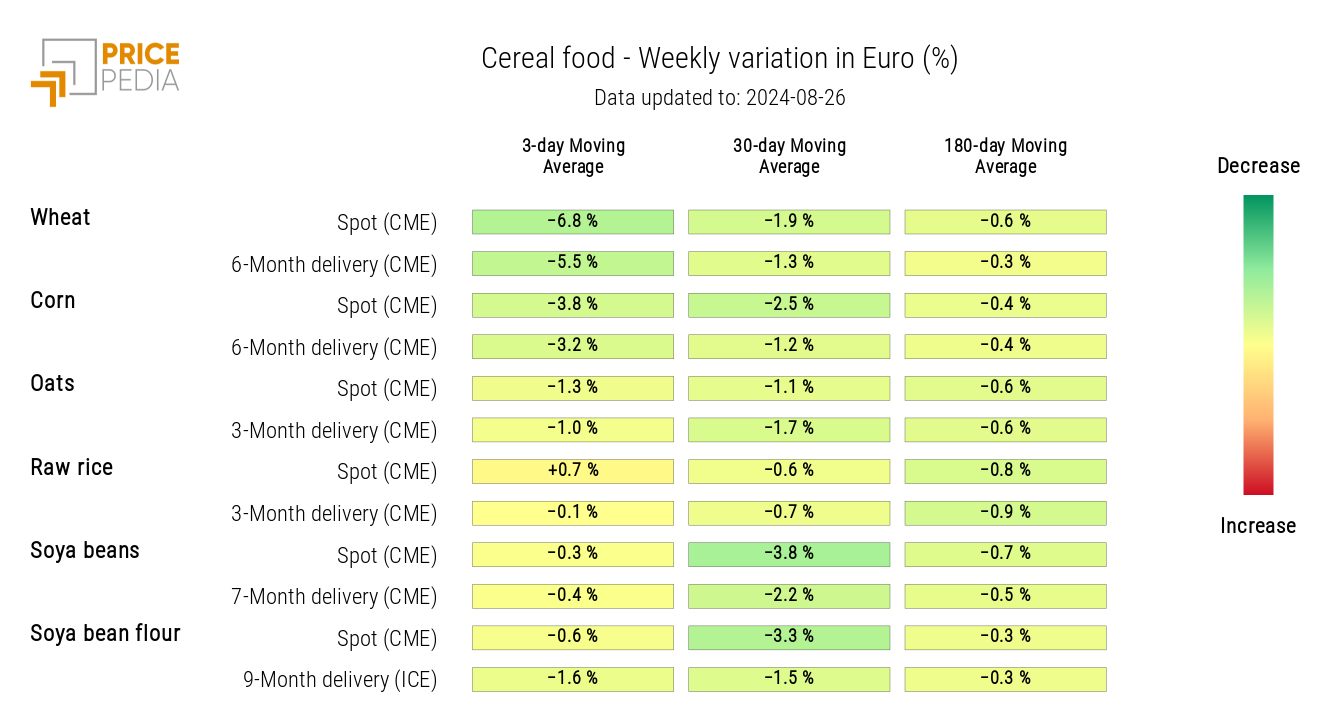
The heatmap below indicates that the current phase of decline involves the prices of all cereals, with a notable decrease in wheat prices over the past week.
HeatMap of Cereal Prices in Euros
OILS
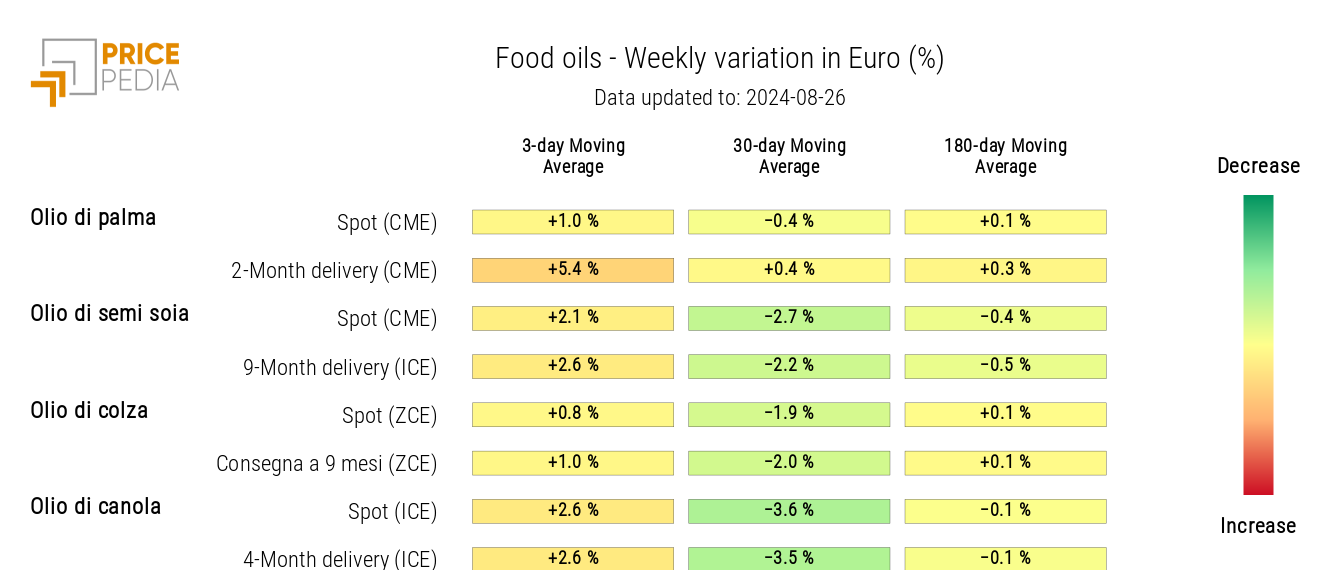
The heatmap for oil prices shows that all prices have moved slightly upwards over the last week.
HeatMap of Food Oil Prices in Euros
TROPICALS
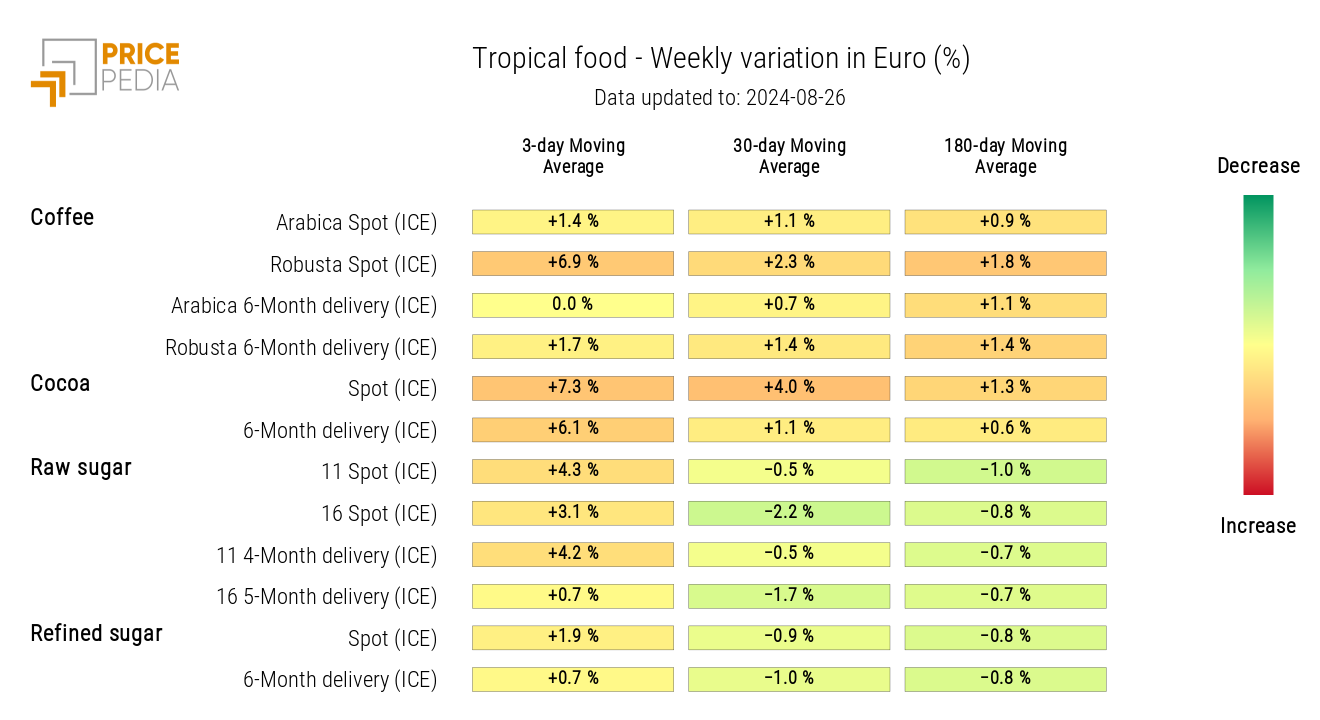
The heatmap of tropical food prices this week highlights a particularly significant increase in the prices of cocoa and robusta coffee.
The exceptional price of cocoa has undoubtedly been the most significant factor in the tropical food market throughout 2024. Equally exceptional is the current phase of price growth for robusta coffee, which has surpassed $5,000 per ton this week. Considering that in this century the price of robusta coffee had never exceeded $2,500/ton, the exceptionally high price level this week becomes evident. This strong increase has brought the price of robusta coffee closer to that of arabica coffee, calling into question a traditionally structural factor in the coffee market, where arabica has always been priced significantly higher than robusta.
HeatMap of Tropical Food Prices in Euros
