Increasingly uncertain commodity price dynamics
The cost of shipping is falling again
Published by Luca Sazzini. .
Conjunctural Indicators Commodities Financial WeekWeekly Summary of Commodity Financial Prices
This week, the financial prices of commodities were marked by some movements contrary to their market trends. The greatest volatility, as often happens, was observed in the energy market, with the price of oil experiencing fluctuations due to the political clash between the two governments in Libya.
The conflict began when the president of the Libyan central bank was deposed by the prime minister of the Tripoli government (the internationally recognized western government of Libya) for supporting the rival Benghazi government (the non-internationally recognized eastern government of Libya) more.
However, the forced replacement of the central bank governor was not accepted by the eastern government, which threatened the Tripoli government to halt oil production. These threats subsequently materialized and contributed to the rise in oil prices on Monday. In the following days, despite the continued decline in Libyan oil production, the price of oil fell again only to fluctuate once more, showing high volatility.
In the ferrous metals sector, the negative trend of the past two months was interrupted, with Chinese prices rebounding in the first days of the week and European prices remaining stable.
The non-ferrous markets ended the week with some negative oscillations that oppose their recent price increase trend.
In the food sector, a reversal in the trend of cereals was recorded, with prices rising due to unfavorable weather conditions, and the new upward trend in the oil market, which began last week, was confirmed.
Meanwhile, the growth of tropical commodities continues, reinforced by rising sugar prices due to fires in the growing regions of Brazil and speculative movements.
In this scenario characterized by high uncertainty, it becomes important to know macroeconomic data to have a clearer idea of the next market dynamics of commodities.
Conjunctural Analysis
USA Conjuncture
The new US economic data shows a 3% growth in the second quarter GDP, exceeding expectations, which were estimated at 2.8%.
This growth was driven by an increase in corporate investments and, above all, by consumer spending, which rose by 2.9% y/y, compared to the expected 2.3%.
The data on the inflation rate showed a price increase that remained unchanged from the previous month, contrary to predictions that forecasted a 0.1% increase for both the headline and core indices.
In July, therefore, the PCE and PCE core indices[1] stood at 2.5% and 2.6%, respectively.
This data still shows a persistence of price levels but is nonetheless an improvement compared to analysts' expectations.
EU Conjuncture
In the eurozone, the unemployment rate in July fell to 6.4%, down from 6.5% in the previous month.
The consumer price index CPI indicated a reduction in the inflation rate, which fell to 2.2% in August from 2.6%.
This latest data is compatible with an upcoming rate cut by the ECB, which would accompany the one already announced by the Fed chairman.
Reduction in Shipping Costs
Another indicator that can be useful to monitor in this historical period is the cost of maritime transport, which had seen sharp price increases due to the Red Sea crisis, as ships were forced to circumnavigate Africa to avoid Houthi attacks.
The most widely used index by analysts to assess maritime transport costs is the World Container Index, measured by the Drewry company.
Below is the trend of the index over the last six months.
World Container Index (WCI)
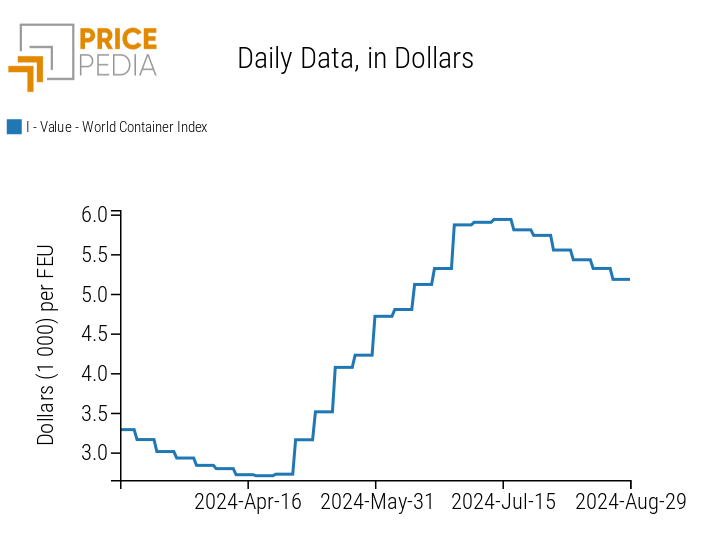
The analysis of the chart shows a clear reduction in international shipping costs in the last month, despite geopolitical tensions remaining high. However, the reduction is limited, especially when compared to the previous growth phase. The overall increase compared to the end of 2023 is still over 200%.
[1] PCE index excluding the most volatile components: energy and food.
ENERGY
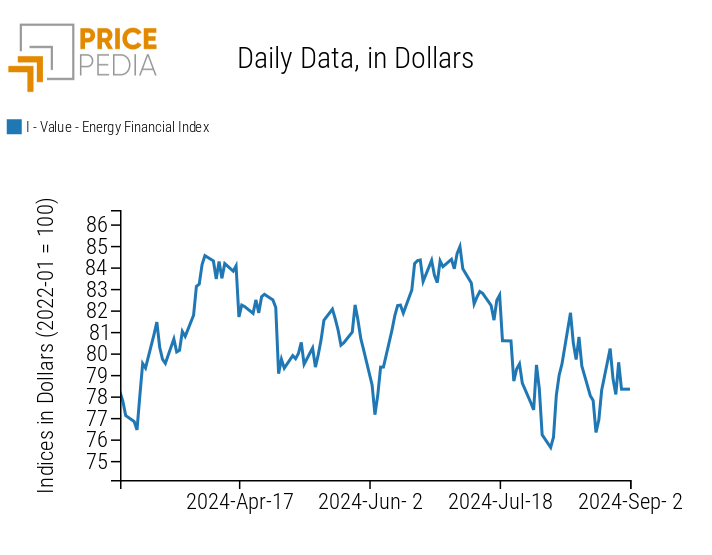
The trend of the PricePedia financial price index reflects the current volatility of oil and natural gas prices, which are mainly influenced by short-term dynamics.
PricePedia Financial Index of Energy Prices in Dollars
The heatmap below highlights an increase in the price of European natural gas due to the reduction in Norwegian gas flows to Europe and the Russian attacks on Ukrainian energy infrastructure, which, although not affecting European flows, have still spooked the gas market, increasing its volatility.
The current major concern is the potential prolongation of maintenance in Norway, which would continue to reduce gas supply to Europe.
HeatMap of Energy Prices in Euro
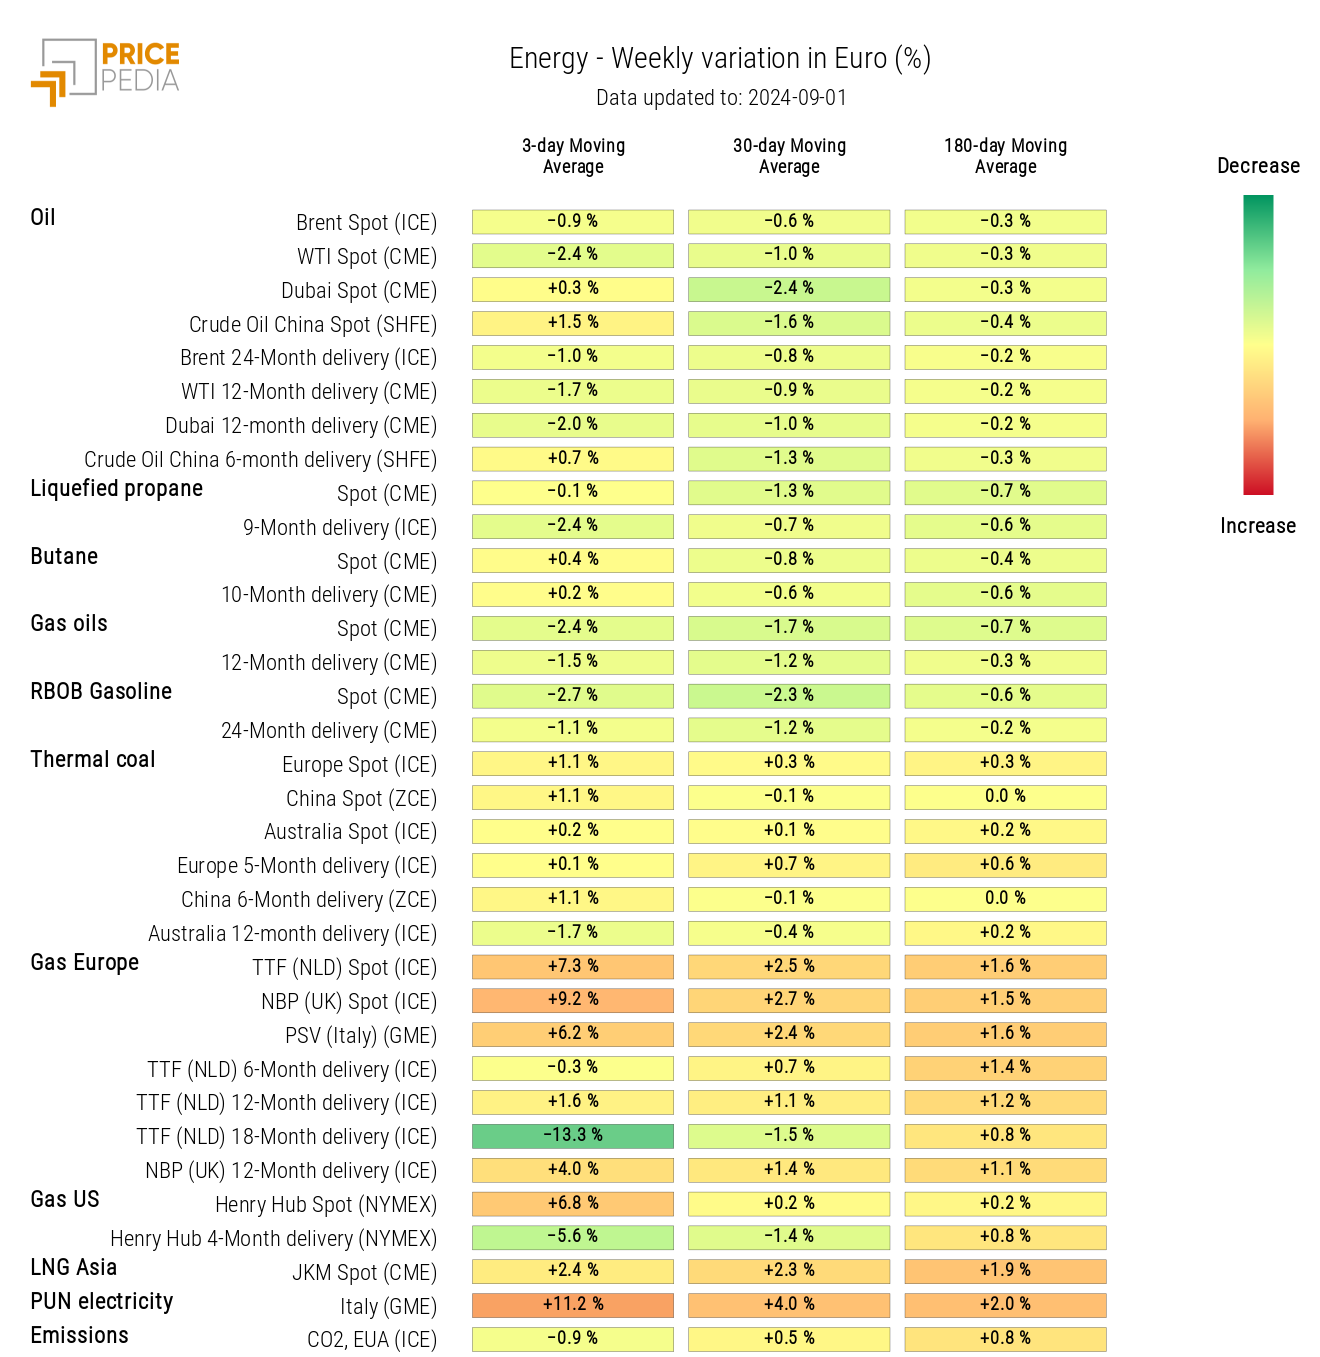
Net of oil price fluctuations, the energy heatmap shows stability in the 3-day moving average.
PLASTICS
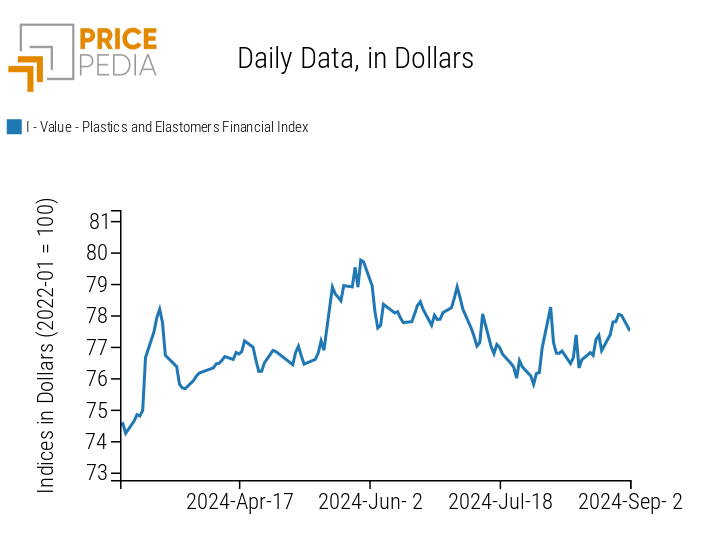
The PricePedia financial index of plastic prices quoted in China showed an increase in prices, which was partially reversed in the early days of September.
PricePedia Financial Index of Plastics Prices in Dollars
FERROUS
The interruption of the negative trend that characterized the ferrous metals market over the past 2 months continues, with the European price index showing mostly lateral movements and the Chinese index signaling a price increase.
PricePedia Financial Index of Ferrous Metals Prices in Dollars
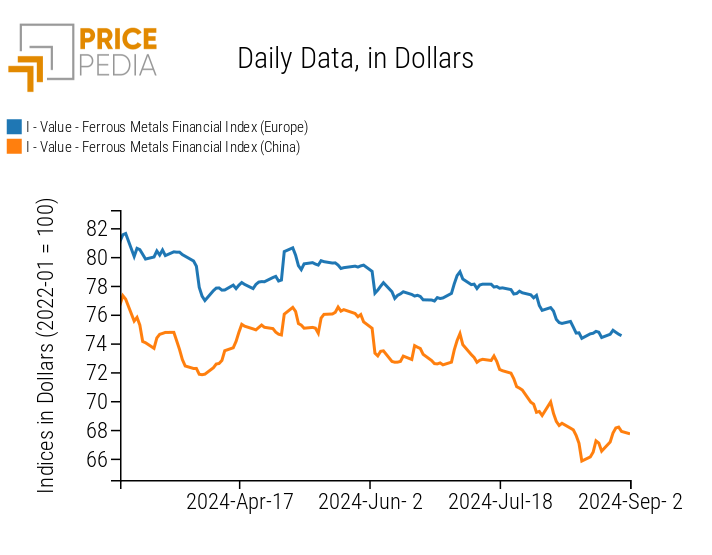
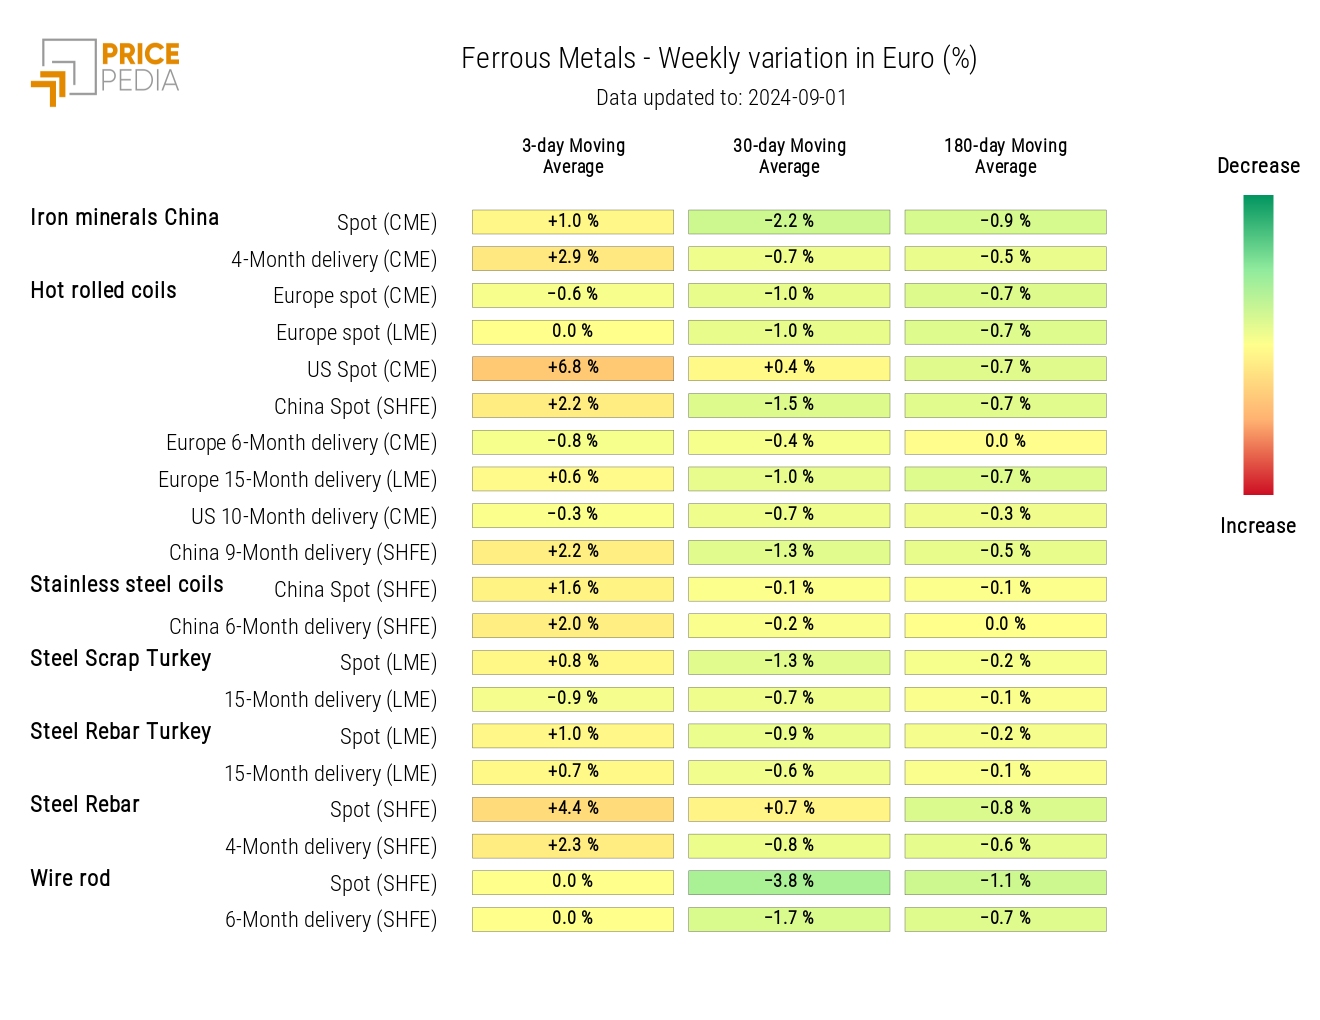
In the Chinese market, the recovery of steel rebar prices continues, and increases in the prices of hot coils and stainless coils are recorded.
HeatMap of Ferrous Prices in Euro
Do you want to stay up-to-date on commodity market trends?
Sign up for PricePedia newsletter: it's free!
NON-FERROUS INDUSTRIAL METALS
This week, the first signs of a slowdown in the recent recovery of non-ferrous metal prices are emerging.
On the financial market of the London Metal Exchange, the price reduction in recent days has been slightly more pronounced compared to the Chinese market of the Shanghai Futures Exchange.
However, with the expectations of an upcoming interest rate cut from both central banks, it is still premature to say that the recovery of the non-ferrous market is already coming to a halt.
PricePedia Financial Indexes of Non-Ferrous Industrial Metal Prices in USD
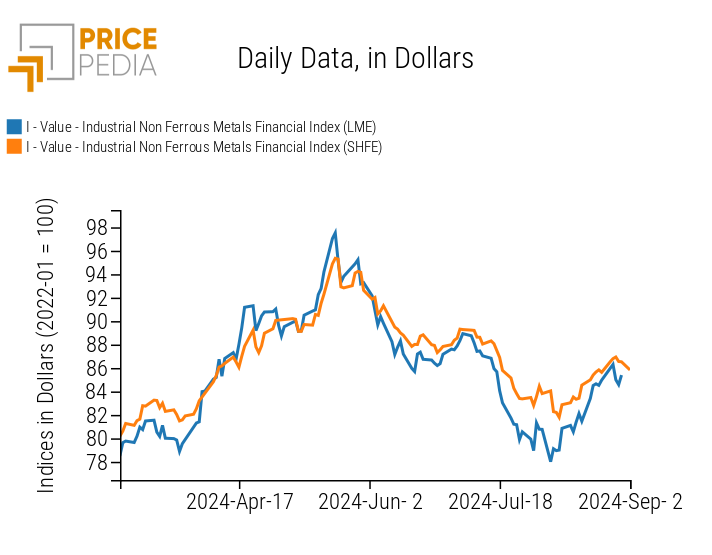
Despite the declines in recent days, the heatmap still highlights slightly positive weekly variations in the 3-day moving averages of most non-ferrous metal prices, with the significant exception of cobalt.
HeatMap of Non-Ferrous Prices in EUR
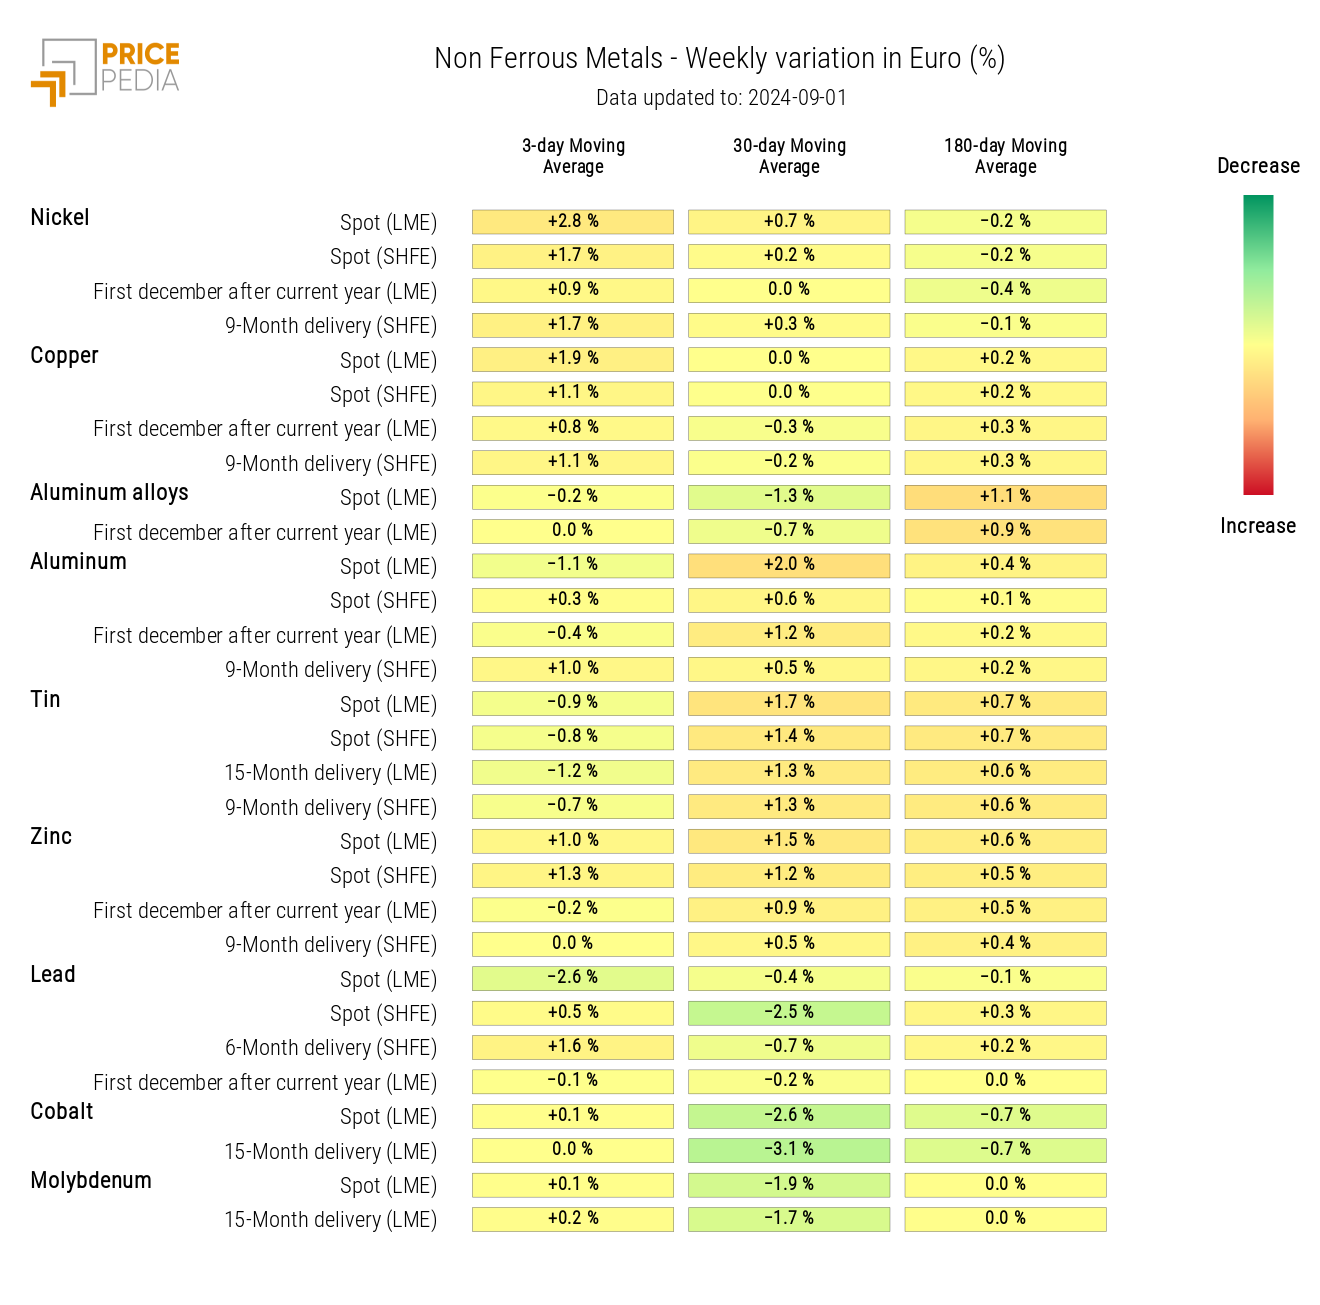
This week as well, the price of cobalt continued to remain particularly weak, falling below $24,000 per ton on the London Metal Exchange. Considering that cobalt’s all-time low was just below $22,000, with peaks above $80,000 both at the beginning of 2018 and early 2022, the volatility of this market and the current extremely low price levels are evident.
When adjusted for inflation, cobalt has reached its historical low. This situation may seem like an economic contradiction, given that cobalt is considered a metal with strong demand growth prospects, especially for its use in electric batteries. However, the cause of this price weakness lies in the effects of demand expectations and the high prices of 2018, which incentivized significant investments, leading to an increase in production capacity, both in ore extraction and metal production.
FOOD
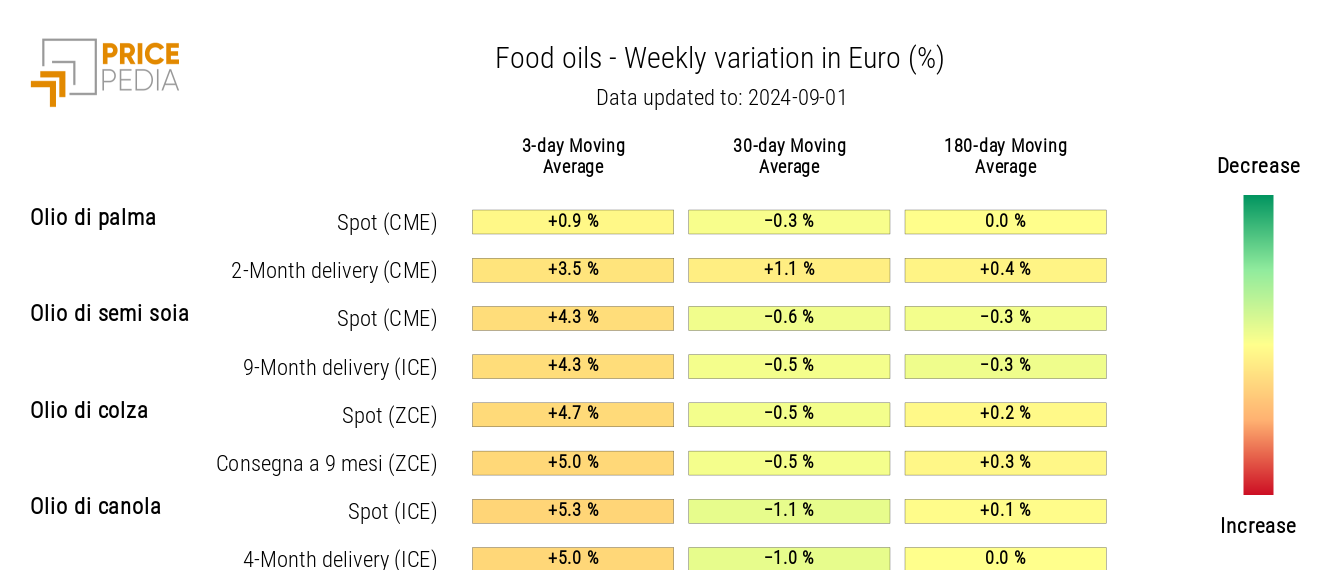
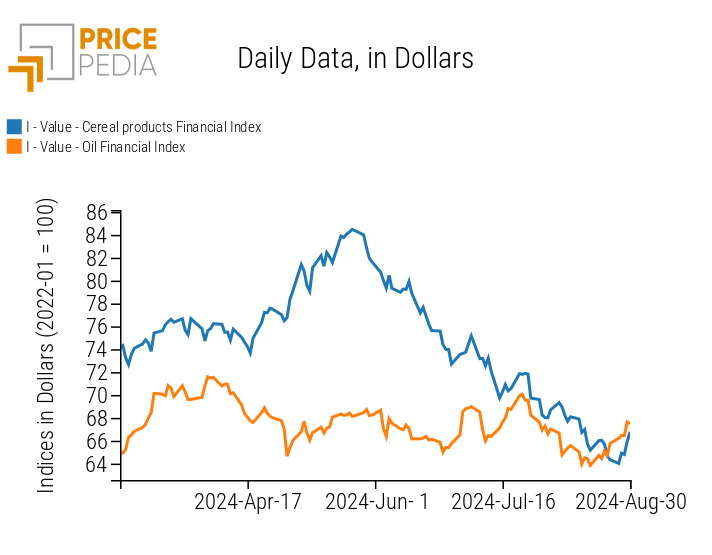
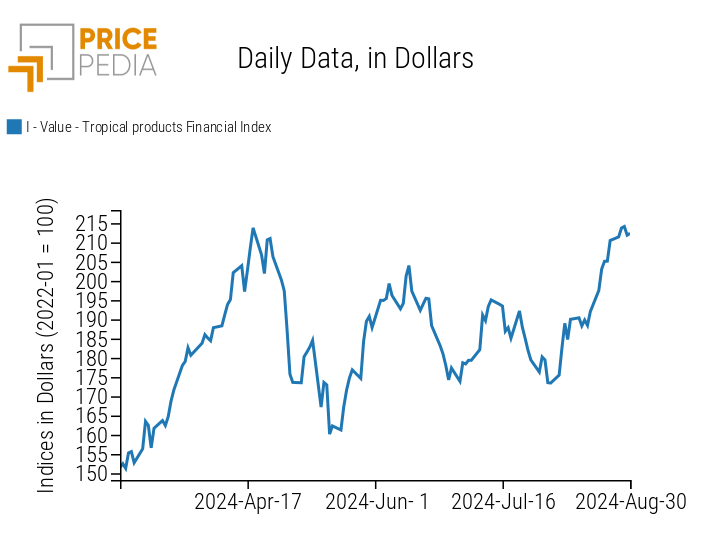
This week confirms the new upward trend in the prices of edible oils, and a second possible trend reversal is noted for cereal prices, which have risen due to unfavorable weather conditions.
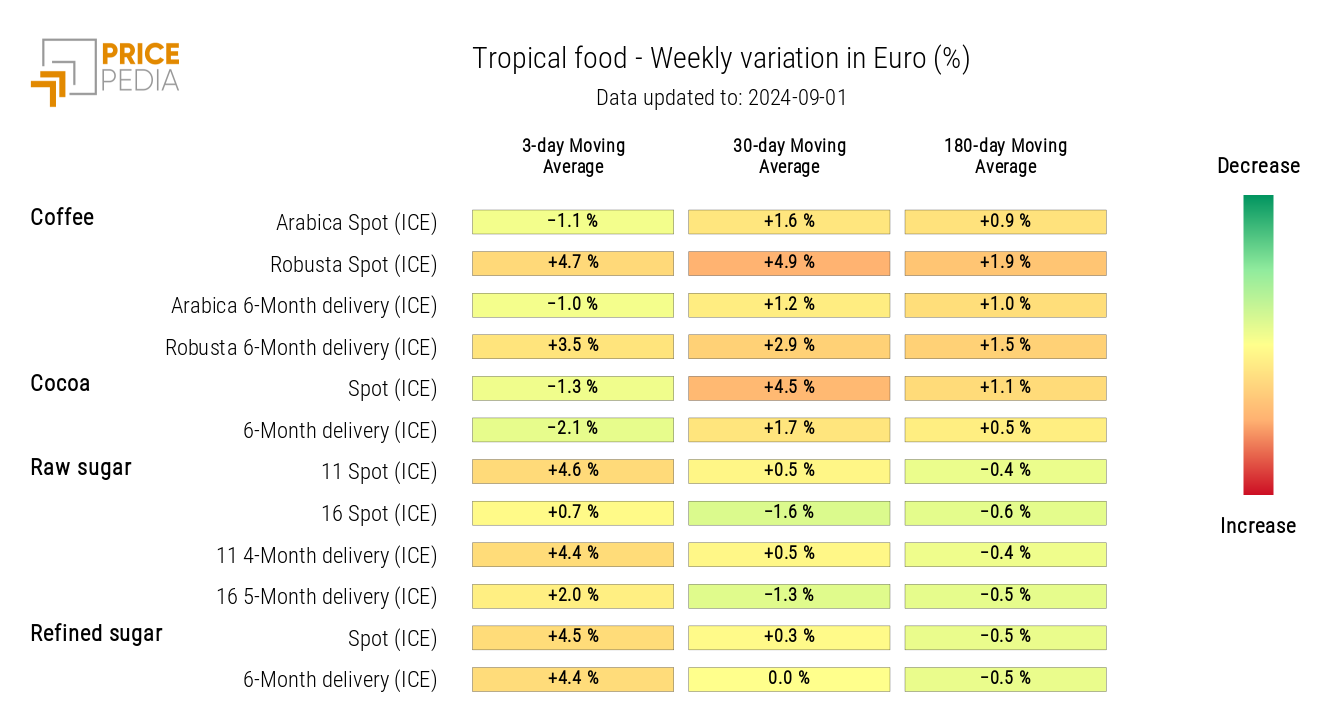
The tropical products index continues its climb, driven by price increases not only for Robusta coffee but also for sugar.
| PricePedia Financial Indexes of Food Prices in USD | |
| Cereals and Oils | Tropical Products |
|
|
CEREALS
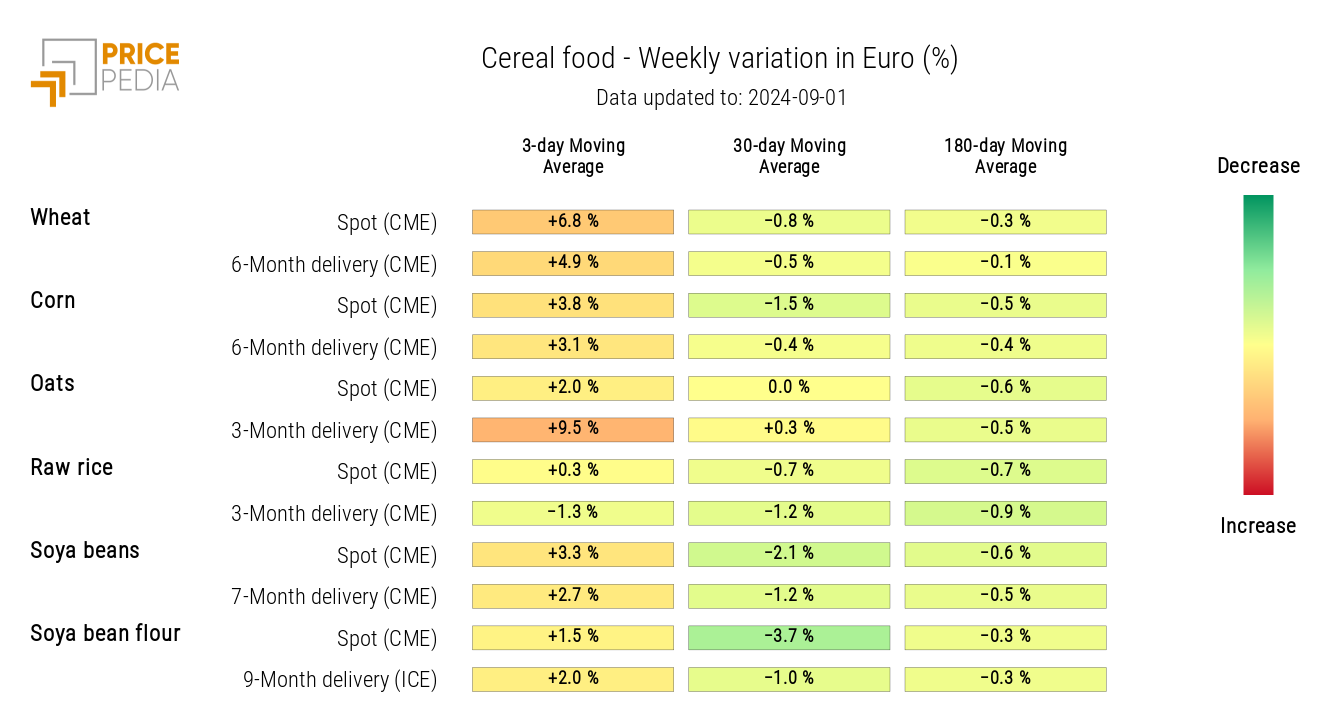
This week, there is a slight recovery in wheat prices and a more marked increase in oat prices.
Corn prices, however, remain largely stable because, despite expectations of a worsening European harvest, there is strong confidence in the U.S. harvest.
HeatMap of Cereal Prices in EUR
TROPICAL PRODUCTS
The heatmap of tropical food prices shows a particularly sharp increase in financial prices not only for Robusta coffee but also for sugar.
The rise in sugar prices began due to fires and dry weather conditions in the sugarcane-growing regions of Brazil. The growth was then exacerbated by speculators who last week had increased their short positions on sugar. Following the fires, speculators sought to cover their short positions by buying sugar futures, thus contributing to the price increase.
HeatMap of Tropical Food Prices in EUR
OILS
The heatmap below highlights a general increase in edible oil prices.
HeatMap of Edible Oil Prices in EUR
