Concerns about weak Chinese demand lower commodity prices
Bearish week for commodity markets
Published by Luca Sazzini. .
Conjunctural Indicators Commodities Financial WeekWeekly Summary of Financial Commodity Prices
This week, the financial commodity markets have been marked by general weakness.
The most significant declines occurred in the energy sector, which remains the most volatile and highly susceptible to short-term shocks.
Recent oil production disruptions from Libya have raised expectations of a potential revision to OPEC+ production cuts and initially contributed to a drop in oil prices. However, the real price contraction came after the release of disappointing Chinese PMI data from NBS, which, though mainly attributable to weather conditions (such as high temperatures and flooding), still raised concerns among financial operators about reduced Chinese domestic demand.
This decline in oil prices, coupled with demand-side concerns, led OPEC+ to postpone the restoration of normal production levels by another two months. Currently, weak Chinese domestic demand continues to outweigh the reduction in supply from OPEC.
A potential removal of oil production cuts could become risky as it might trigger a further drop in prices due to an oversupply.
The industrial metals markets also experienced some price reductions throughout the week.
The ferrous market was mainly penalized by the drop in iron ore prices in China, due to the excessive weakness in the real estate sector, which is the main factor behind the crisis in China’s domestic steel demand.
The non-ferrous market saw a general decline in the prices of major industrial metals: copper, nickel, aluminum, zinc, and tin.
Among agricultural commodities, there were some contrasting price trends: the grain market continued its upward trend, the oils market followed a mostly sideways dynamic, while tropical commodities saw a slight decline, countering the upward trend of previous weeks.
PMI
This week, official PMI data from Europe, the United States, and China were released.
Europe
In Europe, a contraction in the manufacturing sector was recorded, slightly better than expected, with a PMI of 45.8 in August. Although this figure is higher than both the previous (45.6) and analysts' forecasts (45.6), it still signals weakness in the European manufacturing sector. A value below 50 indicates contraction, while a value above 50 indicates improvement.
The composite PMI for the European economy stands at 51 points, indicating slight economic growth and an improvement compared to July’s 50.2. Although positive, this figure is still lower than analysts' expectations of 51.2.
USA
In the United States, the composite PMI for August came in at 54.6, exceeding both analysts' forecasts (54.1) and the previous month's figure (54.3).
While these data suggest an overall improvement in the US economy, the manufacturing sector remains particularly weak with a PMI of 47.2, below the 50-point threshold and analysts' expectations of 47.5.
China
China's PMI data, as reported by Caxin and NBS, showed contrasting figures.
The manufacturing figure from Caxin stood at 50.4, an increase from July's 49.8, while NBS reported a figure of 49.1, down from the previous month's 49.4.
NBS attributed the decline primarily to extreme weather conditions and only partly to the reduction in Chinese domestic demand.
Overall, the average of the two PMI figures slightly increased from 49.6 to 49.7, but still remained below 50, indicating a contraction in the manufacturing sector for the second consecutive month.
These data were perceived negatively by financial operators, who remain highly concerned about the ongoing weakness in Chinese market demand.
US Labor Market
US employment data for August were particularly disappointing.
Non-farm employment increased by 142,000, below expectations of 165,000.
Additionally, July’s estimate was revised downward from 114,000 to 89,000.
These figures indicate that US employment growth was significantly lower than analysts had previously estimated.
There were, however, improvements in the unemployment rate, which dropped back to 4.2%.
Worker wages showed an acceleration with a monthly increase of 0.4% m/m and an annual increase of 3.8% y/y.
ENERGY
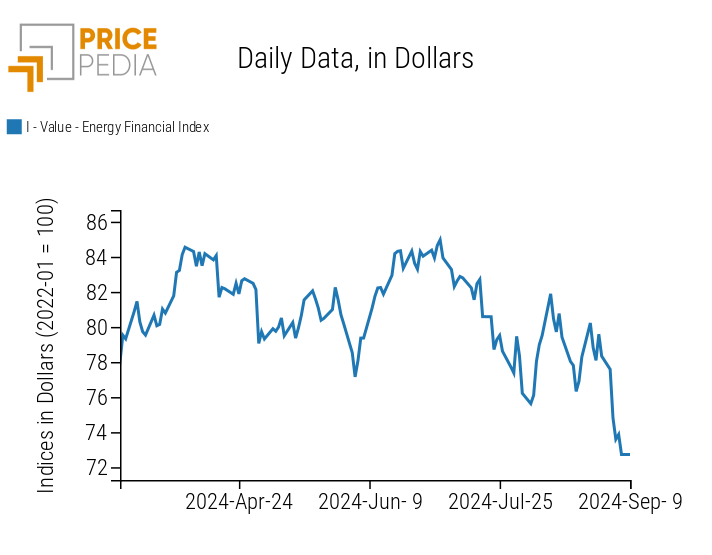
The PricePedia financial index of energy products indicates a decline in energy market prices.
PricePedia Financial Index of Energy Prices in USD
The energy product heatmap shows a green trend, indicating a general decrease in energy financial prices.
Energy Prices HeatMap in Euro
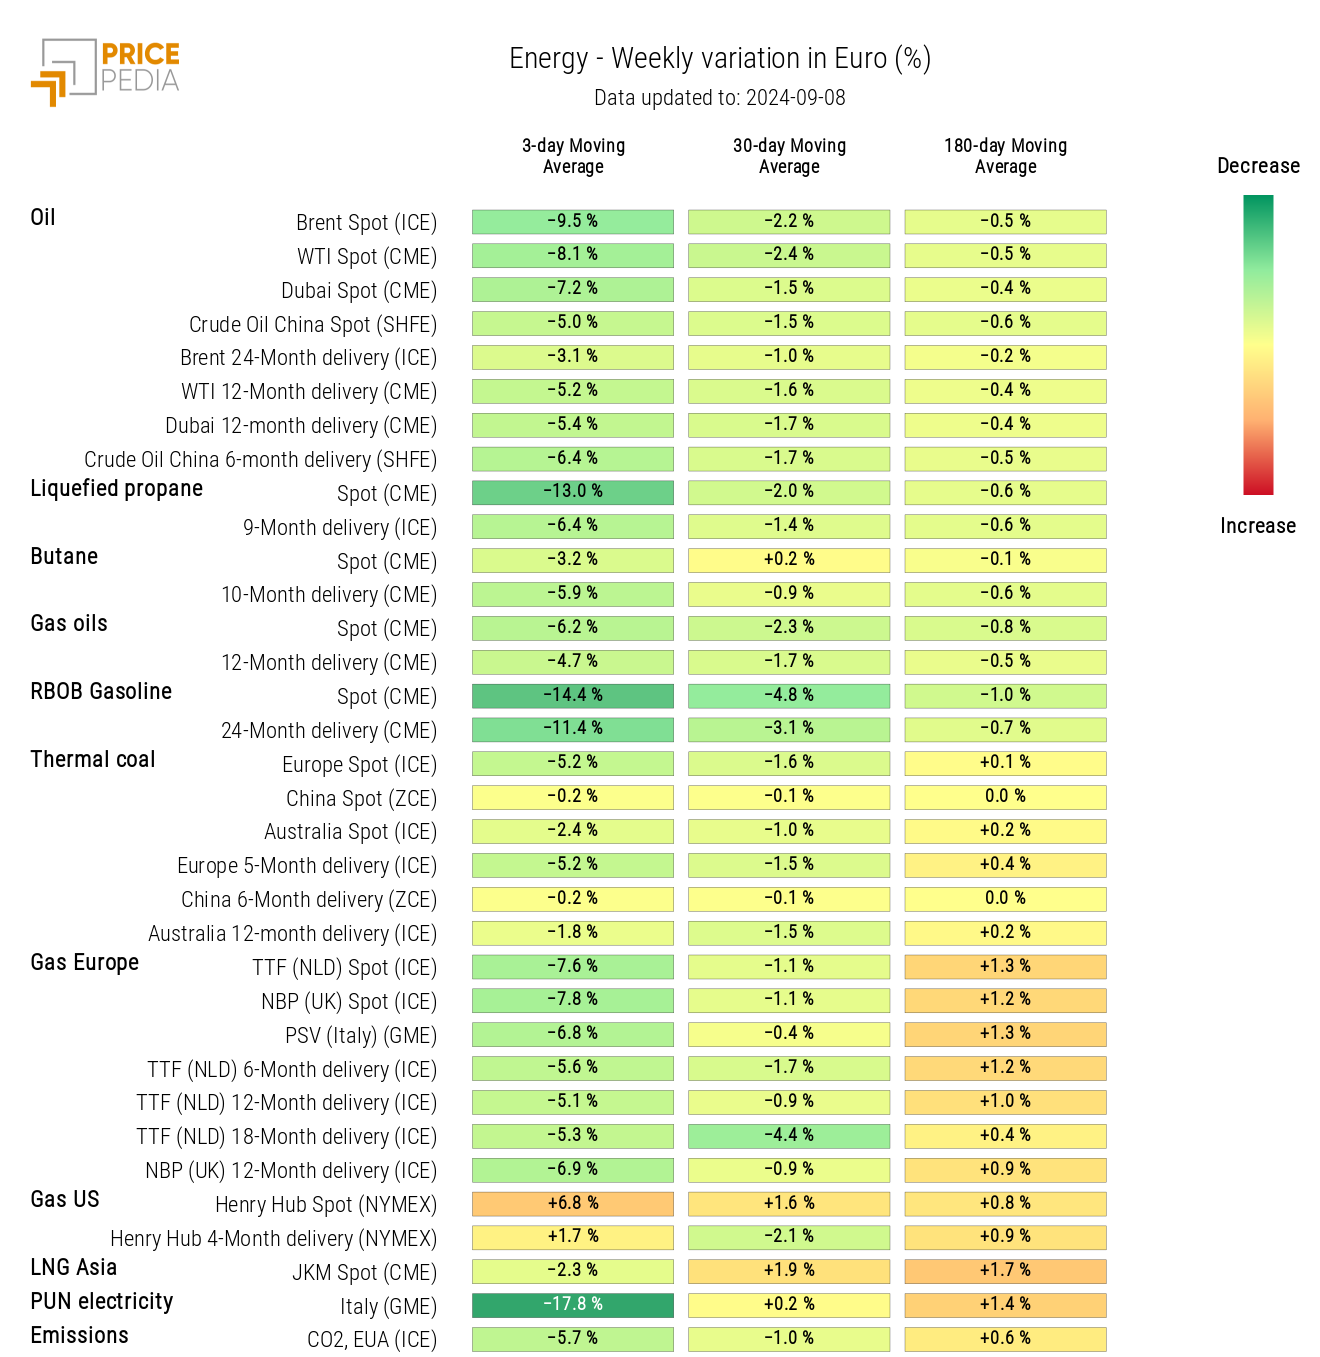
Oil prices have experienced declines related to demand-side concerns from China, following the discouraging PMI data from NBS.
European natural gas prices, on the other hand, have resumed their downward trend due to an abundant supply of stockpiles.
The only price showing a weekly increase in the moving average is that of U.S. natural gas, which has risen due to a weekly gas storage increase in the U.S. that was much lower than expected.
PLASTICS
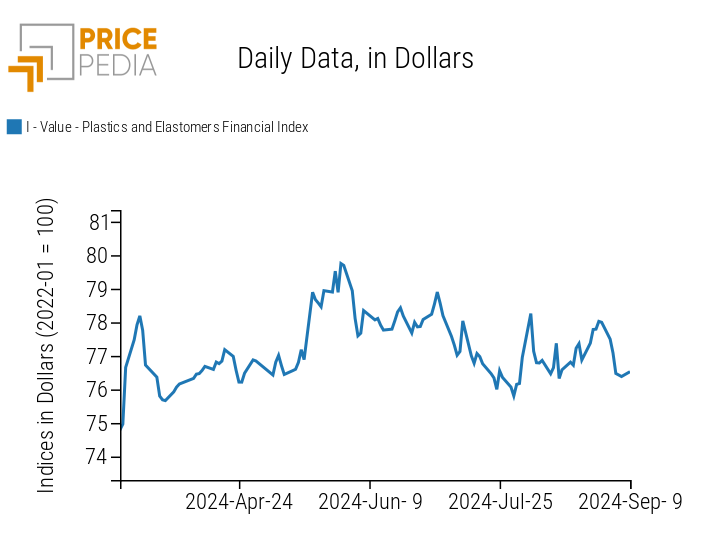
The PricePedia financial index for plastic prices quoted in China has seen a price reduction, primarily due to the current dynamics of oil prices.
PricePedia Financial Indices of Plastic Prices in USD
FERROUS
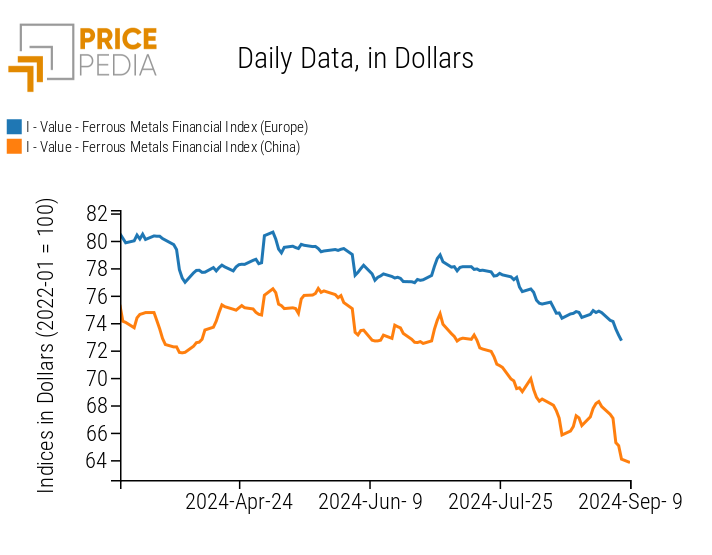
This week, the price contraction phase of the ferrous market resumed, once again driven by the price of iron ore in China. The decline in Chinese iron ore prices is noticeably sharper in the Chinese index, though the European index also experienced a slight drop.
The ongoing crisis in China’s real estate sector is severely weakening steel demand, leading to a significant excess of supply in the domestic market.
PricePedia Financial Indices of Ferrous Metal Prices in USD
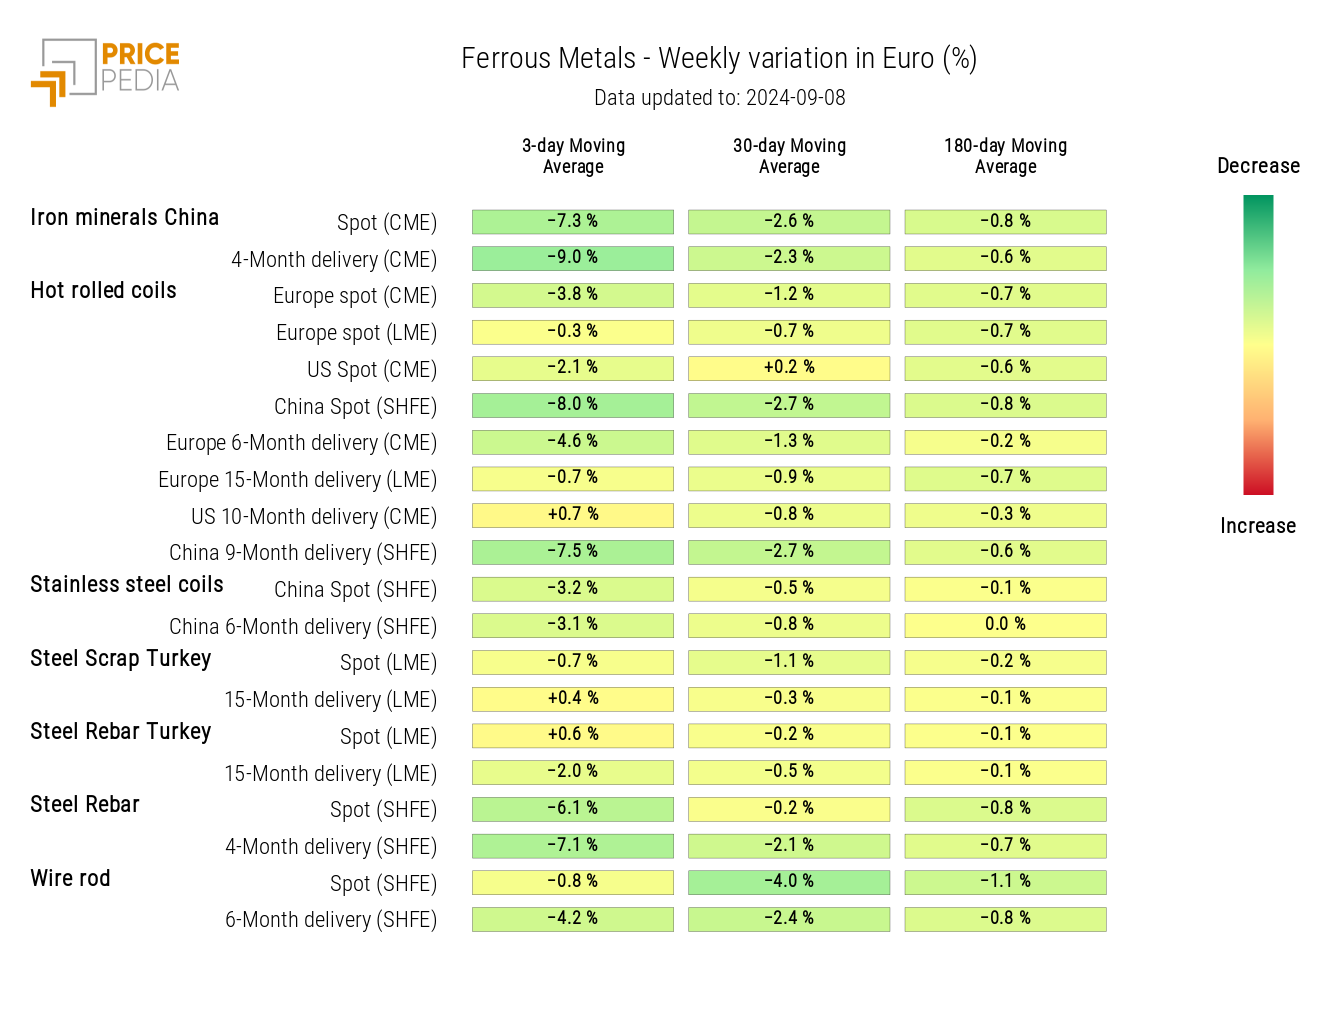
The ferrous heatmap shows reductions in the prices of key industrial ferrous metals, highlighted in green.
The most significant reduction is in Chinese iron ore prices, which have already decreased by over 30% from January 2024 levels.
Another notable decline is in the prices of steel rebar listed on the Chinese SHFE financial exchange, which has erased the slight recovery seen last week.
HeatMap of Ferrous Prices in Euro
Do you want to stay up-to-date on commodity market trends?
Sign up for PricePedia newsletter: it's free!
NON-FERROUS INDUSTRIAL METALS
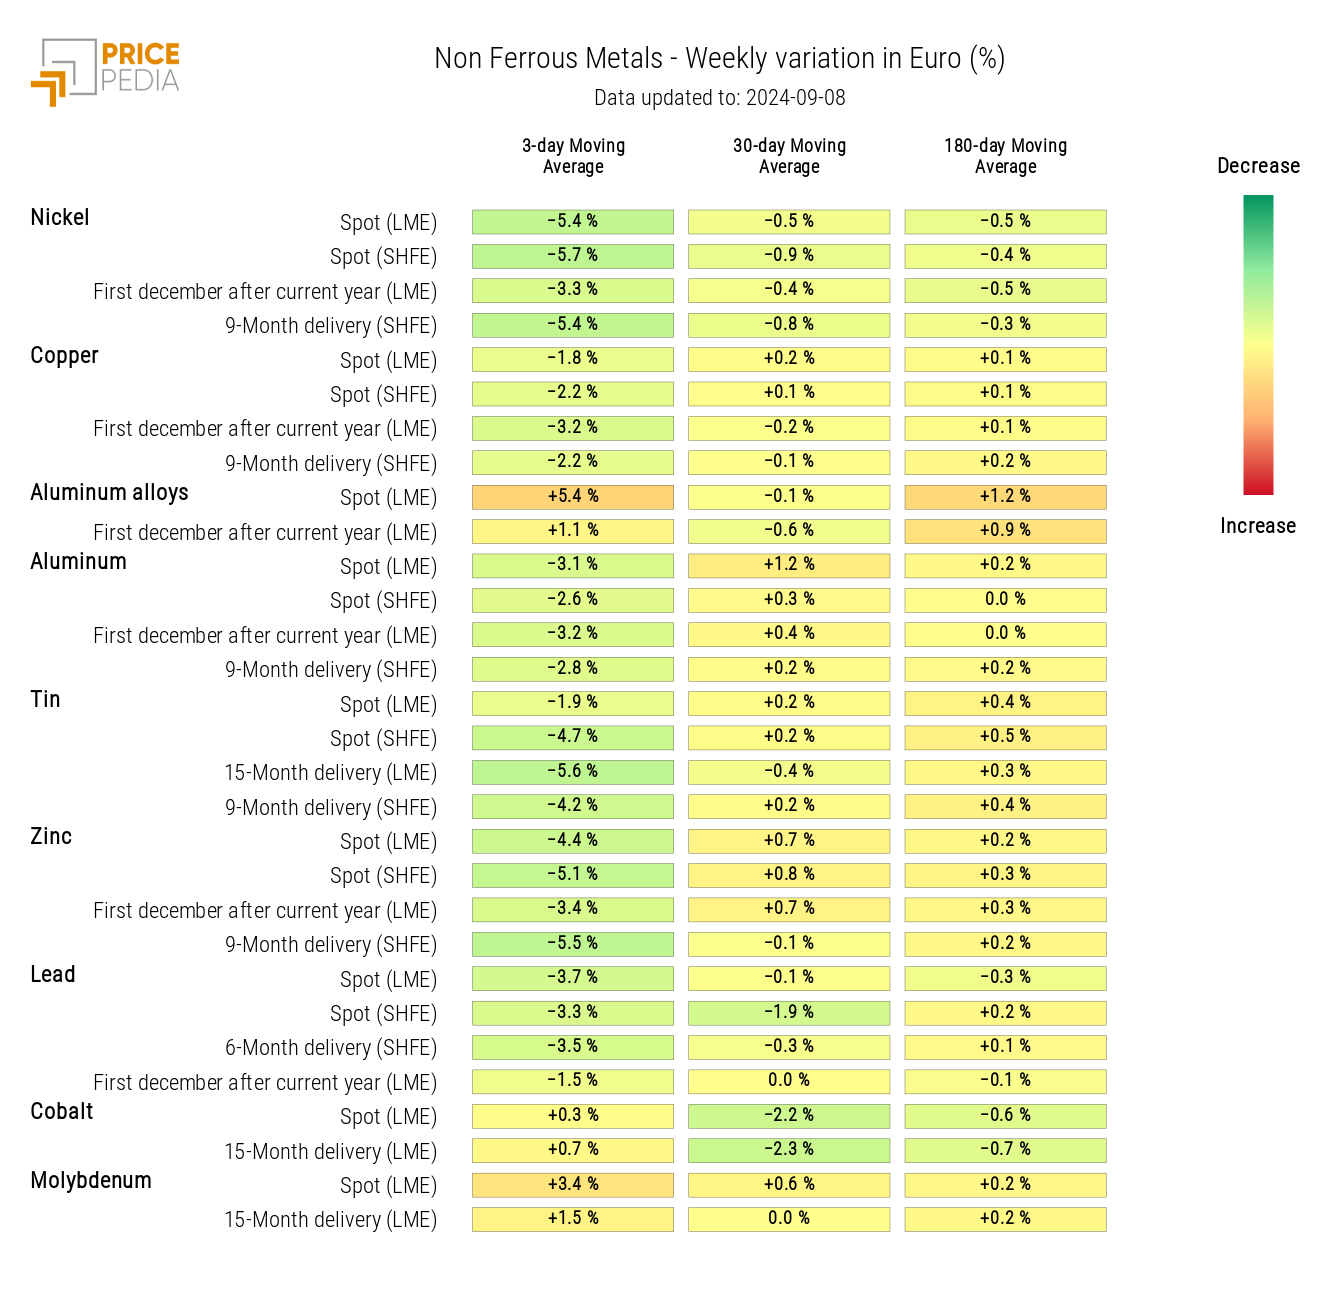
This week, there was also a general decline in the prices of non-ferrous industrial metals.
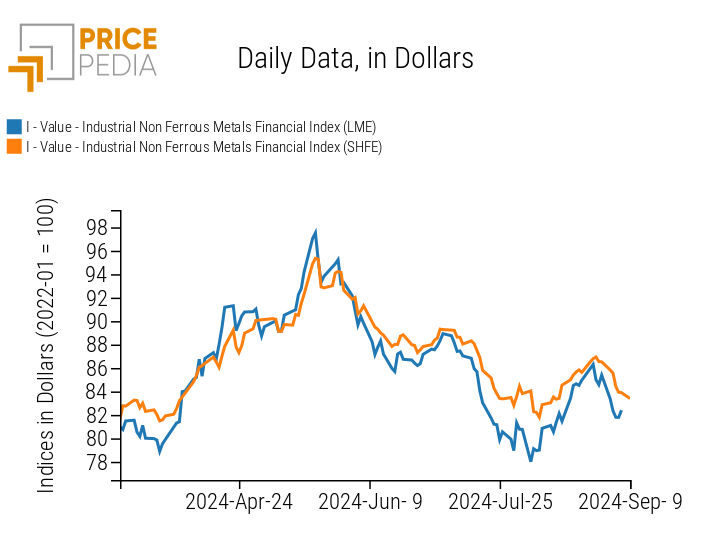
After a brief rise in early August, the past two weeks have seen price reductions in the two financial indices of industrial metals, which have almost erased the previous gains.
PricePedia Financial Indices of Non-Ferrous Industrial Metal Prices in USD
The heatmap of non-ferrous industrial metals highlights a general price decline, with the exception of aluminum alloys and molybdenum.
HeatMap of Non-Ferrous Prices in Euro
FOOD
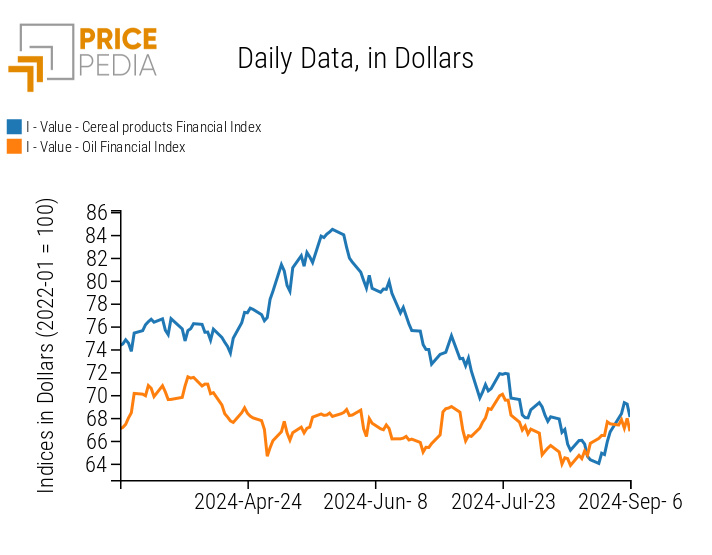
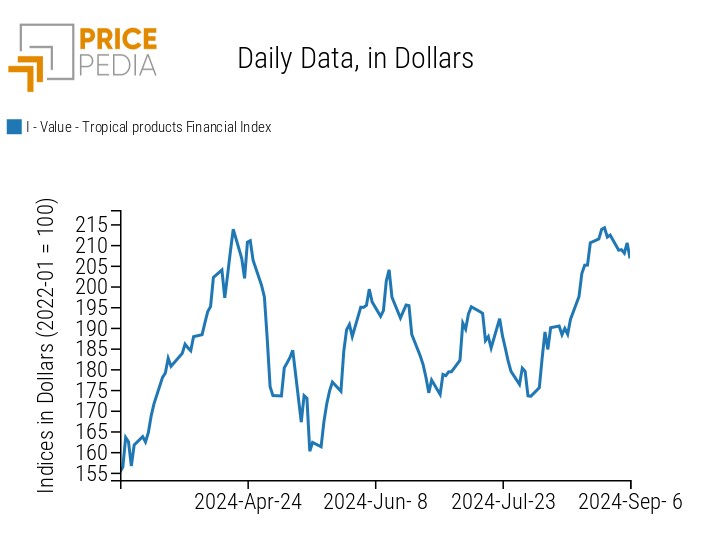
Among food indices, three distinct price trends were observed:
- The cereal index continued its upward trend in recent periods;
- The oils index slowed its upward dynamic to show mostly lateral movements, attributable to the opposing fluctuations across different types of edible oils;
- The tropical index presented a slight decline in prices, countering the price trend of the previous weeks.
| PricePedia Financial Indices of Food Prices in USD | |
| Cereals and Oils | Tropical |
 |  |
CEREALS
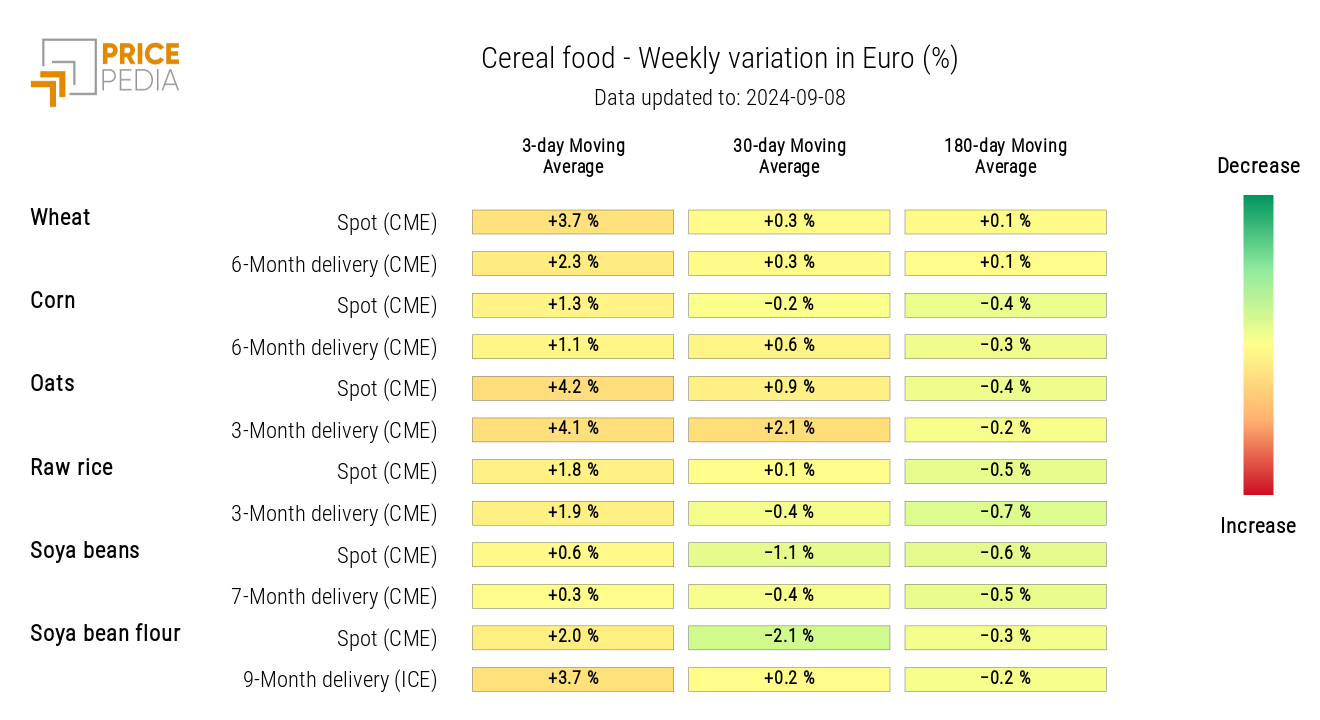
The heatmap of cereals shows a weekly increase in the moving average prices for most futures contracts in this commodity group.
HeatMap of Cereal Prices in Euro
OILS
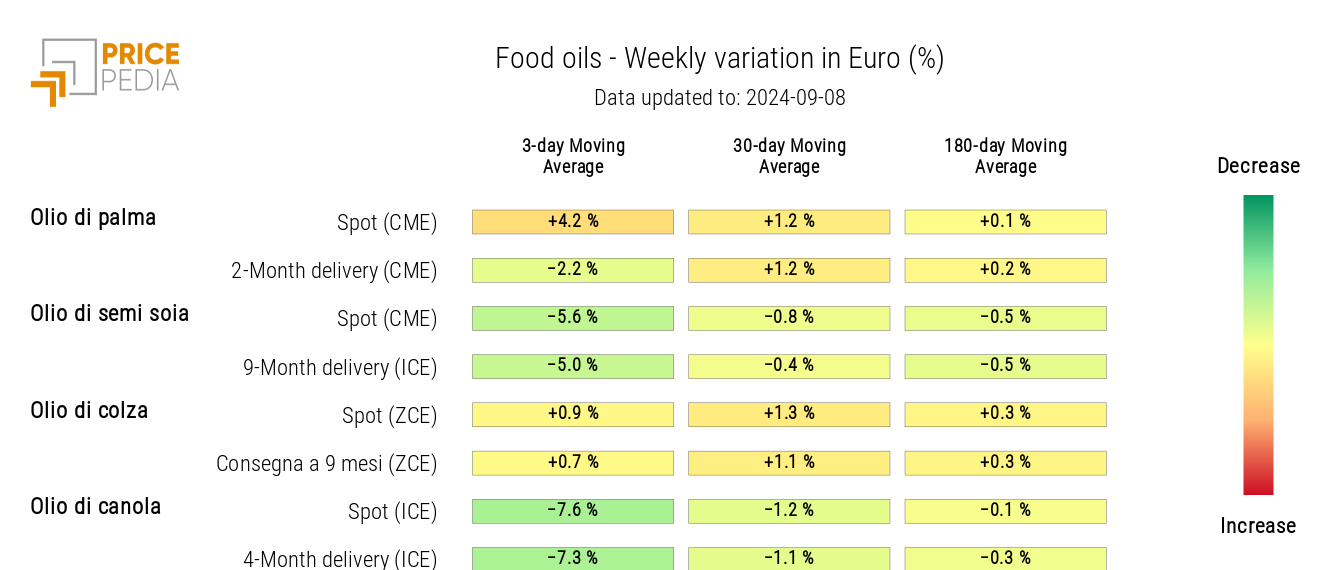
The oils heatmap shows price variations in opposite directions.
Palm oil and rapeseed oil prices have increased, while canola oil and soybean oil prices have decreased.
HeatMap of Edible Oil Prices in Euro
