Weak demand and news contend for market leadership
Weather and stock reductions led to a slight recovery in prices over the weekend
Published by Luca Sazzini. .
Conjunctural Indicators Commodities Financial WeekWeekly Summary of Commodity Financial Prices
In a context of weak demand, this week, commodity financial prices have been characterized by temporary fluctuations mainly dependent on weather phenomena or stock declines.
Energy prices began the week with a drop, despite OPEC+ delaying the increase in oil supply by two months.
On Tuesday, Brent crude prices closed trading below $70/barrel, a price level far from OPEC+'s target of $80/barrel. However, in recent days, oil and natural gas prices have slightly recovered, mainly due to production disruptions caused by Hurricane Francine.
The ferrous metals market experienced different price movements between Europe and China. European prices continued to fall, while Chinese prices partially recovered due to a reduction in steel inventories and speculative effects resulting from the excessive decline in recent weeks.
Non-ferrous metal prices also partially recovered due to a reduction in base metal inventories on the Shanghai Futures Exchange (SHFE).
In the food sector, there are contrasting dynamics: an increase in cereals, oscillations in tropicals, and stability in edible oils.
Possible Russian Export Restrictions
Putin proposed to his government to introduce new restrictions on Russia's exports in response to current Western sanctions.
The commodities potentially subject to supply cuts by Russia are uranium, titanium, and nickel. The latter has already seen a slight price increase following these statements, although the increase is currently minimal. However, if Russian export restrictions materialize, there could be a new upward trend in the market for these three metals.
ECB Rate Cut
At its meeting on Thursday, September 12th, the European Central Bank (ECB) opted for a second interest rate cut of 25 basis points. The decision was unanimous and was extensively explained by President Lagarde. The main factors contributing to the rate cut were:
- The reduction in inflation, which has aligned with analysts' expectations. For 2025, a rate of 2.2% is expected, dropping to 1.9% in 2026. The core inflation is projected to fall to 2.3% in 2025 and reach 2% in 2026.
- The downward revisions of GDP growth and domestic demand by the ECB.
- The cooling of tensions on labor costs.
The ECB President did not provide further information on when the next rate cut will occur. The central bank will continue to have a data-centric approach, avoiding explicit declarations about future monetary policy moves, as opposed to the FED.
U.S. Inflation
The U.S. inflation rate in August aligned with analysts' expectations, contrary to the core figure, which slightly surprised on the upside.
The Consumer Price Index (CPI) grew by 0.2% m/m, in line with July's trend, and fell on a year-on-year basis from 2.9% to 2.5% y/y.
The core CPI rose to 0.3% m/m from 0.2% the previous month but remained stable on an annual basis at 3.2% y/y.
Most of the inflationary pressure continues to be caused by housing services, which recorded monthly variations of 0.5% m/m and annual variations of 5.2% y/y.
European Industrial Production
In July, the industrial production of the eurozone continued to decline, confirming the current downward trend in the sector. On a monthly basis, industrial production fell by -0.3% m/m, while it dropped by -2.2% y/y on an annual basis.
The current weakness is attributable to a lack of demand and rising production costs.
However, the reductions in industrial production were less pronounced than analysts expected. No significant trend reversals are expected in the coming months, given the current weakness of the European manufacturing sector.
ENERGY
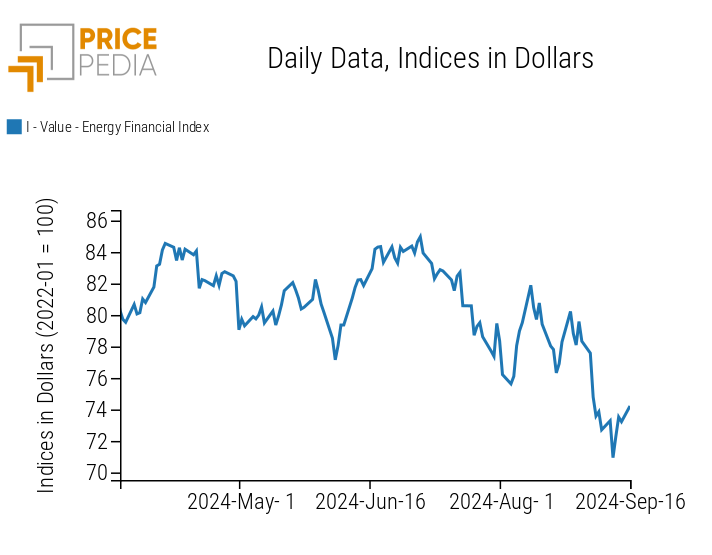
In the last days of the week, the PricePedia financial index for energy saw an upward turn due to production disruptions in oil and natural gas caused by Hurricane Francine.
PricePedia Financial Index of Energy Prices in USD
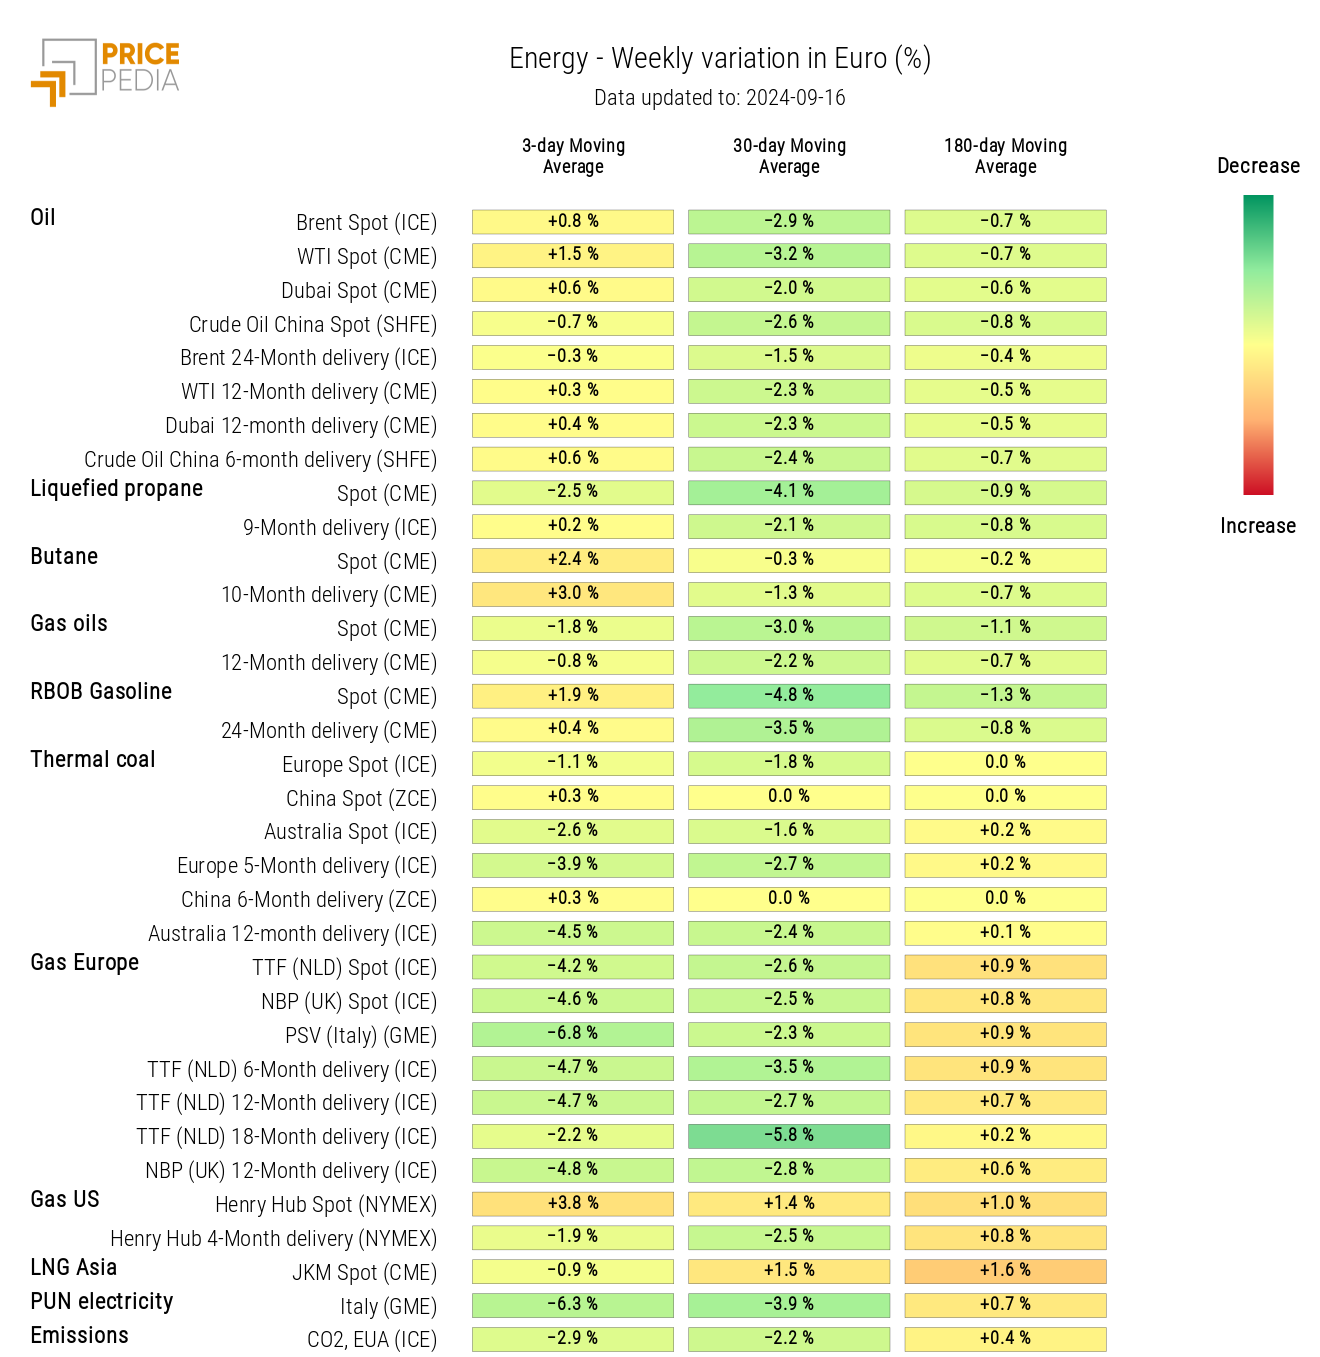
Except for natural gas prices and, above all, the Italian PUN electricity price, the energy product heatmap does not show particularly intense weekly variations in the 3-day moving averages of prices. Most energy products experienced a brief weekly oscillation, which did not change the price level.
Notably, the negative variation of the PUN, which fell below 100 euros/MWh on Friday.
HeatMap of Energy Prices in Euros
PLASTICS
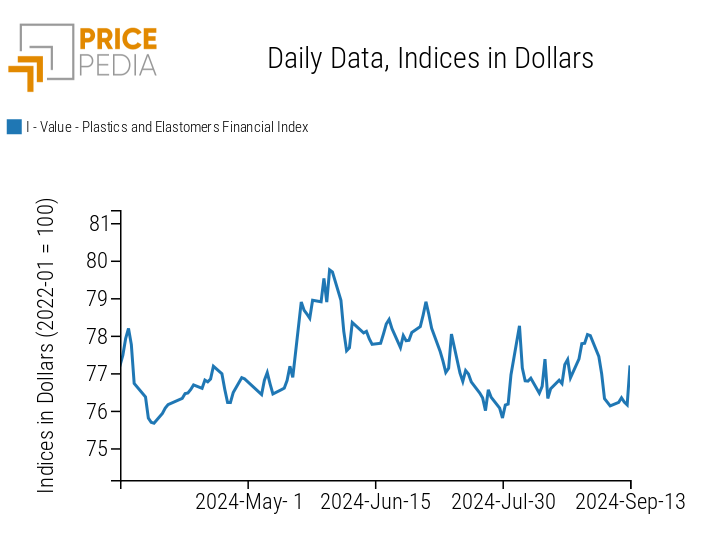
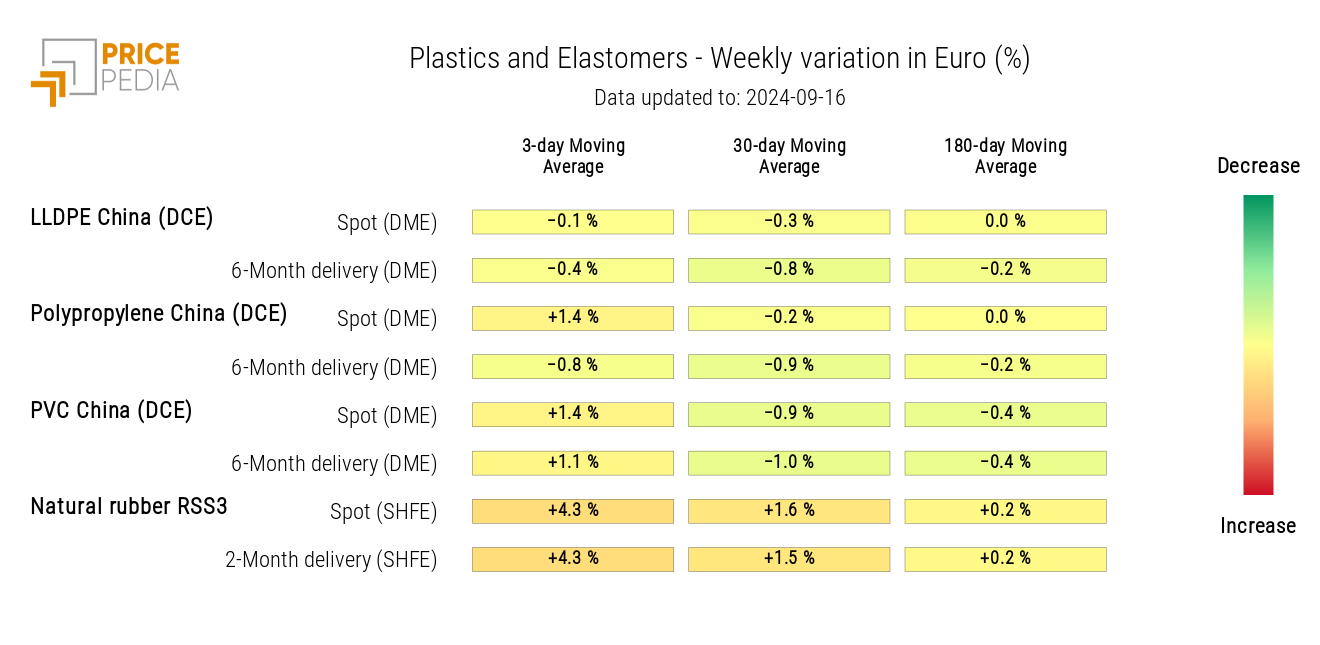
The PricePedia index of financial prices for plastics and elastomers closed the week with a rise caused by the recovery of oil prices and the increase of natural rubber prices.
PricePedia Financial Index of Plastic Prices in USD
The heatmap below highlights the weekly increase in the 3-day moving average of natural rubber RSS3 prices in orange.
HeatMap of Plastic and Elastomer Prices in Euros
FERROUS METALS
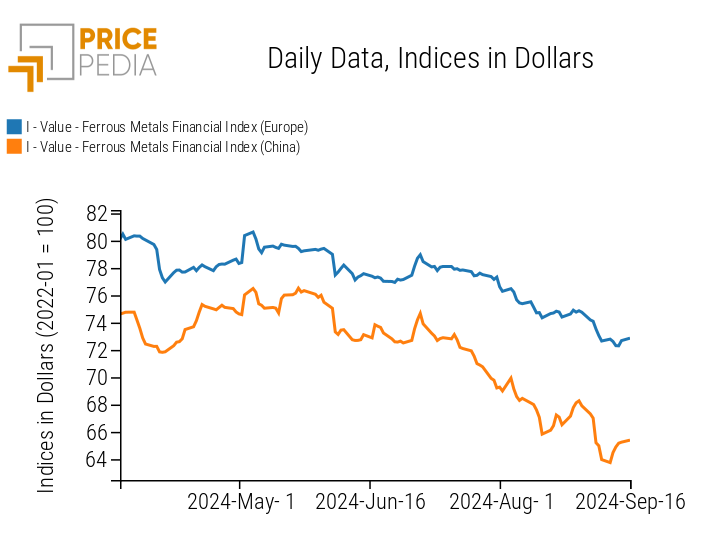
The two financial indices of ferrous metals came closer this week, with the European index continuing a moderate decline and the Chinese index registering an increase. The slight recovery in the Chinese market is due both to the excessive drop that the index had recorded in previous weeks and to news of steel inventory reductions at major Chinese steel mills.
PricePedia Financial Index of Ferrous Metal Prices in USD
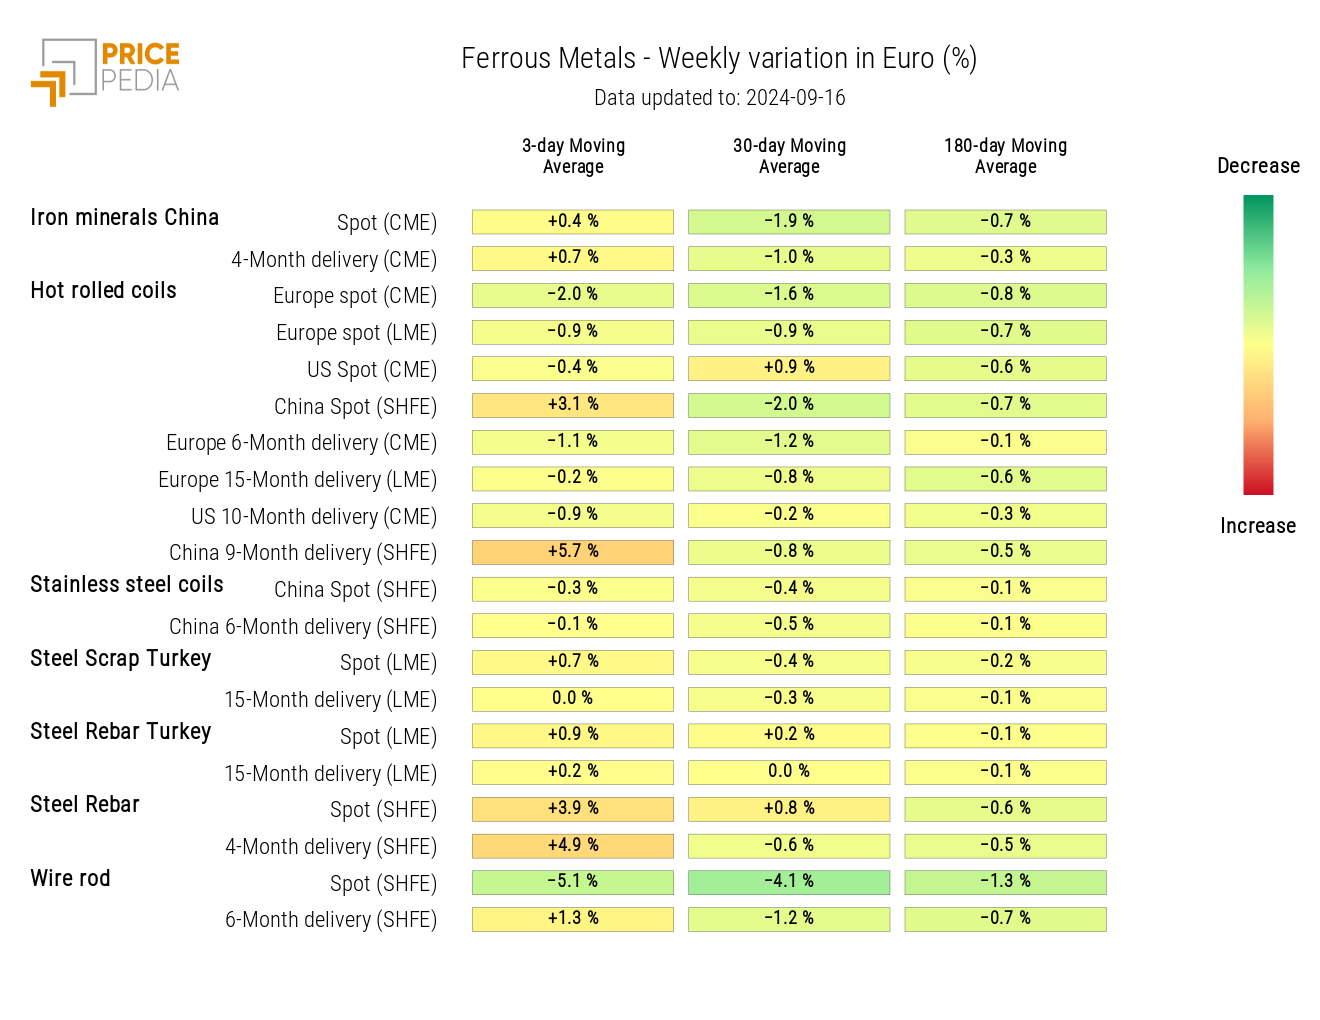
The ferrous heatmap shows a timid recovery in the majority of ferrous metal prices, except for the decline in wire rod prices.
HeatMap of Ferrous Metal Prices in Euros
Do you want to stay up-to-date on commodity market trends?
Sign up for PricePedia newsletter: it's free!
INDUSTRIAL NON-FERROUS METALS
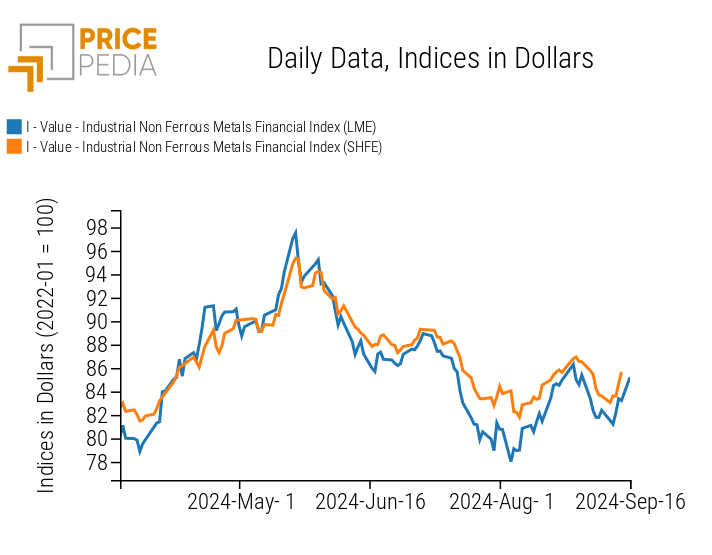
The two indices for non-ferrous metals indicate a partial price recovery due to the reduction in the weekly inventories of the main base metals.
PricePedia Financial Index of Industrial Non-Ferrous Metal Prices in USD
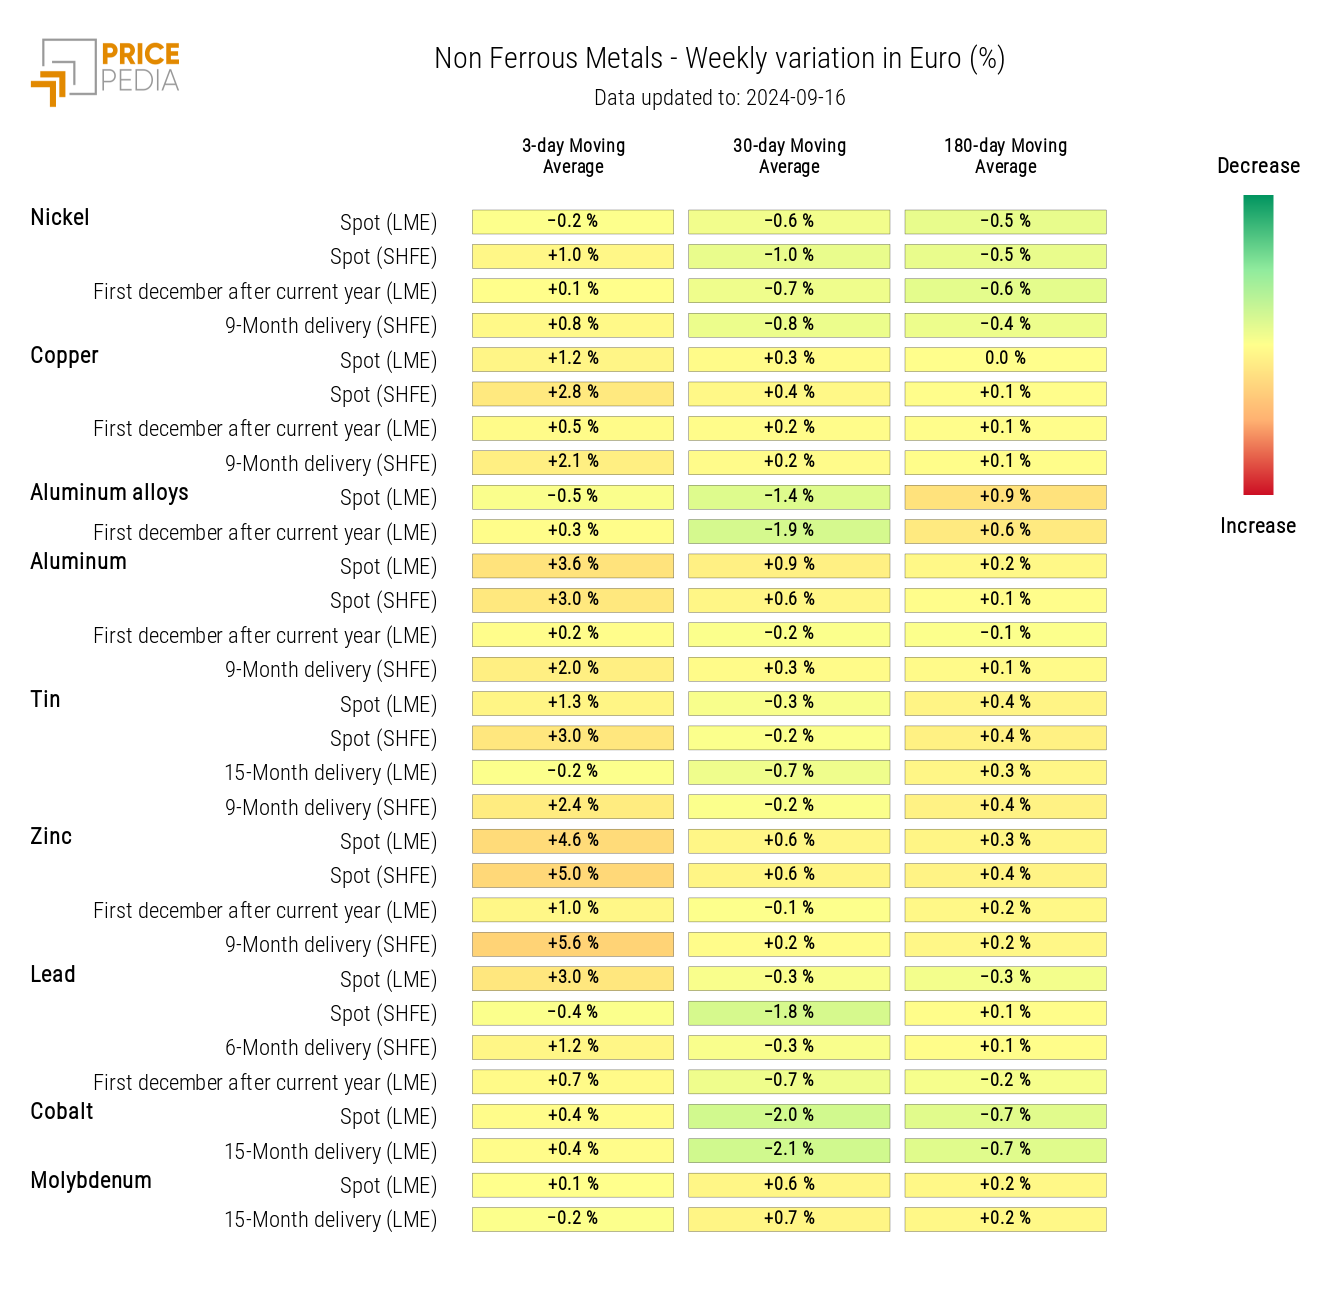
The non-ferrous heatmap indicates a slight general increase in prices.
HeatMap of Non-Ferrous Prices in Euros
FOOD
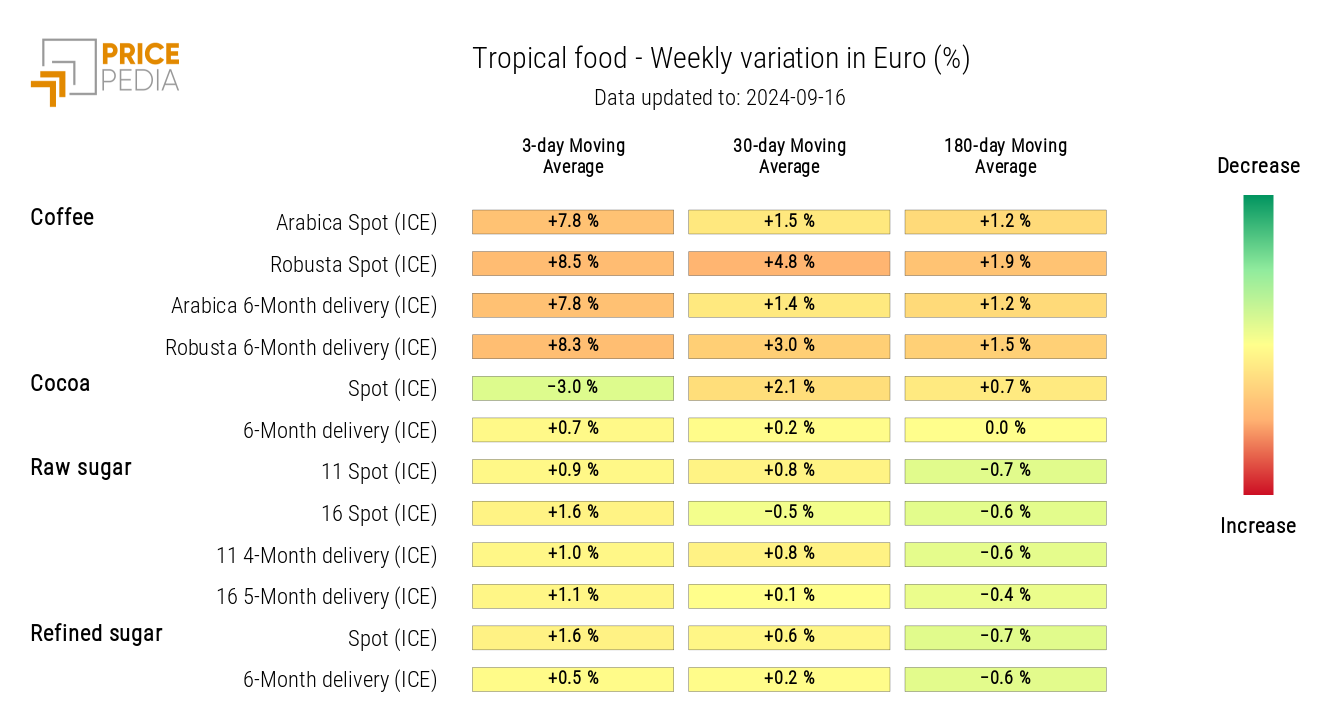
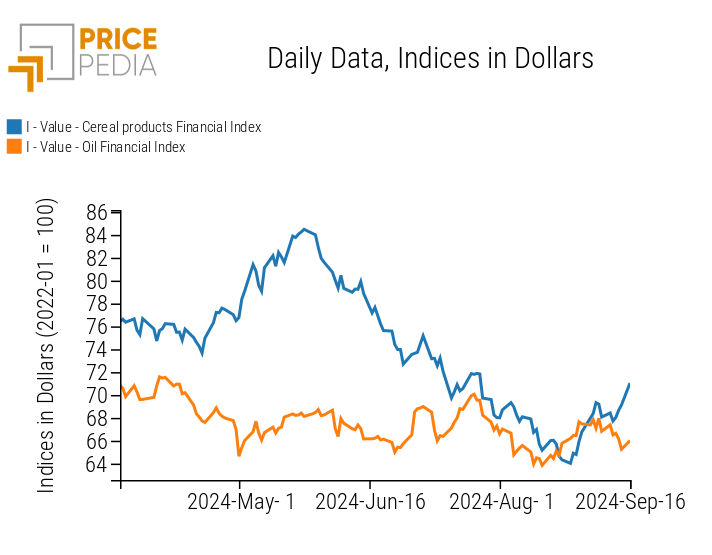
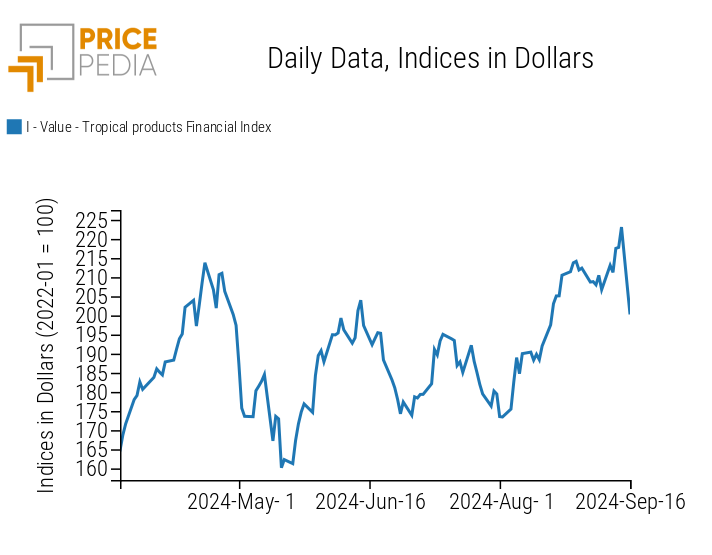
This week, the food indices followed divergent trends: the cereals index registered an increase, the tropicals index experienced strong fluctuations, and the edible oils index remained relatively stable.
| PricePedia Financial Indices of Food Prices in USD | |
| Cereals and Oils | Tropicals |
|
|
CEREALS
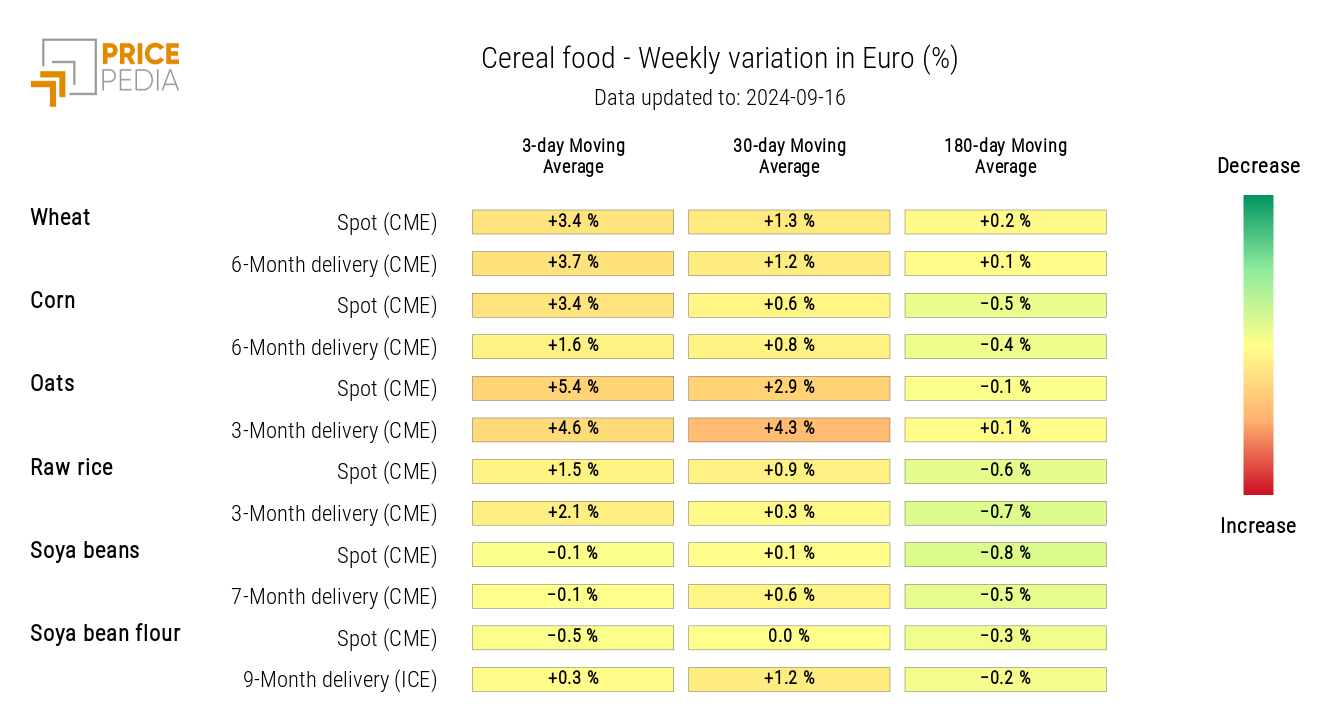
The cereals heatmap highlights a weekly increase in the prices of wheat, corn, and oats.
HeatMap of Cereal Prices in Euros
Tropicals
The tropicals heatmap shows an increase in coffee prices, while cocoa prices fell on Monday, September 16th.
HeatMap of Tropical Food Prices in Euros
