Stearic acid: market risk analysis
Excessive supply shortage could endanger world trade in stearic acid
Published by Luca Sazzini. .
Organic acids Fatty acids Analysis tools and methodologiesIn the article Friendshoring and market risk of purchasing materials, a methodology for calculating the market risk score of a commodity was presented, linked to the possible fragmentation of the world into blocks characterized by greater intra-block economic and political integration compared to that between different blocks.
From the point of view of market risk deriving from the characteristics of the exporting countries, this represents only one of the possible risk factors.
A second factor, frequently discussed in economic literature, is supply concentration. If the global supply of a commodity is concentrated in a few exporting countries holding high shares of trade, the commodity market can experience severe turbulence in the event of unexpected changes in supply, even by just one of the main exporting countries.
A third, more generic risk factor can be calculated by analyzing the net trade balance of the EU compared to the rest of the world. A positive trade balance indicates that the EU is self-sufficient for the commodity in question. Conversely, a negative trade balance signals that supply in the EU market also depends on the choices of third countries and is therefore subject to changes in their supply policies.
These three risk factors can be succinctly described as factors due to the "structure of international trade".
This article provides an analysis of the application of these three market score calculation criteria to the case of stearic acid.
Stearic Acid
Stearic acid is a thickening and stabilizing agent, which, in addition to being relatively inexpensive, has applications in numerous industrial sectors.
The main ones include:
- the cosmetic and pharmaceutical sector: where it is used as a surfactant and emulsifier;
- the plastics industry: where it is used as a lubricant and softening agent;
- the food industry: where it is used as a food additive and coating agent to improve the texture and appearance of food products;
- the paper industry: where it is used in the production of paper and cardboard to improve strength and finishing properties.
Market Risk Score
Below are the three criteria used to calculate the market score of stearic acid.
Score Based on Block Opposition
The following scatter ball chart shows the main net importing and exporting countries, differentiated based on their level of proximity to the Western world.
The graph is interactive: hovering over a country displays a table with information related to it.The x-axis shows the share of world trade[1], while the y-axis shows the country's proximity index to the Western world.[2] The size of the circles varies only for exporting countries (colored in pink) and indicates the importance of the country as an exporter in the EU. A horizontal line corresponding to the value 60 of the proximity index to the Western area is also drawn in the scatter plot. This value was chosen solely for graphical reasons to better distinguish countries closer to the West from those farther away.
The graph shows that the score associated with this first risk indicator is relatively low. It has a level of 11 on a scale between 0 and 100, indicating that the market risk due to a hypothetical opposition between blocks is relatively contained.
A second important piece of information that can be extracted from the graph is that although Indonesia is the exporting country with the largest share of world trade, it is not a significant exporter for the European Union (its circle is small). This aspect is consistent with the recent introduction of the anti-dumping duty that the European Union imposed on companies producing in Indonesia. This duty was introduced with the commission implementing regulation 2023/1111, following an investigation initiated by the European Union in November 2021.
During the investigation, evidence of dumping emerged for the introduction of fatty acids (including stearic acid) into the European market at prices below the market average, causing significant damage to the European Union's industry. The complaint, filed by the Coalition against Unfair Trade in Fatty Acid (CUTFA), led to the adoption of anti-dumping duties to counter the unfair competition practiced by Indonesian producers. The maximum rate that this anti-dumping duty can currently reach is 46.4%.
Do you want to stay up-to-date on commodity market trends?
Sign up for PricePedia newsletter: it's free!
Score Based on Supply Concentration
This second method of measuring a commodity's market score derived from the structure of world trade focuses on the degree of concentration of the global supply.
To get an initial view of the concentration of the global supply of a product, it can be helpful to plot the main net exporting and importing countries.
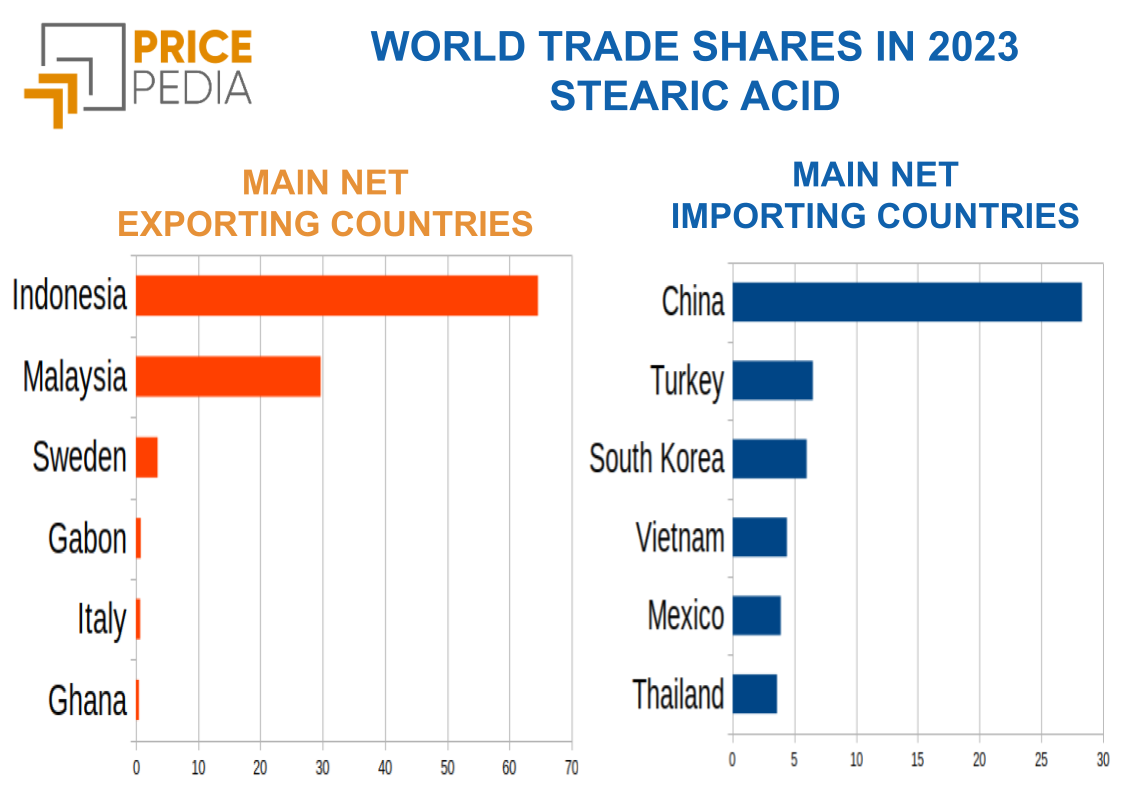
The graph below shows the top 6 net exporting and importing countries1 of stearic acid in 2023.

The graph on the left shows that Indonesia and Malaysia together control over 90% of global stearic acid exports, with Indonesia alone holding more than 60% of this share. These data highlight a significant concentration of exports in these two countries, suggesting that any problems in supply from Indonesia or Malaysia could jeopardize the entire global trade of stearic acid.
Among net importing countries, China stands out, accounting for nearly 30% of global stearic acid imports. Turkey and South Korea follow, with import shares of 6.5% and 6%, respectively. All other countries, however, register net imports of less than 5% of the world total.
These data show that the current balance of the global stearic acid market is closely linked to the exports of two individual countries. Therefore, the score based on the degree of supply concentration has a maximum score of 100 out of 100. This is even more concerning considering the recent introduction of anti-dumping duties by the EU on imports from Indonesia. In fact, all other conditions being equal, it further increases the risk of disruptions to EU supply derived from possible supply policies by exporting countries.
Score Based on EU Trade Balance
A final indicator that can be useful to analyze is given by the EU's trade deficit of the commodity in question, normalized with its foreign trade (X+M). The deficit is naturally calculated as total imports minus total exports.
In the case of stearic acid, this indicator is equal to 33%.
This means that the trade deficit of the European Union for stearic acid represents 33% of the entire volume of foreign trade (Total Exports + Total Imports), signaling a significant degree of EU dependence on the global supply of third countries.
Conclusions
To obtain a synthetic score of the market risk of stearic acid due to the structure of international trade, one must consider an aggregation of the three indicators reported in the article.
The first indicator records that the risk associated with a possible opposition between blocks is relatively limited, with a score of 11.
The second indicator, on the other hand, is characterized by a score related to the degree of supply concentration that is maximum and equal to 100. This is justified by the fact that Indonesia and Malaysia alone control over 90% of the global trade of stearic acid.
The last indicator found an EU trade deficit of 33%, a rather worrying figure compared to the values of other commodities.
Assembling these three indicators into a single synthetic index can be complex, as the weights to be associated with the different risk indices may vary depending on the objectives.
Overall, however, it can be concluded that stearic acid has a market risk mainly due to the concentration of supply that depends solely on two exporting countries.
If problems were to arise in one of the two exporting countries, a supply shortage would occur worldwide.
[1] In this analysis, we have decided to focus on net exports and imports to obtain a clearer view of a country's role in the market. A country's exports can include goods that were previously imported and then re-exported, which can distort its actual contribution. By considering only net exports and imports, we can exclude the effect of these imported and re-exported goods, thus providing a more accurate assessment of each country's actual participation in the market.
[2] As a first hypothesis, we simply multiplied the Heritage Foundation's Economic Freedom Index by 1.2 for the countries that voted in favor of the various resolutions and by 0.8 for the countries that abstained or voted against. It is clear that this measure is subject to many improvements, but as an initial working hypothesis, it seemed adequate.


