A measure of logistics procurement risk
Possible problems in international logistics are a significant supply chain risk factor
Published by Luigi Bidoia. .
Strumenti Freight Procurement Procurement Risk ManagementIn recent years, maritime transport has faced numerous significant challenges, including logistical bottlenecks, maritime strikes, and widespread port closures.
One of the most notable disruptions involved one of the world's largest container ships, which blocked the Suez Canal for over a week, severely disrupting the global supply chain. Even more impactful were the port closures due to the Covid-19 pandemic, which disrupted the mechanisms driving international sea routes. Last autumn, the climate emergency affected international maritime logistics, reducing the transit capacity of the Panama Canal due to low water levels in the canal’s reservoirs. More recently, at the beginning of 2024, navigation in the Red Sea has become increasingly difficult due to Houthi attacks on ships in transit.
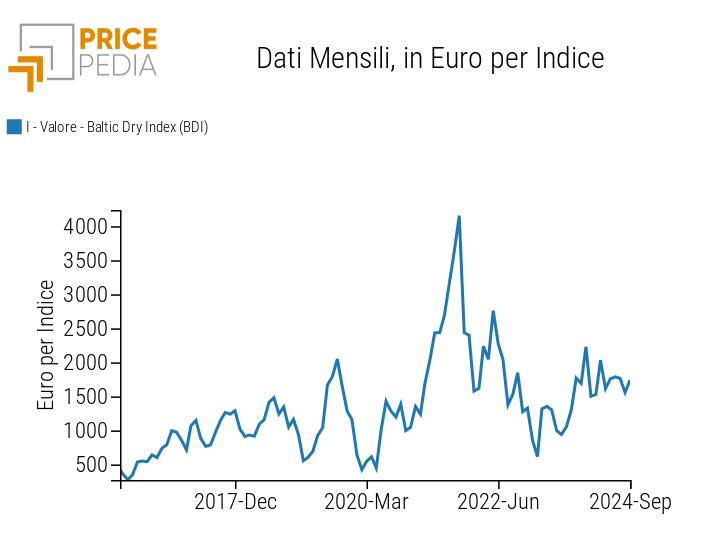
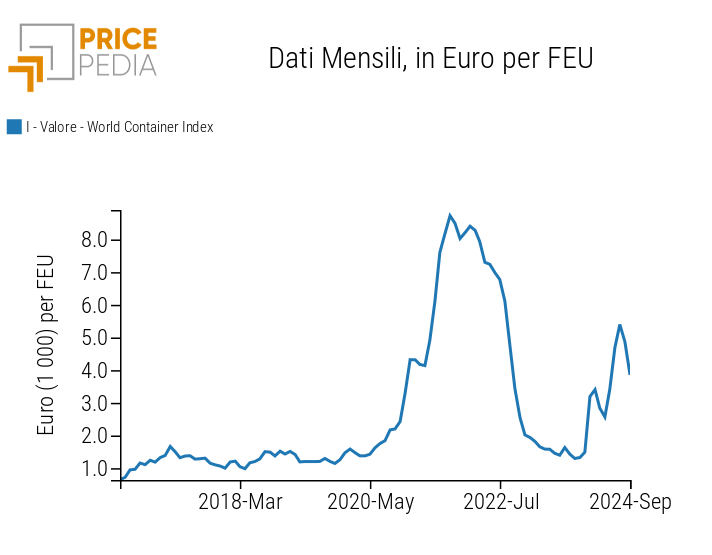
All these issues can be observed through the volatility of shipping freight rates, which have been elevated for years, as evidenced by the charts presented here, relating to the Baltic Dry Index (BDI) and the World Container Index.
Freight rates of dry bulk and container ships
| Dry bulk and ships | Container ships |

|

|
The variety and unpredictability of the events that have caused this turbulence make it difficult to foresee when and where new shocks may arise, but the risk remains tangible and likely high. In this context, it is especially useful to identify which raw materials, and more specifically the commodities imported by the EU, might be most affected by future turbulence in maritime transport routes.
A Measure of Logistic Supply Chain Risk
A measure of logistic supply risk for commodities can be obtained by combining the risk for each importing country with the importance that country holds in EU imports.
Do you want to stay up-to-date on commodity market trends?
Sign up for PricePedia newsletter: it's free!
A Measure of Country-Specific Risk
The main factor in assessing logistic risk for EU imports can logically be considered the distance in nautical miles[1] separating the loading ports of goods destined for the EU from the ports of Genoa and Rotterdam, which are taken as representative of major EU destination ports. Recent climatic and geopolitical events also suggest taking into account specific risk factors for routes passing through the Panama Canal, the Red Sea, and the Suez Canal.
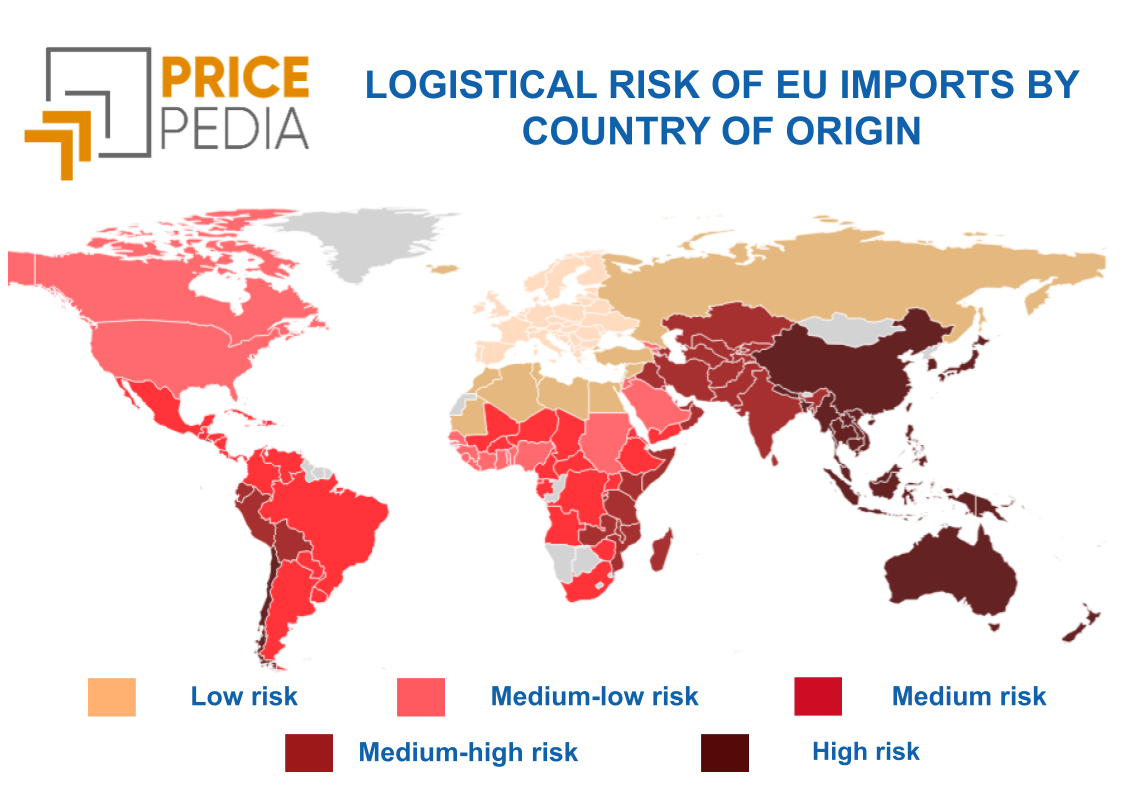
Using these criteria, we calculated a logistic risk for each country, assigning a value close to zero for countries whose exports to the EU are unlikely to face logistical barriers, and a value of 100 for countries whose distance from Europe and non-negligible risks along the route indicate higher levels of risk.
As shown in the map presented here, the countries that appear to be the most logistically risky for maritime transport to the EU include, on one side, Pacific-facing Latin American countries such as Chile and Peru, and on the other, Asian countries that are the most distant from the EU in terms of nautical miles, such as South Korea, China, and Japan, as well as countries from the Australian continent, whose routes are further burdened by risks related to the passage through the Red Sea and the Suez Canal.

A Measure for Commodities
The logistic risk for commodities was calculated by considering the share of EU imports from various countries, adjusted for the logistic risk associated with each country of origin. This measure is expressed as a score, ranging from 0 to 100, with higher values indicating greater risk.
In the table below, the quantiles of the risk score distribution for the commodity families in PricePedia are presented. The families are ordered based on the median score, represented by the Q50 quantile.
Distribution of Logistic Risk by Product Family
| PricePedia Product Families | Q10 | Q25 | Q50 | Q75 | Q90 |
|---|---|---|---|---|---|
| Food | 0.1 | 0.5 | 1.8 | 23.3 | 51.6 |
| Wood and Paper | 0.1 | 0.6 | 2.0 | 5.9 | 16.8 |
| Basic Construction Materials | 0.2 | 0.6 | 2.7 | 7.5 | 17.2 |
| Commercial | 4.5 | 6.1 | 7.5 | 25.2 | 29.9 |
| Ferrous | 0.6 | 2.9 | 9.6 | 22.6 | 33.0 |
| Energy | 0.7 | 1.6 | 10.3 | 23.7 | 34.4 |
| Plastics and Elastomers | 2.0 | 6.1 | 11.9 | 28.6 | 41.6 |
| Non-Ferrous | 2.7 | 6.2 | 13.4 | 31.7 | 58.6 |
| Chemicals: Specialty | 1.0 | 4.0 | 13.7 | 27.8 | 34.7 |
| Inorganic Chemicals | 0.9 | 4.1 | 15.3 | 33.6 | 58.8 |
| Precious | 8.0 | 8.9 | 15.5 | 21.8 | 22.3 |
| Organic Chemicals | 0.5 | 5.6 | 15.7 | 28.8 | 44.2 |
| Electrical Components | 9.7 | 16.9 | 33.6 | 43.9 | 57.9 |
| Textile Fibers | 2.0 | 13.6 | 40.0 | 74.6 | 92.1 |
| Mechanical Components | 17.8 | 24.0 | 40.3 | 51.5 | 54.1 |
| Electronic Components | 22.9 | 32.9 | 45.5 | 62.1 | 70.1 |
Based on the median Q50, the commodity family with the lowest logistic risk is Food Commodities, while the family with the highest logistic risks is Electronic Components.
Among the lower-risk families, the knowledge of the Q90 quantile (representing the score above which 10% of the distribution's cases fall) allows us to highlight that 10% of food commodities have a particularly high score, above 51.6 (the value of the Q90 quantile). Among the food commodities with the highest scores are Palm Oil (score 64.6) and Coffee (score 61.3).
Considering all quantiles, the family with the lowest logistic risk is Wood and Paper. The Q90 value shows that 90% of the commodities in this family have a very low score, below 16.8.
Similarly, among the higher-risk families, the knowledge of the Q10 quantile highlights that for Electronic Components, 90% of the goods considered have a score above 22.9, indicating that this family consists of goods that present significant logistic risks.
It is worth noting that the family with the highest levels of logistic risk is Textile Fibers, with 10% of products having a logistic risk score above 92.1. Naturally, these high-risk products include Australian merino wool and Chinese cashmere.
High logistic risks also characterize the families of Non-ferrous Metals and Inorganic Chemical Products. For both families, 10% of products have a score exceeding 58. In the first case, the metals with the highest logistic risk are Magnesium, Manganese, and Lithium. In the second case, the chemicals with the highest logistic risk are Calcium Hypochlorite, Tungstates, and Graphite, both natural and synthetic.
Conclusion
There is no doubt about the importance of an efficient global maritime logistics system to ensure the reliable supply of raw materials and essential goods to European industry.
The experience of recent years has highlighted the fragility of the global logistics system, revealing its vulnerabilities. This has led many manufacturing companies to confront the risks associated with their supply chains.
In response, various methodologies have been developed with the aim of increasing business resilience to such risks. A key element in all these methodologies is the availability of tools that enable the analysis and resources to be focused on the purchases most exposed to risk.
The methodology developed and described in this article aims to become an important component of the information system supporting logistics risk management within the supply chain.
[1] Source: PricePedia elaborations on SEA-DISTANCES.ORG


