Commodities' reaction to the rate cut
Expansionary monetary policy supports commodity prices
Published by Luca Sazzini. .
Conjunctural Indicators Commodities Financial WeekWeekly Summary of Financial Commodity Prices
This week, commodity prices continued the slight recovery seen last week.
Price increases were driven by both fears of potential supply shortages and the Federal Reserve's rate cut.
Energy commodities experienced a rise in oil prices due to:
- Supply reduction from Libya due to internal political struggles;
- Production drop in the Gulf of Mexico, which remains partially blocked after Hurricane Francine;
- Strategic oil demand from the United States, which is taking advantage of very low prices to expand its reserves by ordering futures with a maturity date in early 2025;
- A 50 basis points rate cut by the Federal Reserve.
This data has helped, at least temporarily, to counteract the downward price dynamics caused by the slowdown in Chinese demand.
Metal prices followed an upward trend that involved both industrial and precious metals, with gold hitting new all-time highs.
Among ferrous metals, the most significant rise was for wire rod traded on the Shanghai Futures Exchange (SHFE), while among non-ferrous metals, aluminum saw the biggest increase, driven by supply concerns from India.
Adverse weather conditions and pressure in a dam's collection area led to the collapse of a water storage basin at an alumina refinery of Vedanta Ltd. Although the company stated that production was not interrupted due to the incident, the news was enough to scare some speculators.
In food commodities, there were price increases for oils and especially cereals, although the latter began to decline towards the end of the week.
Tropicals reported a price drop, mainly due to the fall in cocoa prices, while significant increases were seen for sugar prices.
Federal Reserve Rate Cut
On Wednesday, September 18, the Federal Reserve (FED) opted for a 50 basis points interest rate cut.
For the first time since 2005, the FOMC decision was not unanimous, with Chair Michelle Bowman voting for a smaller 25 basis points cut.
The FED's decision surprised many analysts and economists, despite the market betting on a 50 basis points cut.
Analysts' surprise stems from the expectation of a milder first rate cut, as the U.S. economy remained relatively strong and there was no urgent need for an "aggressive" rate cut.
Chair Jerome Powell confirmed that the U.S. economy remains strong and continues to grow at a robust pace.
The recent rise in the unemployment rate is attributed to the labor force growth driven by increased immigration.
The 50 basis points rate cut is thus not due to U.S. economic weakness but to greater confidence in completing the disinflationary process.
Powell added that the Federal Reserve does not have a predetermined path, and future decisions will be closely data-driven. However, the central bank seems inclined to halt its restrictive monetary policy in favor of greater neutrality. The FED's confidence is fueled by new downward revisions of inflation forecasts, with the PCE headline projected at 2.3% for Q4 2024 and 2.1% by the end of 2025.
The PCE core for 2024 and 2025 is estimated at 2.6% and 2.2%, respectively, with a target of 2% by 2026.
U.S. Industrial Production
In August, U.S. industrial production grew more than expected, posting a 0.8% monthly increase, compared to the previous month's -0.9% due to Hurricane Beryl.
On an annual basis, there was also a slight improvement, with a slightly positive rate compared to the previous -0.74%.
ENERGY
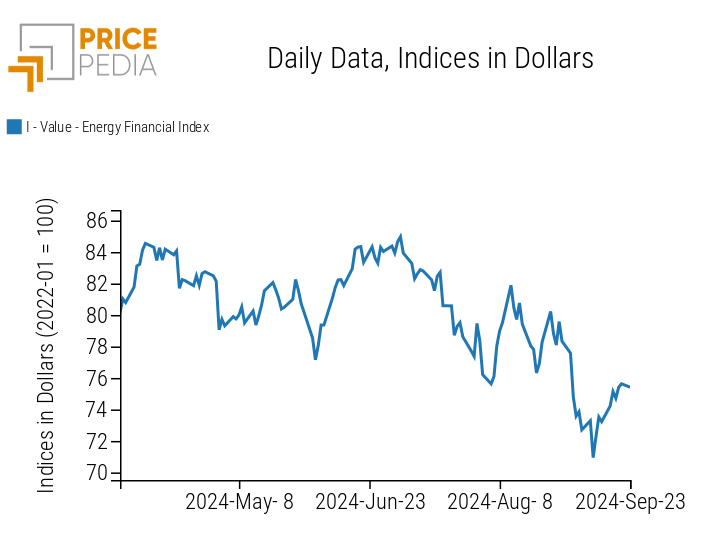
The PricePedia financial index for energy continues its recent upward swing, driven by rising oil prices.
PricePedia Financial Index of Energy Prices in Dollars
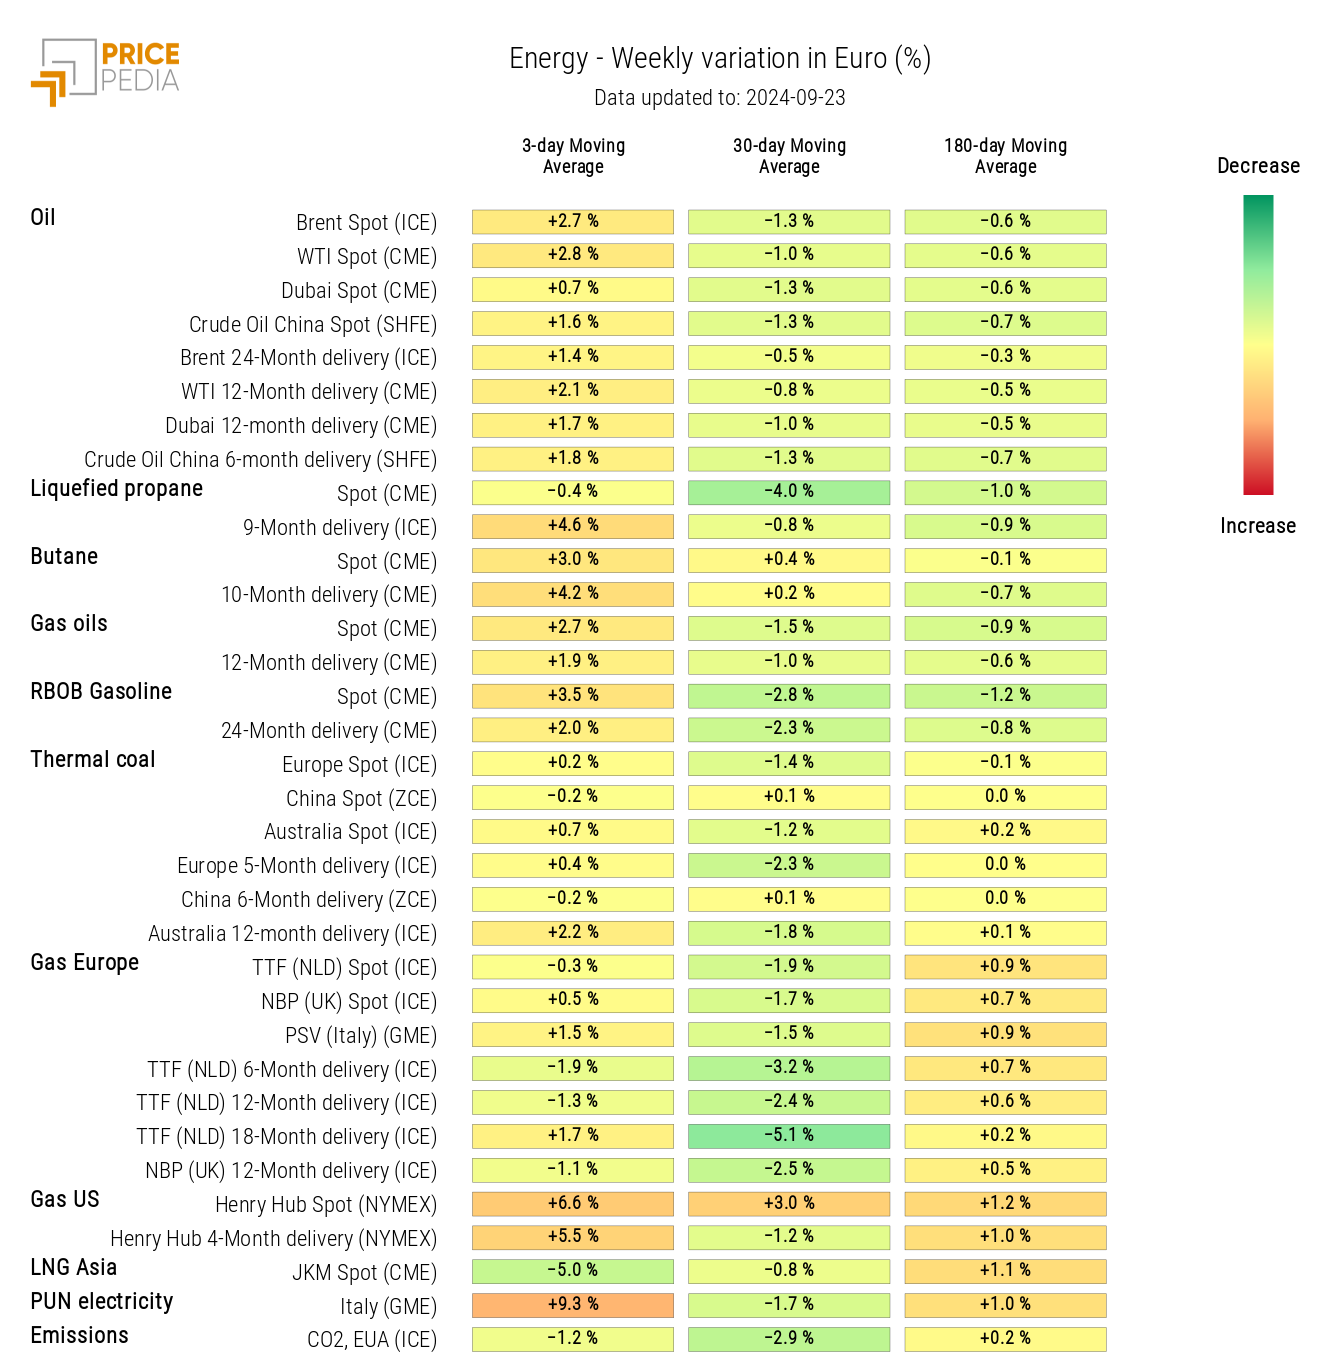
The energy heatmap shows an increase in oil and PUN prices, with a decrease in Asian natural gas prices.
HeatMap of Energy Prices in Euros
PLASTICS
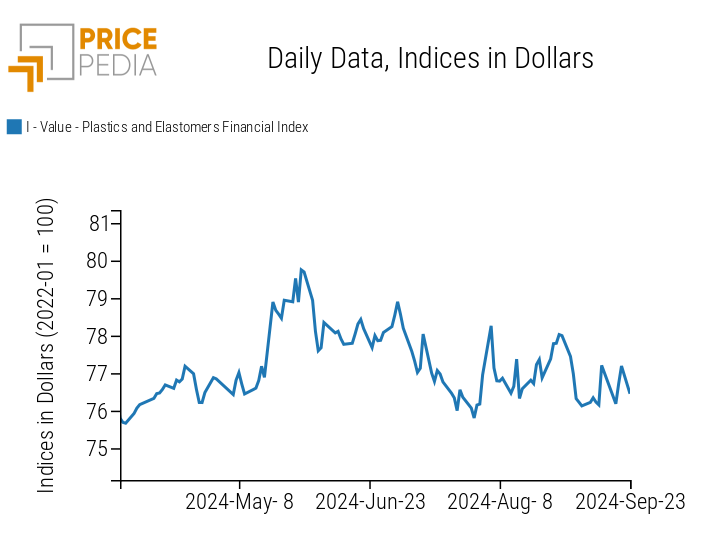
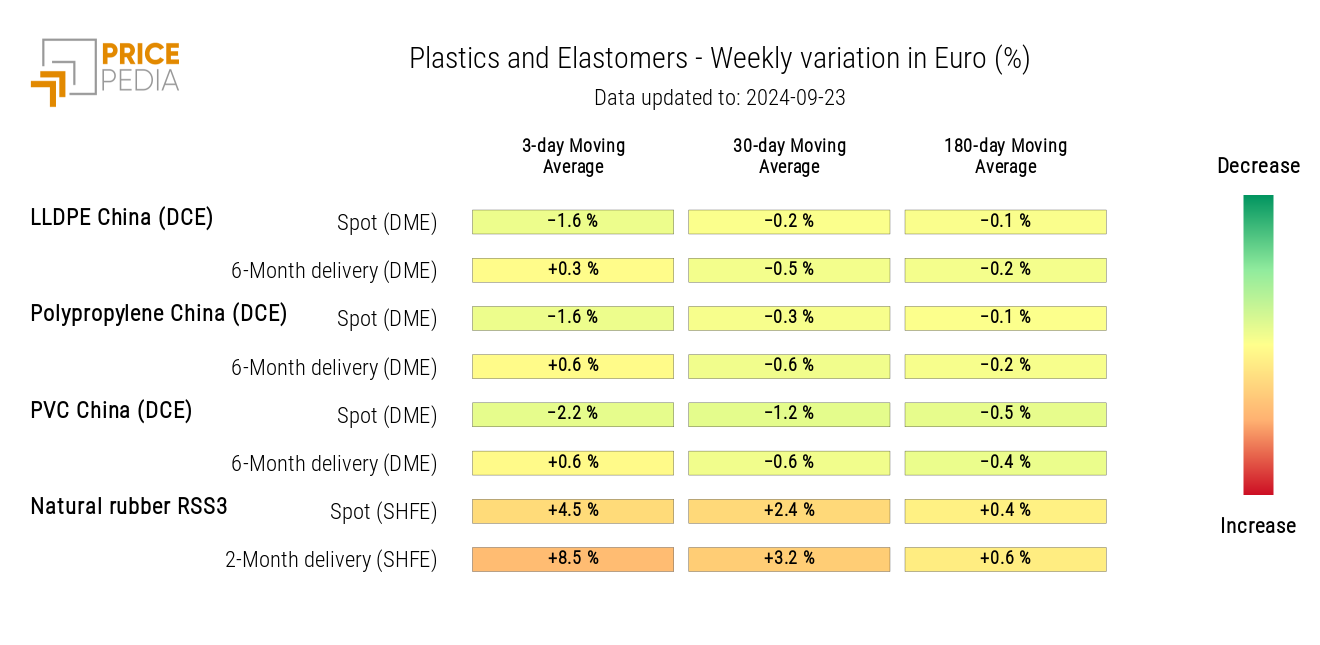
The PricePedia index of financial prices for plastics and elastomers remained relatively stable, driven by contrasting dynamics. On one hand, there was a decline in plastic prices, but on the other, rubber prices continued to rise.
PricePedia Financial Indices of Plastics Prices in Dollars
The following heatmap shows the decline in plastic prices and the rise in natural rubber RSS3 prices.
HeatMap of Plastics and Elastomers Prices in Euros
FERROUS METALS
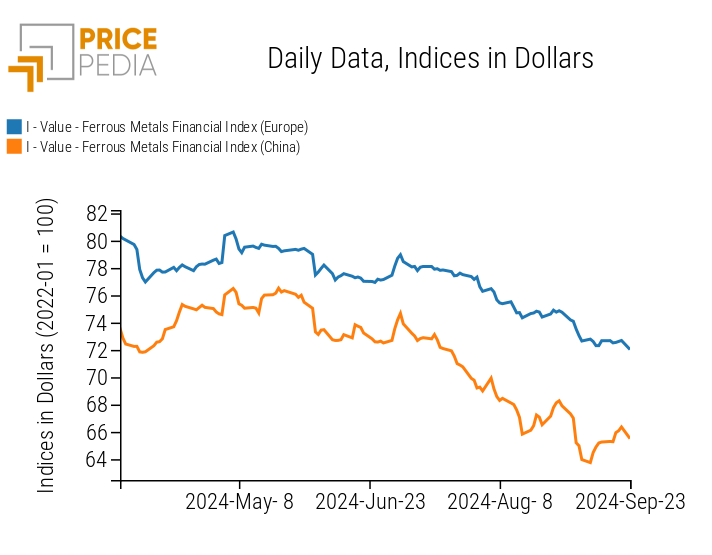
The convergence of financial indices for ferrous metals continues, with the Chinese index rising and the European one remaining relatively stable.
PricePedia Financial Indices of Ferrous Metals Prices in Dollars
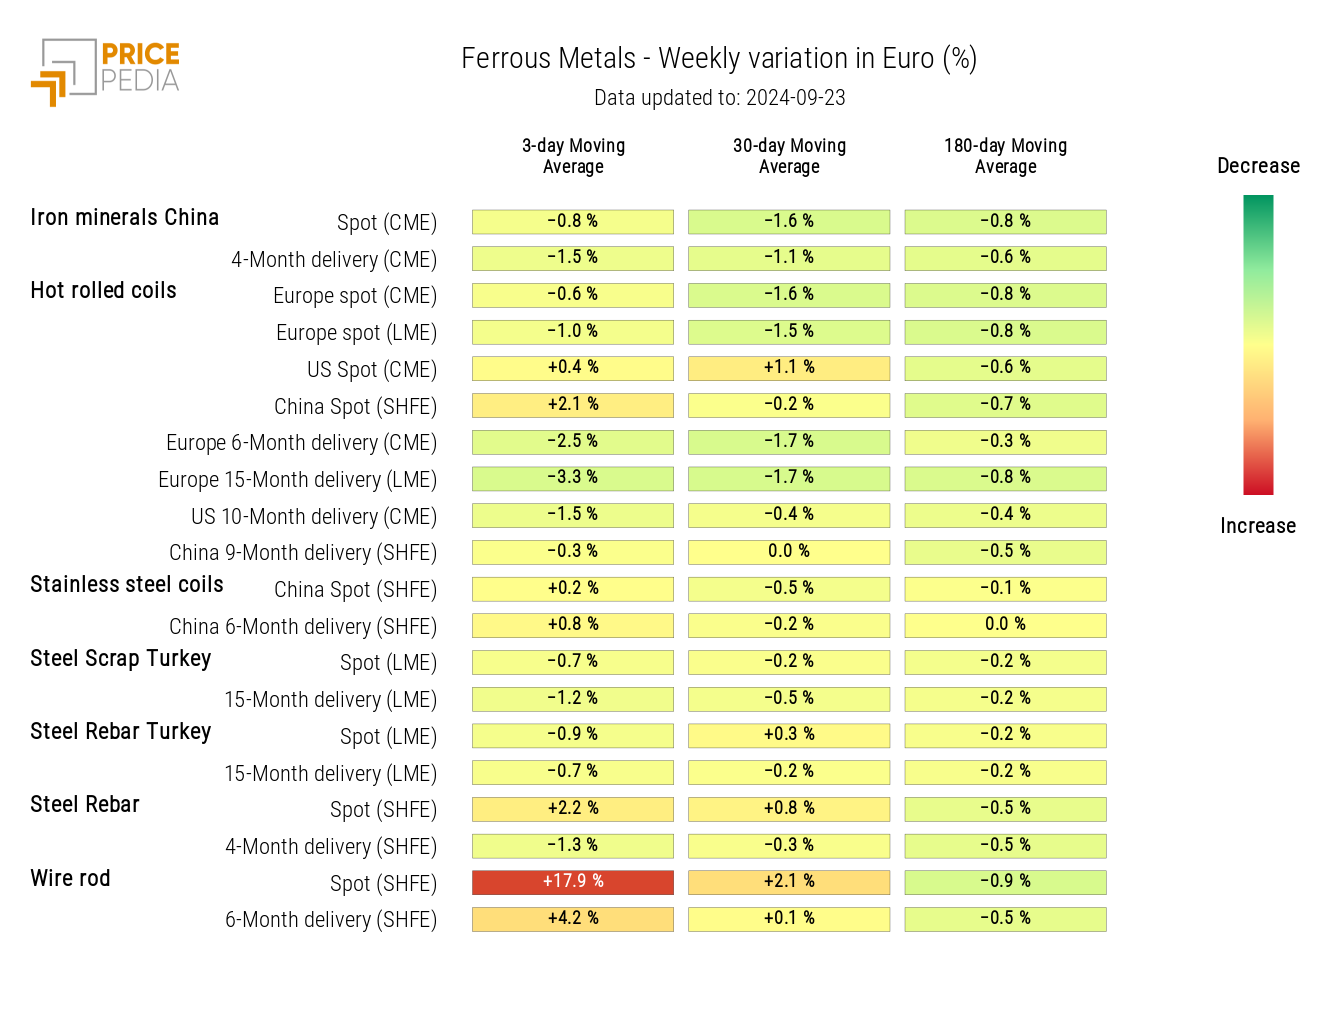
The ferrous heatmap analysis shows a rise in wire rod prices, recovering significantly from last week's price drop.
HeatMap of Ferrous Metals Prices in Euros
Do you want to stay up-to-date on commodity market trends?
Sign up for PricePedia newsletter: it's free!
NON-FERROUS INDUSTRIAL METALS
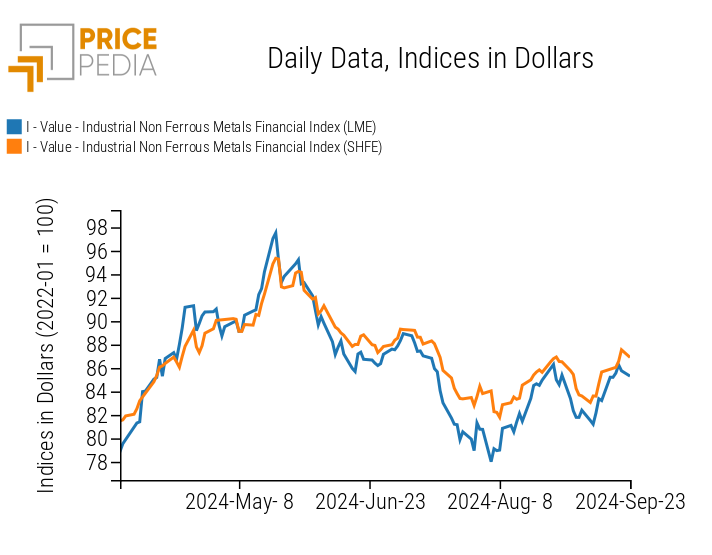
The two financial indices for non-ferrous metals continued the price recovery that began last week.
PricePedia Financial Indices of Non-Ferrous Industrial Metals Prices in USD
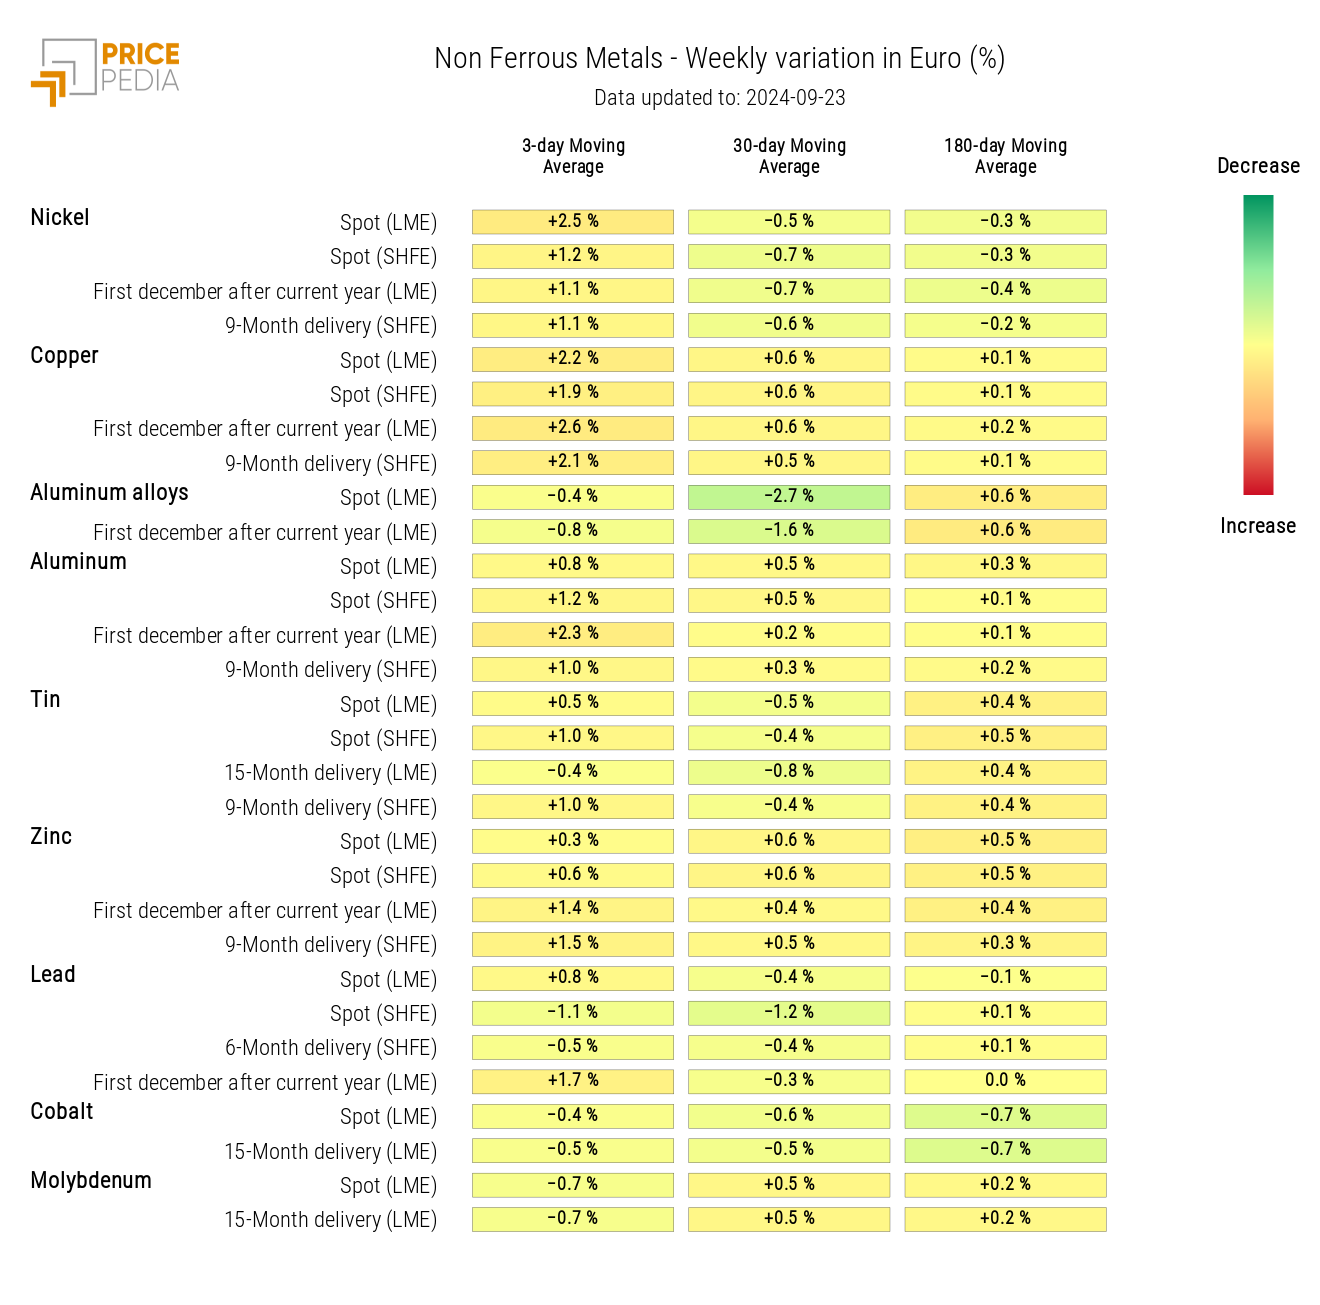
The heatmap shows a slight increase in the prices of major non-ferrous metals, including nickel, copper, aluminum, and zinc.
HeatMap of Non-Ferrous Metals Prices in EUR
FOOD
This week, the food price indices were characterized by significant fluctuations.
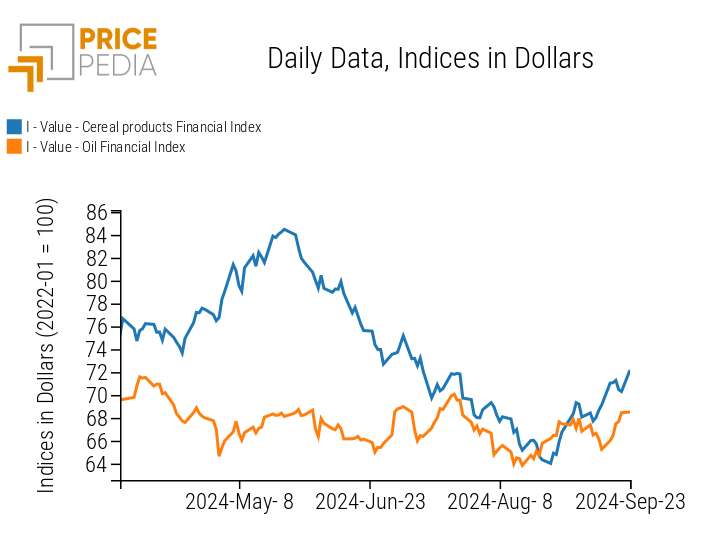
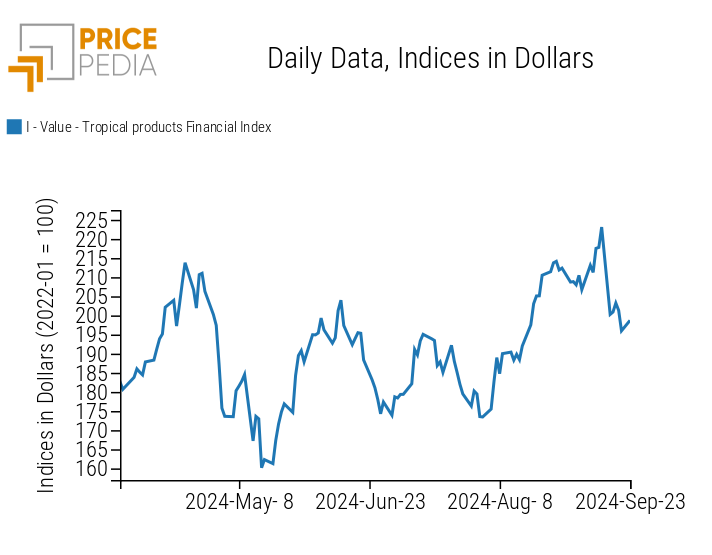
The cereals index, after recording a considerable increase, saw a slight decline in the last days of the week. The tropicals index was marked by a drop in prices, attributable to the performance of cocoa, while the oils index followed a price increase.
| PricePedia Financial Indices of Food Prices in USD | |
| Cereals and Oils | Tropicals |
|
|
CEREALS
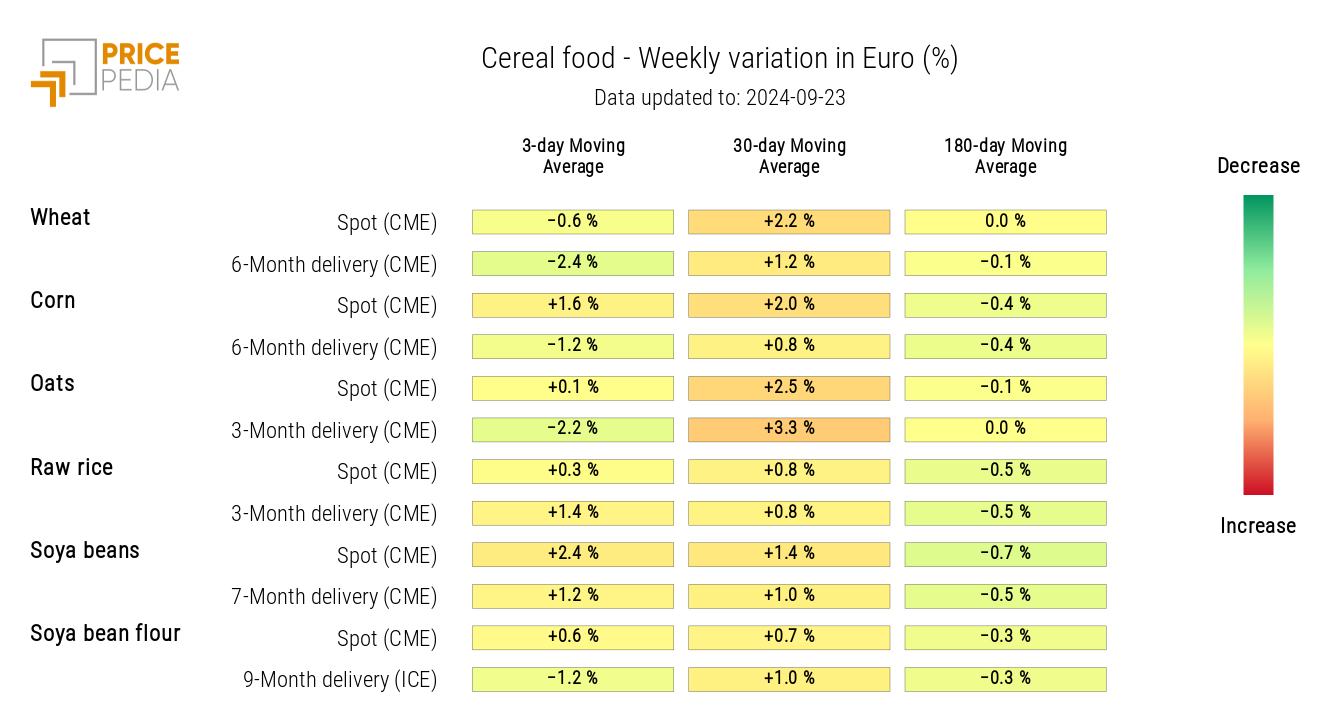
The cereals heatmap highlights a slight increase in the prices of soybeans and corn.
HeatMap of Cereals Prices in EUR
Tropicals
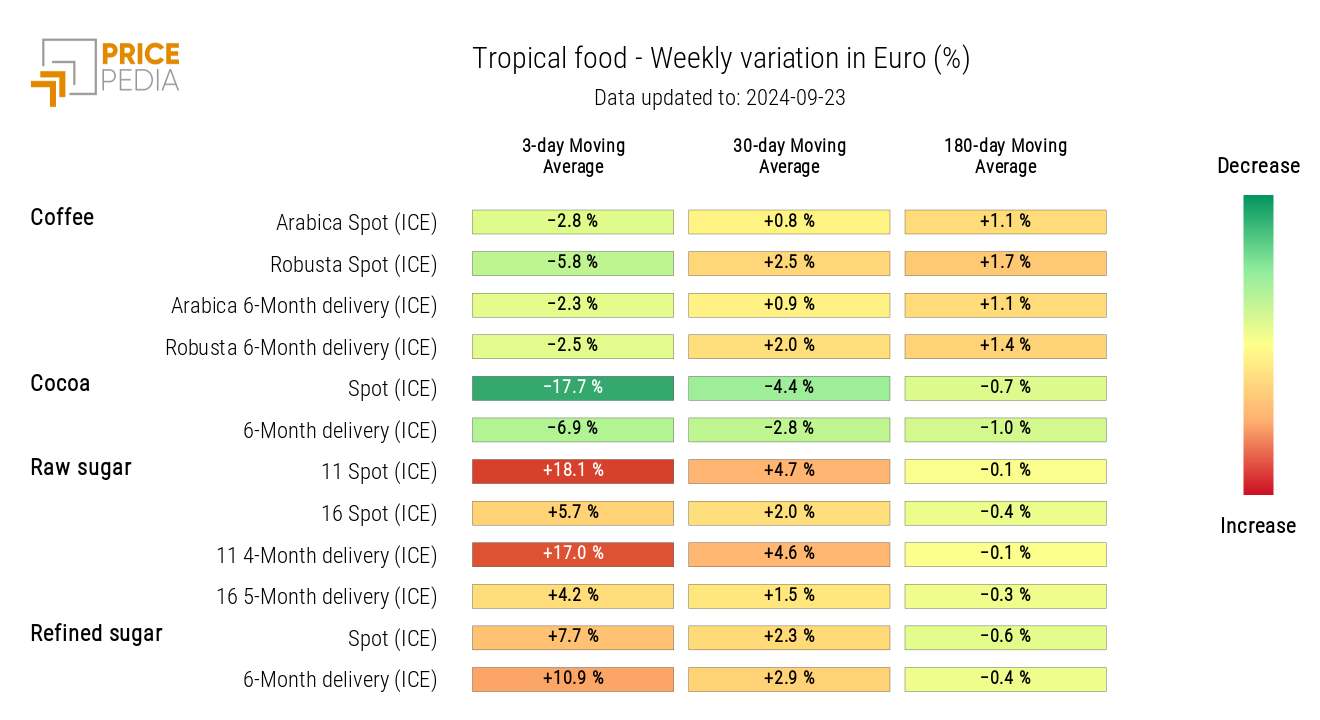
The tropicals heatmap shows in green the drop in cocoa prices and in red the rise in sugar prices.
This week, the price of cocoa in the United States collapsed from over $10,000/ton to less than $8,000/ton. This decline is due to an adjustment of the excessive positive differential that had formed over the last two months between the prices of cocoa taken from U.S. warehouses compared to those in the UK. Chocolate producers had developed the belief that lower-quality cocoa stocks had accumulated in UK warehouses, shifting demand to the U.S. market and causing a strong price divergence between the two markets.
HeatMap of Tropical Food Prices in EUR
OILS
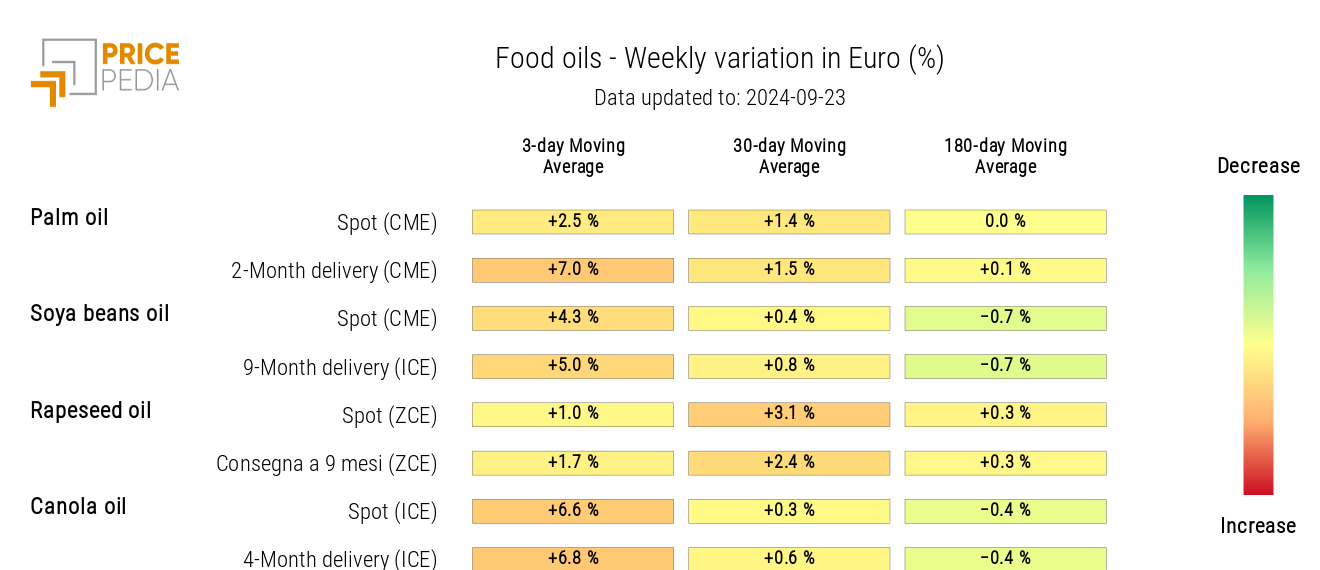
The analysis of the oils heatmap shows a general increase in the level of edible oil prices.
HeatMap of Edible Oils Prices in EUR
