Hydrocarbon energy: interconnection between physical and financial markets along the value chain
An econometric approach to estimate the extent of transmission of price changes along the hydrocarbon value chain
Published by Luca Sazzini. .
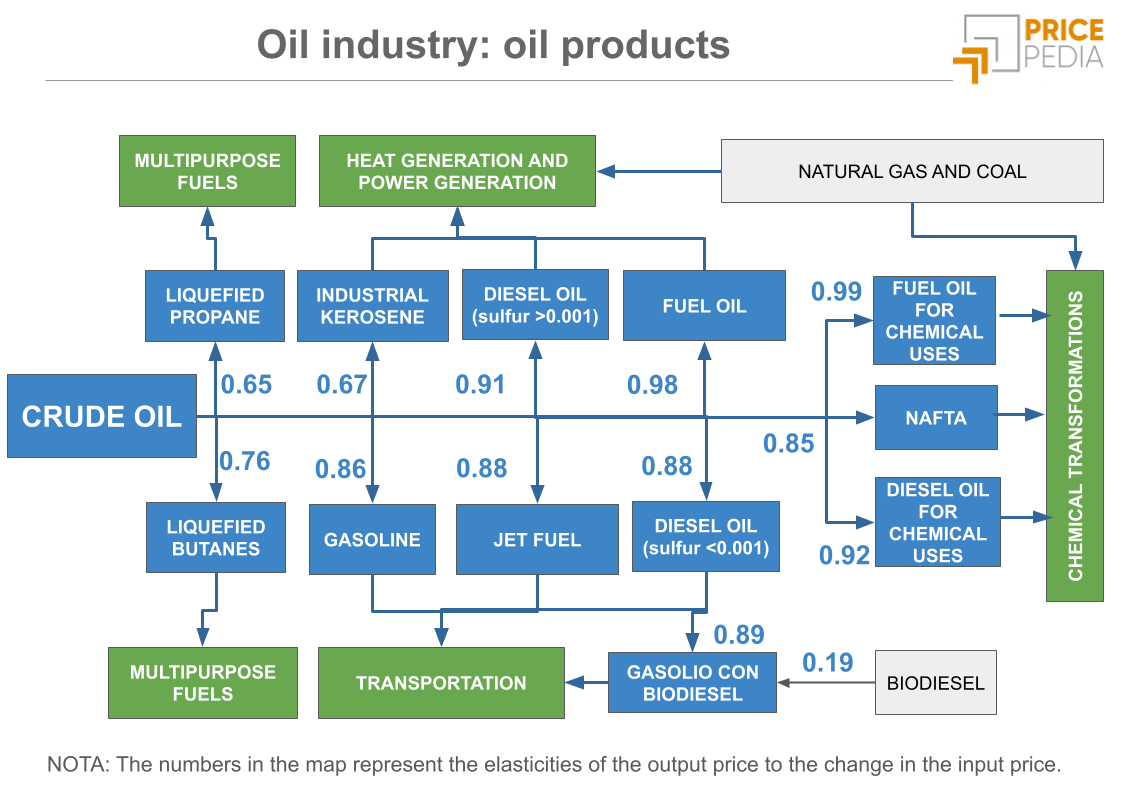
Motor spirit Gas Oils Oil Price DriversThe analysis of energy hydrocarbon prices offers the opportunity to examine the complex relationships between financial and physical markets along the production chain. This study focuses on the interconnection between financial and physical (both customs and local) prices of various hydrocarbon-derived products.
In particular, our interest is in verifying the existence of possible "distortions" or "delays" in the transmission of price changes between oil, commonly considered a "benchmark," and its main derivatives: gasoline, diesel, and fuel oil.
Transmission of price changes along the production chain
To analyze the intensity and timing of cost transmission along the energy hydrocarbon chain, we conducted a regression between the financial prices of Brent oil, traded on the Intercontinental Exchange (ICE), and the financial prices of gasoline and diesel, traded on the Chicago Mercantile Exchange (CME).
We used the Engle and Granger model, which involves a two-step procedure to examine long-term and short-term relationships between variables. In the first stage, the long-term relationship is estimated, representing the structural link between the variables considered. In the second stage, an error correction model is applied, which captures short-term adjustment dynamics, showing how actual values realign with the "theoretical" long-term values.
To enhance understanding of the results, the variables were transformed into logarithms, allowing the coefficients to be interpreted as elasticities. This means that the estimated coefficients represent the percentage change in the dependent variable in response to a percentage change in the independent variables.
The table below presents the short- and long-term regression results for the financial prices of gasoline and diesel.
| Table of regression results between financial prices of oil derivatives and Brent | |||
| Derivative | Long Beta | Impact | ECM |
| Gasoline (CME): | 0.95 | 1.2 | -0.19 |
| Diesel (CME): | 1 | 0.82 | -0.13 |
The financial prices of gasoline and diesel are closely linked to Brent's price trends. In particular, for diesel, the long-term beta was estimated at one, indicating that diesel's dynamics perfectly follow those of oil. A 10% increase in oil prices leads, on average, to a 10% increase in diesel prices. For gasoline, the elasticity is also high, at 0.95, meaning that a 10% increase in Brent prices will lead to about a 9.5% increase in gasoline prices in the long run.
The impact of oil price changes is almost entirely transferred to its derivatives in the first period.
For gasoline, there is even an over-adjustment phenomenon in the first period, with a shock coefficient greater than one. In the case of diesel, the shock estimate is 0.82, indicating that 82% of long-term determinants are immediately reflected in short-term diesel price changes.
This preliminary analysis shows that there are no significant delays in price transmission along the energy hydrocarbon chain. Oil price changes are promptly and almost fully reflected in the prices of petroleum derivatives.
Relationship between financial and physical prices
To analyze the level of interconnection between financial and physical hydrocarbon markets, physical prices were regressed against their corresponding financial prices. As in the previous estimates, the Engle and Granger method was used with a logarithmic transformation of the various variables to interpret the coefficients as elasticities.
Gasoline
The following table presents the estimation results of physical gasoline prices regressed against the financial price quoted on the CME. Three EU customs prices corresponding to three types of gasoline with different RON[1] values and the Italian retail price recorded by the Ministry of the Environment and Energy Security were considered among the physical prices.
| Table of regression results for physical gasoline prices | |||
| Derivative | Long Beta | Impact | ECM |
| EU Customs Gasoline (RON<95): | 0.94 | 0.61 | -0.83 |
| EU Customs Gasoline (RON: 95-98): | 1 | 1 | -0.9 |
| EU Customs Gasoline (RON>98): | 0.92 | 0.78 | -0.75 |
| Italian Retail Gasoline : | 0.74 | 0.54 | -0.32 |
The long-term EU customs gasoline prices are explained by financial price trends. Elasticity coefficients (beta) are always above 0.9, and the first-period impact is significant, especially for gasoline with RON between 95 and 98.
Analyzing the estimate results for gasoline recorded at Italian retail stations reveals a relatively low price elasticity compared to customs markets. The shock variable estimate is also relatively low, indicating that only about half of the financial price variation is transferred to the retail price in the first period. The speed of adjustment of the Error Correction Model is also relatively slow, at -0.32. These data indicate that gasoline prices recorded at Italian retail stations are only partially explained by financial price trends. In particular, a 10% decrease in financial gasoline prices results in only a 7.4% decrease in pump prices. This constant gap between retail and financial prices represents the distributors' margin.
It is worth noting that the price recorded at retail stations is already net of excise duties and VAT, so the difference is attributable to the margin applied by distributors. This margin tends to behave as a constant, independent of input cost variations, explaining why retail prices adjust only partially to financial market fluctuations.
Do you want to stay up-to-date on commodity market trends?
Sign up for PricePedia newsletter: it's free!
Diesel
The following table presents the estimation results of physical diesel prices regressed against the financial price quoted on the CME.
| Regression results table for diesel physical prices | |||
| Derivative | Long-term Beta | Impact | ECM |
| EU customs diesel (sulfur < 0.001%): | 0.98 | 1 | -0.7 |
| EU customs diesel (sulfur: 0.001%-0.002%): | 0.97 | 1.4 | -0.69 |
| EU customs diesel (sulfur: 0.002%-0.01%): | 0.97 | 1 | -0.67 |
| Italian distribution diesel (for automotive): | 0.76 | 0.7 | -0.27 |
| Italian distribution diesel (for heating): | 0.72 | 0.76 | -0.1 |
For customs prices, the table analysis shows elasticity coefficients very close to unity, indicating that the European customs diesel market is perfectly interconnected with the financial market. Changes in financial diesel markets almost instantly affect the European customs market, transferring almost entirely the financial market changes to customs markets.
In the case of diesel, there is also a significant difference in the estimation results for diesel prices recorded at Italian distributors. Retail prices adjust by about 75% relative to changes recorded in financial markets. These constant long-term differences are consistent with the margin applied by Italian distributors. In this case, too, distributor prices are already net of additional cost components such as VAT and excise duties.
Fuel Oil
To verify the impact of production inputs on fuel oils, we regressed physical market prices against the financial price of crude oil.
The table below shows the long- and short-term estimation results using the Engle and Granger econometric model.
| Regression results table for fuel oil physical prices | |||
| Derivative | Long-term Beta | Impact | ECM |
| EU customs fuel oil (sulfur < 0.1%): | 1 | 1 | -0.88 |
| EU customs fuel oil (sulfur: 0.1%-0.5%): | 0.95 | 1 | -0.69 |
| EU customs fuel oil (sulfur > 0.5%): | 0.88 | 0.89 | -0.4 |
| Italian distribution fuel oil (dense): | 0.98 | 0.76 | -0.03 |
| Italian distribution fuel oil (fluid): | 0.72 | 0.76 | -0.1 |
The regression outputs reveal a high interconnection between the crude oil financial market and the European customs fuel oil market. A price change in the oil market is almost fully transferred to the European customs market from the first period. The elasticity coefficients demonstrate an almost perfect interconnection between the two markets, as they are all close to unity.
The only long-term beta coefficient that is relatively low is for fluid fuel oil at Italian distributors. The reason is again attributed to the margin applied by Italian distributors.
It is interesting to note, conversely, how the long-term coefficient for dense fuel oil in response to crude oil price changes is close to 1. This product is the least refined one obtained from crude oil distillation. Its average price level, including commercial margins, is very similar to the crude oil price level. In this case, changes in crude oil prices tend to translate into equivalent changes in the derivative's price.
Conclusions
The European customs prices of energy hydrocarbons are entirely explained by the trends in their respective financial prices, which depend almost exclusively on crude oil price trends. The elasticity coefficients between customs and financial prices are close to unity, indicating a strong connection between financial and European customs markets.
Conversely, prices recorded at Italian distributors, net of VAT and excise duties, showed long-term elasticity coefficients with respect to financial prices significantly below 1. A 10% change in crude oil price tends to result, even before excise duties, in a change in the derivative price limited to 7.5%.
This difference reflects the effect of relatively constant distribution margins over time.
[1] RON stands for Research Octane Number, which is an index that measures gasoline's resistance to autoignition or spontaneous detonation during compression in the engine. The higher this number, the greater the gasoline's resistance to autoignition.
You may be interested in:
From oil to petroleum products: the energy supply chain
Published by Luigi Bidoia. .
Oil Cost pass-throughUn’analisi econometrica della trasmissione dei prezzi del petrolio ai prodotti derivati [ Read all ]

Gas oils: between cost effects and renewable alternatives
Published by Pasquale Marzano. .
Gas Oils Petrolchimica Biofuels Price DriversBiodiesel contributes to determining the prices of petroleum derivatives [ Read all ]

Favorable commodity price scenario for purchasing departments
Published by Pasquale Marzano. .
Copper Forecast Oil ForecastScenario PricePedia di Settembre 2024 [ Read all ]