China's recovery measures push up industrial metal prices
Saudi Arabia prepares to increase oil supply
Published by Luca Sazzini. .
Conjunctural Indicators Commodities Financial WeekWeekly Summary of Financial Commodity Prices
This week, commodity prices were strongly influenced by the latest weekly news.
The first of these concerns Saudi Arabia's intention to increase oil supply starting in December 2024.
Saudi Arabia is determined to reverse the recent production cuts imposed by OPEC+ and increase its oil extraction by an additional 83,000 barrels per day.
This news was followed by another regarding the resumption of oil production in Libya, due to a "compromise" reached between the two governments on the central bank leadership.
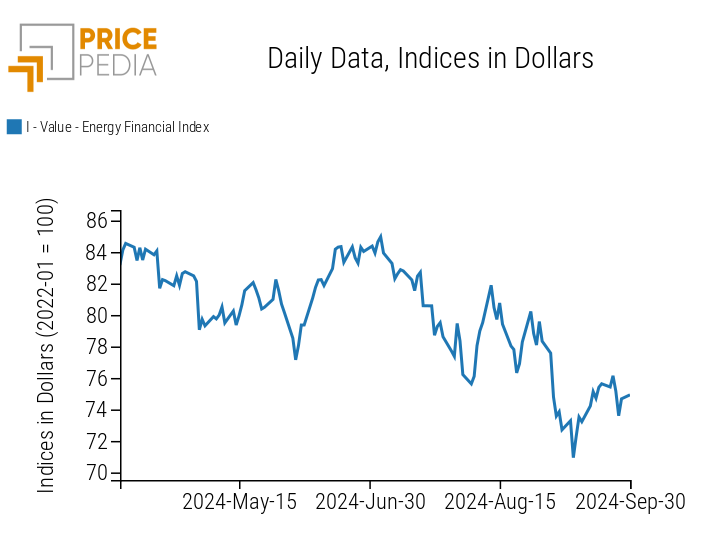
These two announcements led to a decrease in financial oil prices, which are currently hovering around $70 per barrel.
Other weekly news impacting commodity prices includes new support measures from China to boost domestic demand and the real estate sector.
The People's Bank of China, in addition to implementing larger-than-expected interest rate cuts, has enhanced its refinancing program for banks, providing 100% of the necessary capital for bank loans granted to SOEs (State-Owned Enterprises) to purchase unsold real estate properties. This is complemented by further support for second-home purchases, which now require a 15% down payment, compared to the previous 25%.
Overall, these measures have supported the recovery of financial prices for industrial ferrous metals, especially non-ferrous ones.
Among the latter, the price of copper at the Chicago Mercantile Exchange (CME) has risen above $10,000 per ton. Copper, in fact, has not only been bolstered by recent Chinese measures but has also seen increases due to reduced stockpiles on the Shanghai Futures Exchange (SHFE) and operational suspensions at the Kansanshi mine in Zambia following a fatal accident.
Significant increases have also been seen in precious metals, with the price of gold reaching new all-time highs due to rising geopolitical risks in the Middle East and the Federal Reserve's (FED) 50 basis point rate cut.
In the food sector, there has been a general price increase, despite a slight drop in cereals and oils on Thursday.
PMI
Eurozone
The preliminary data for the September Flash Purchasing Managers' Index (PMI) indicate a contraction in the eurozone economy.
The composite PMI fell to 48.9, down from 51 points the previous month and below analysts' forecasts, which had estimated it at 50.6. For the first time since January 2024, the composite PMI has fallen below the 50-point threshold, which represents the line between economic expansion and contraction. The decline is attributed to both the crisis in the manufacturing sector, which hit its lowest level of the year, and a slowdown in the services sector.
The manufacturing PMI dropped to 44.8, down by one point compared to August and below analysts' expectations, who had predicted it at 45.7.
Although still above 50 points, the services PMI also decreased, reaching 50.5. While indicating modest growth, the services sector is slowing down compared to August (52.9) and analysts' estimates (52.3).
These data suggest a general slowdown in the European economy, with a manufacturing sector in strong contraction. Analysts remain pessimistic for the coming months, particularly regarding the manufacturing sector.
USA
The flash PMI data for the United States in September indicate slower economic growth than expected.
The composite PMI dropped from 54.6 to 54.4, still exceeding expectations (54.3) and remaining above the 50-point threshold.
The manufacturing sector remains the weakest point, with a flash PMI of 47. This figure not only indicates a contraction in the sector but also reflects a decline from the previous month (47.9) and analysts' predictions (48.6).
On the other hand, the services sector continues to drive the U.S. economy, with a flash PMI of 55.4.
Although slightly lower than the previous month's figure (55.7), this is still positive, as it remains above both the 50-point threshold and analysts' expectations (55.3).
U.S. Inflation
In August, U.S. inflation continued to decline, supporting the argument that the Federal Reserve is on the right path to bringing annual inflation down to the 2% target.
The PCE index, the FED's preferred measure of inflation, increased by 2.2% y/y in August. The index was below expectations of 2.3% y/y and showed a decline from the previous month (2.5% y/y).
The core index rose to 2.7% y/y, as expected by analysts. Although this represents an increase from last month (2.6% y/y), forecasts estimate a decline that will bring it to 2%.
Furthermore, on a monthly basis, the core PCE index shows a growth of 0.1% m/m, lower than the previous month (0.2% m/m) and analysts' expectations (0.2% m/m).
ENERGY
The PricePedia financial energy index reversed its trend following the decrease in oil prices.
PricePedia Financial Index of Energy Prices in Dollars
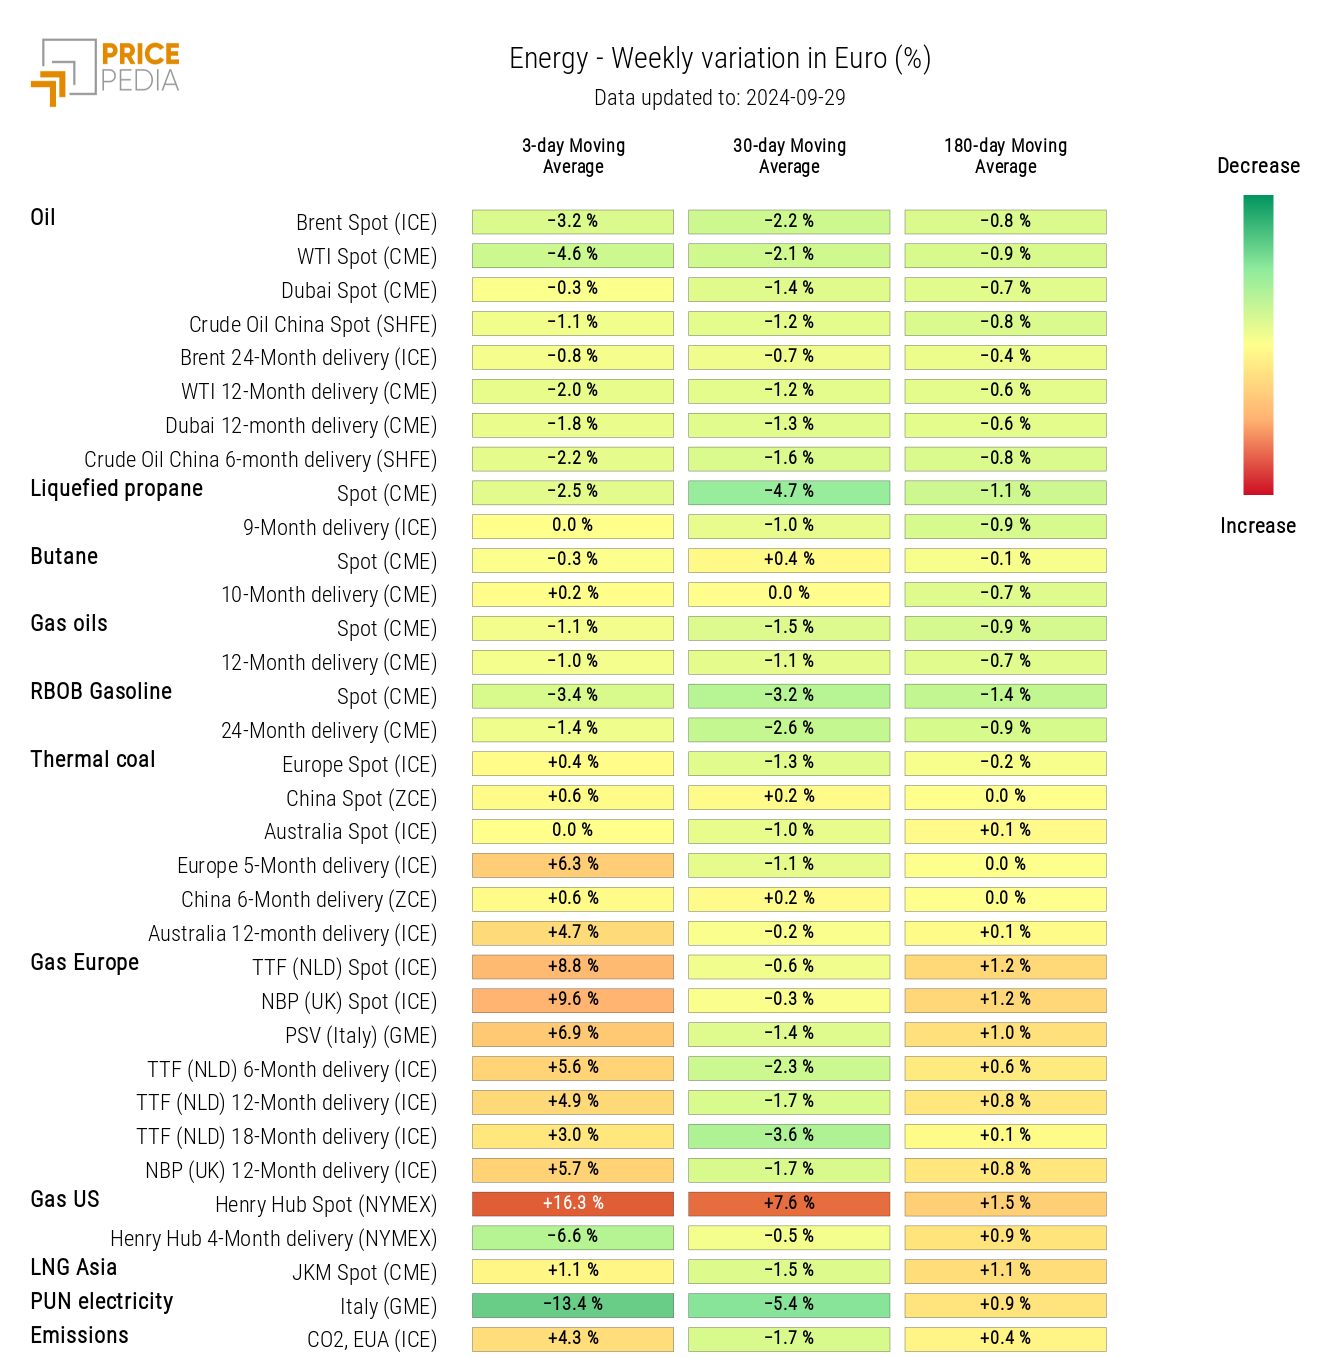
The energy heatmap shows a decline in oil prices, alongside an increase in natural gas prices.
The rise in TTF Dutch gas prices is due to the shutdown of gas plants in Norway and the forecast of colder weather in parts of Europe through early October, which has boosted demand for European gas for heating.
The increase in Henry Hub prices is attributed to supply risks caused by Hurricane Helene, which disrupted natural gas production in the Gulf of Mexico.
HeatMap of Energy Prices in Euro
PLASTICS
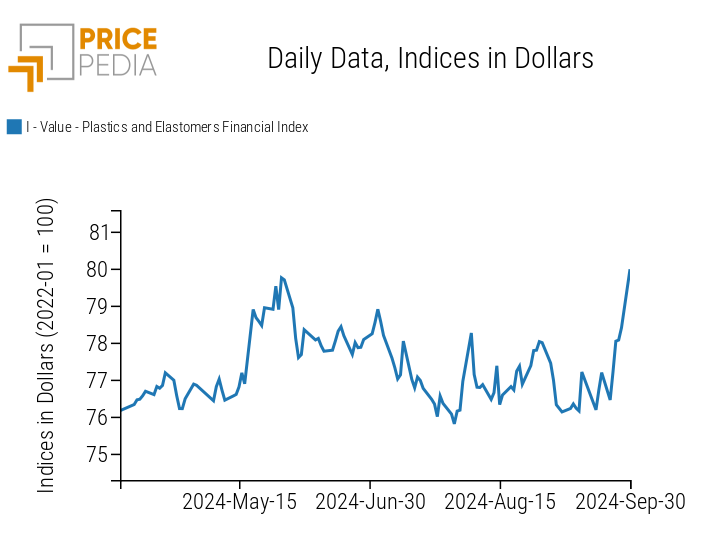
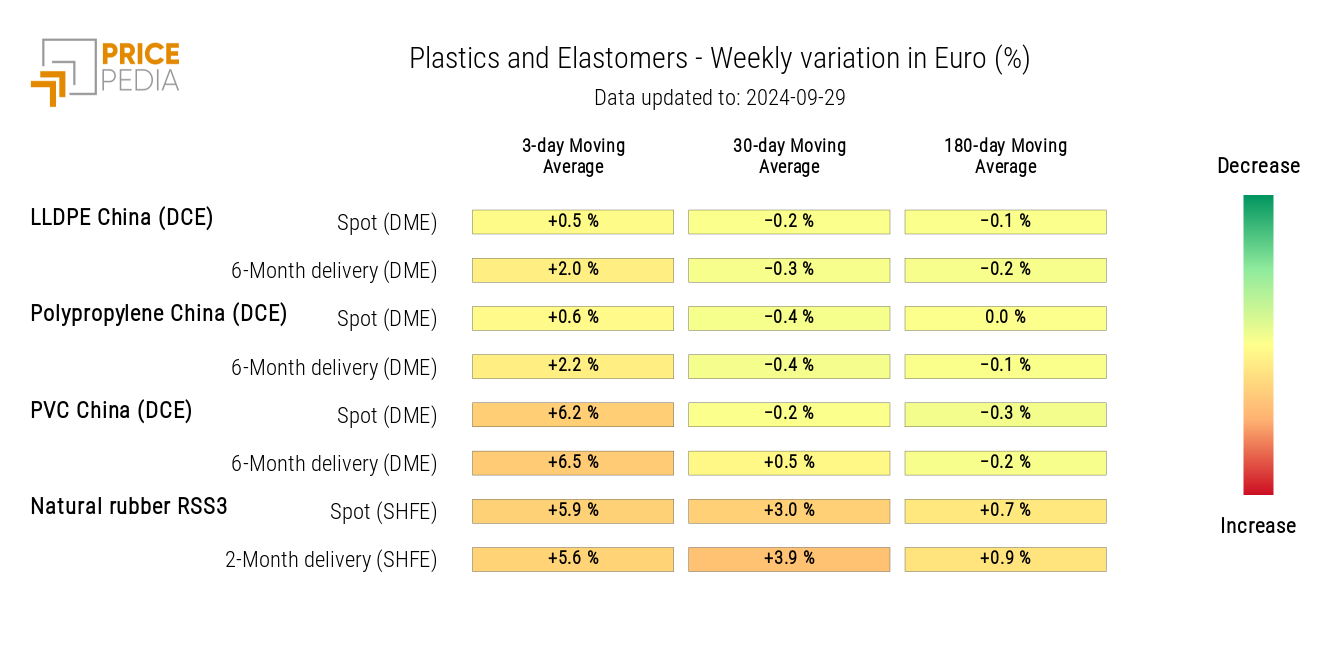
The PricePedia financial index of plastics and elastomers prices recorded a rise following recent fluctuations.
PricePedia Financial Indices of Plastics Prices in Dollars
The heatmap below shows an increase in PVC China prices and natural rubber RSS3.
HeatMap of Plastics and Elastomers Prices in Euro
FERROUS METALS
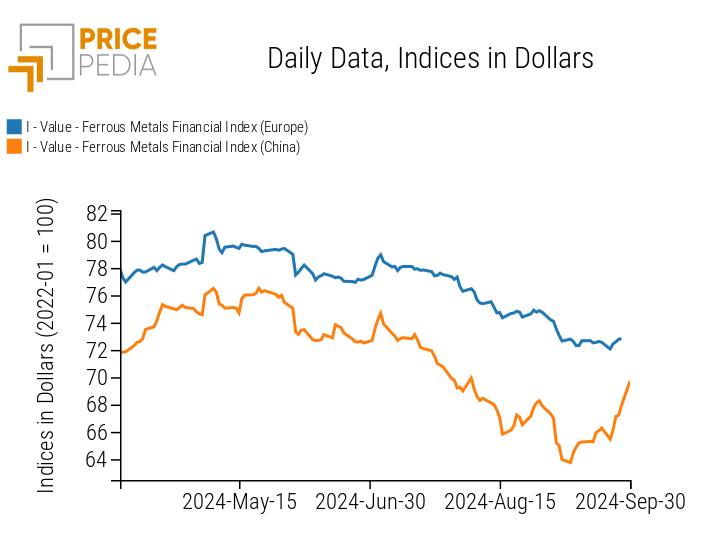
The financial index for Chinese ferrous metals shows a price increase, while the European index remains more stable.
PricePedia Financial Indices of Ferrous Metals Prices in Dollars
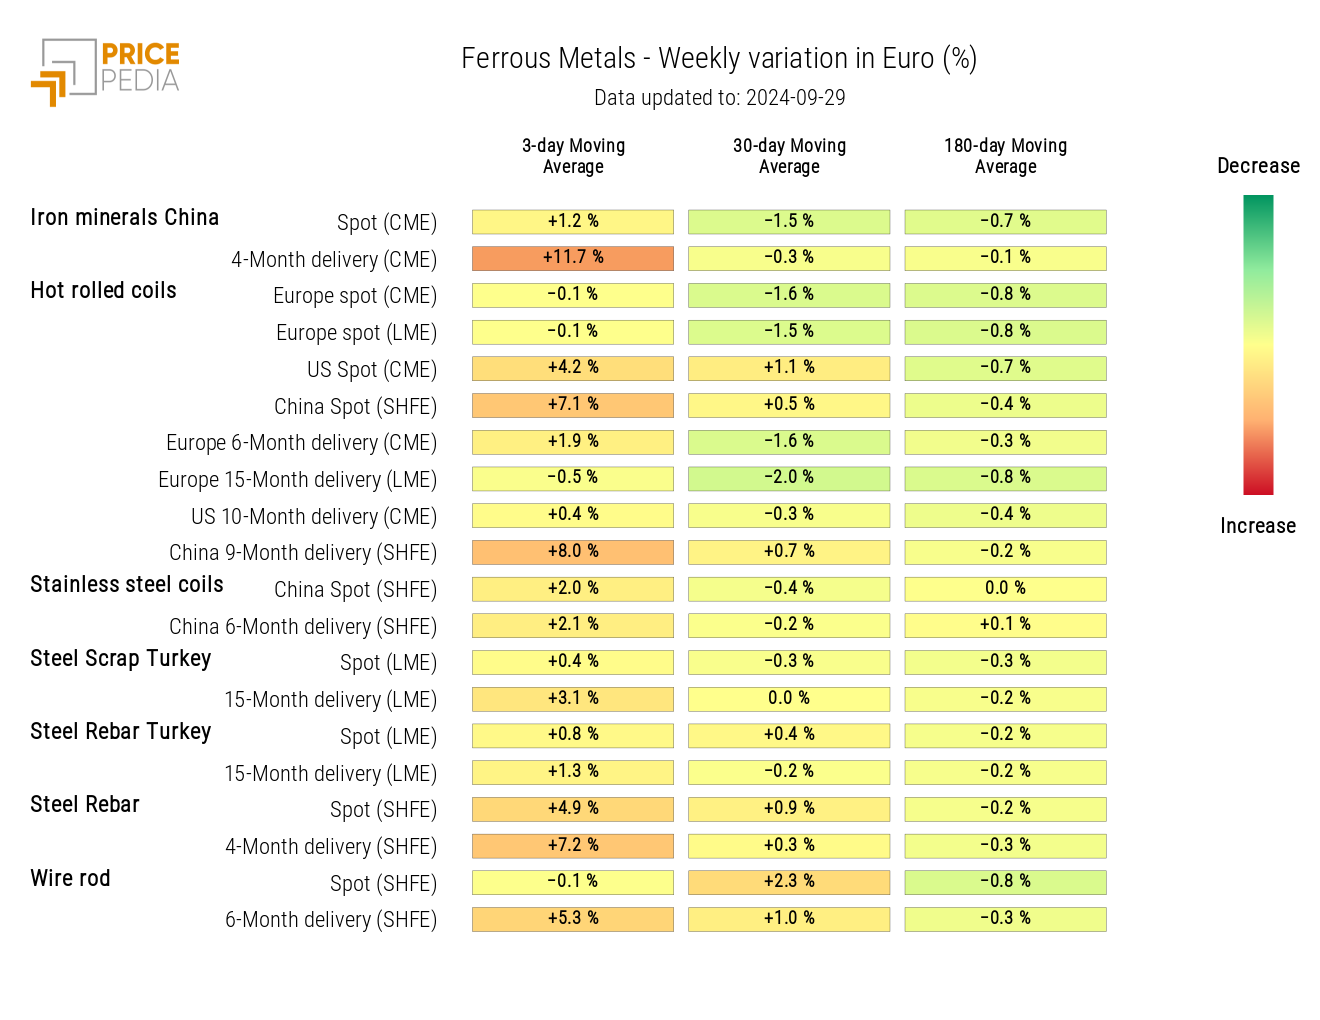
The ferrous heatmap analysis shows an increase in hot-rolled coils prices in China and steel rebars, both quoted on the Shanghai Futures Exchange (SHFE).
HeatMap of Ferrous Prices in Euro
Do you want to stay up-to-date on commodity market trends?
Sign up for PricePedia newsletter: it's free!
INDUSTRIAL NON-FERROUS METALS
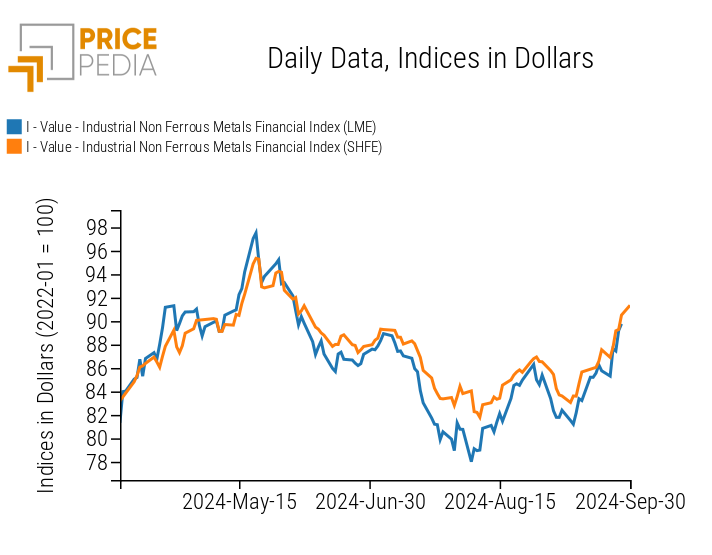
Both financial indices of non-ferrous metals continue to strengthen their upward trend.
The dynamic is driven by both the reduction in SHFE market inventories and the new stimuli introduced by China to boost domestic demand recovery.
PricePedia Financial Indices of Non-Ferrous Industrial Metals Prices in USD
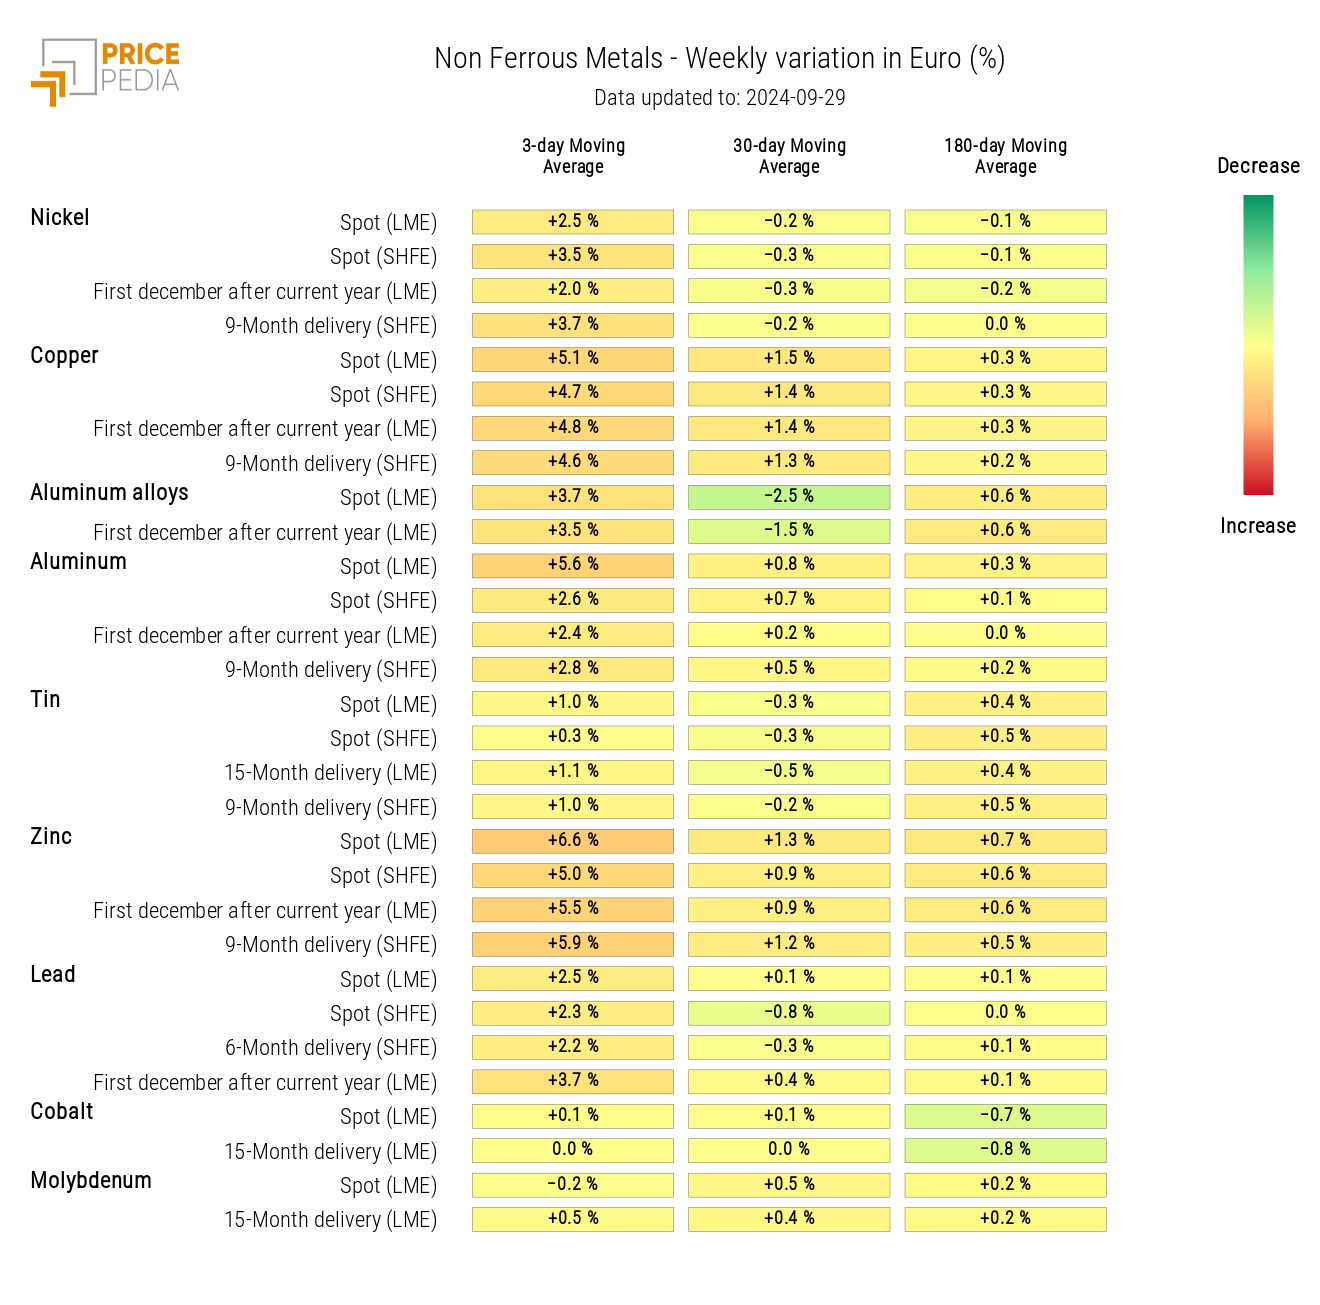
The heatmap below shows an increase in the prices of almost all non-ferrous metals. Notable increases include copper, zinc, nickel, and lead.
HeatMap of Non-Ferrous Prices in Euro
FOOD PRODUCTS
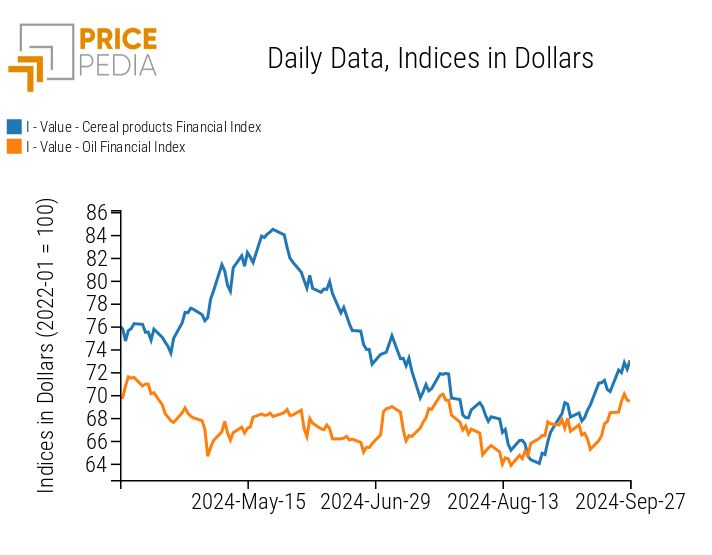
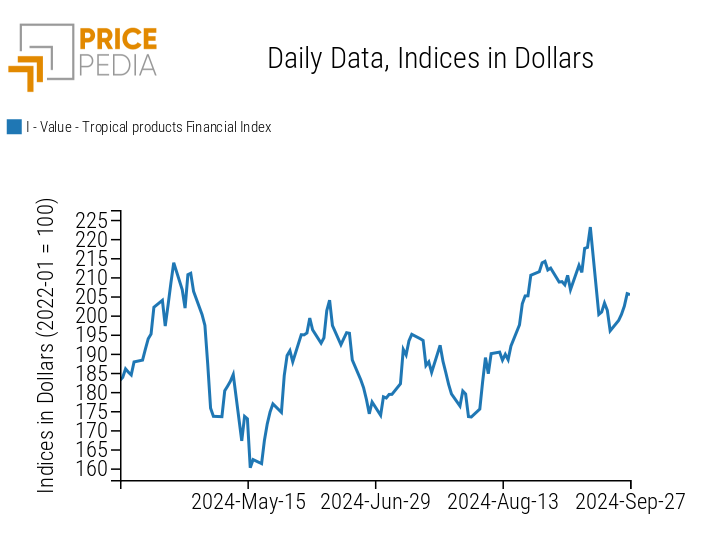
This week, food indices were characterized by rising prices.
| PricePedia Financial Indices of Food Prices in USD | |
| Cereals and Oils | Tropical Foods |
|
|
CEREALS
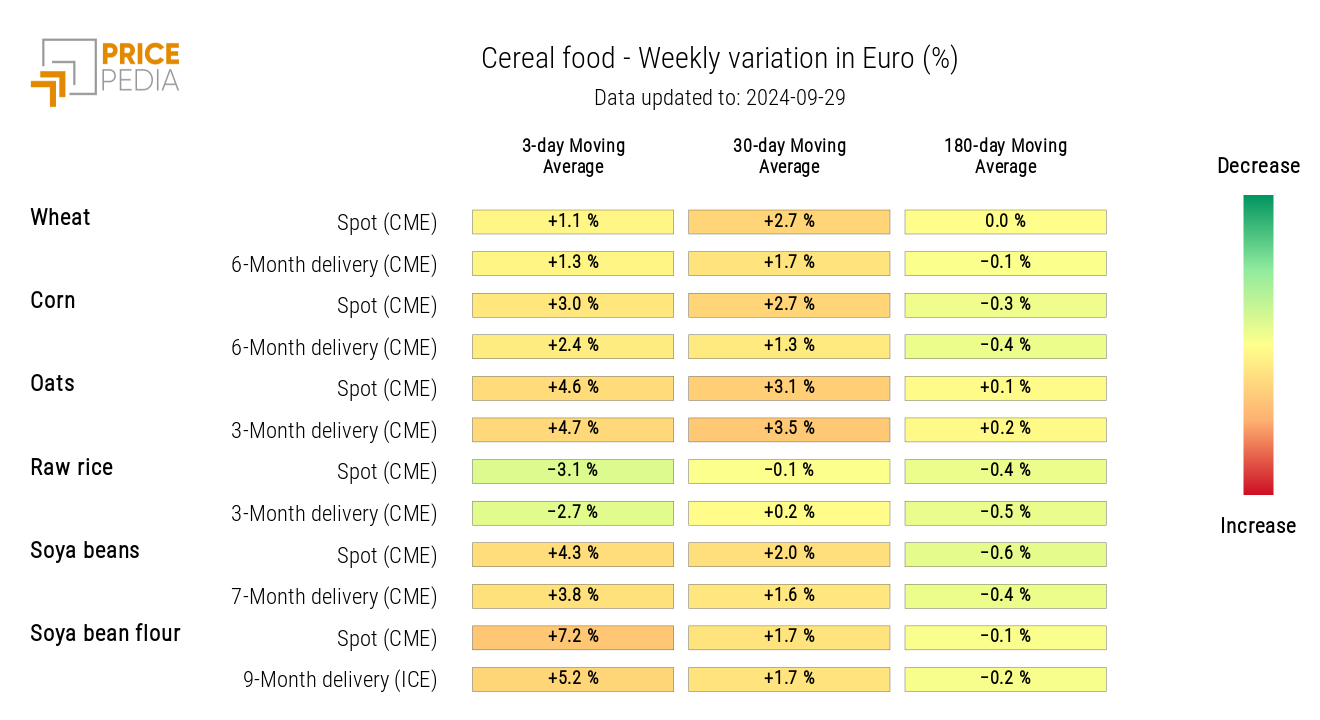
The cereals heatmap highlights a price increase for all products, except for raw rice.
HeatMap of Cereal Prices in Euro
Tropical Foods
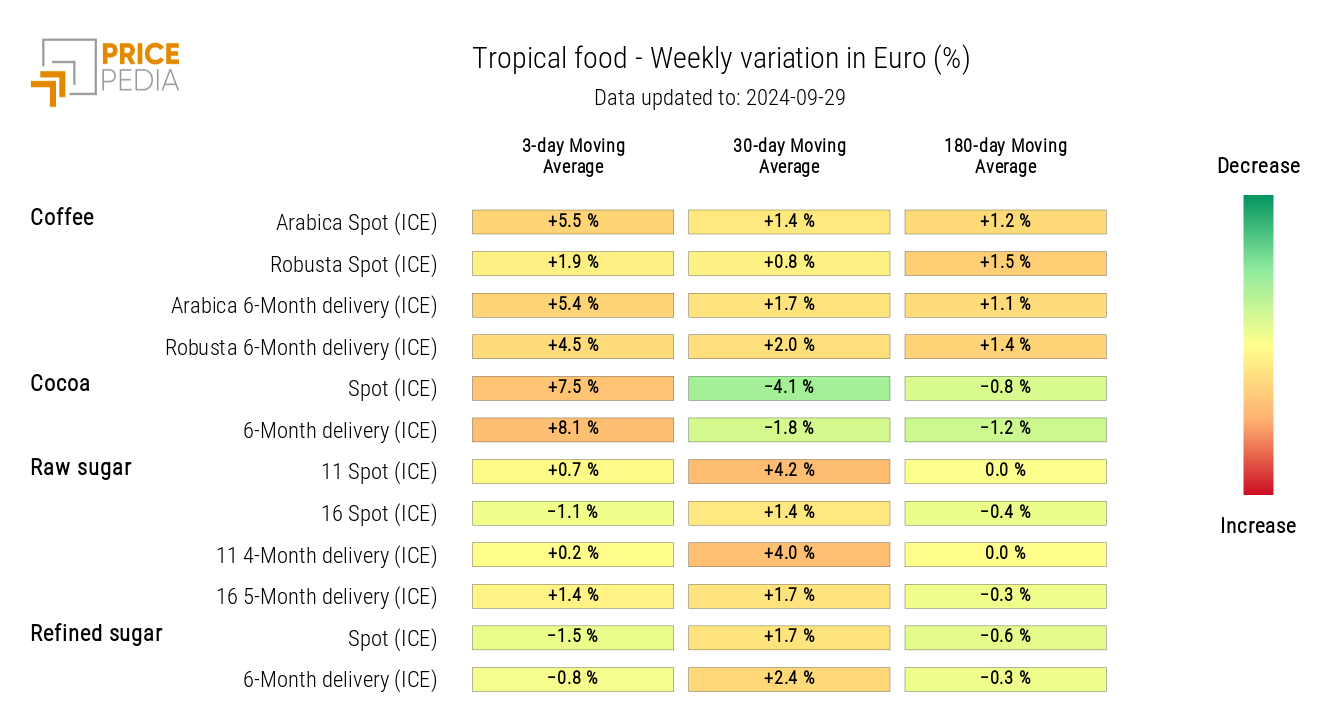
The heatmap below shows the weekly increase in tropical food prices.
HeatMap of Tropical Food Prices in Euro
OILS
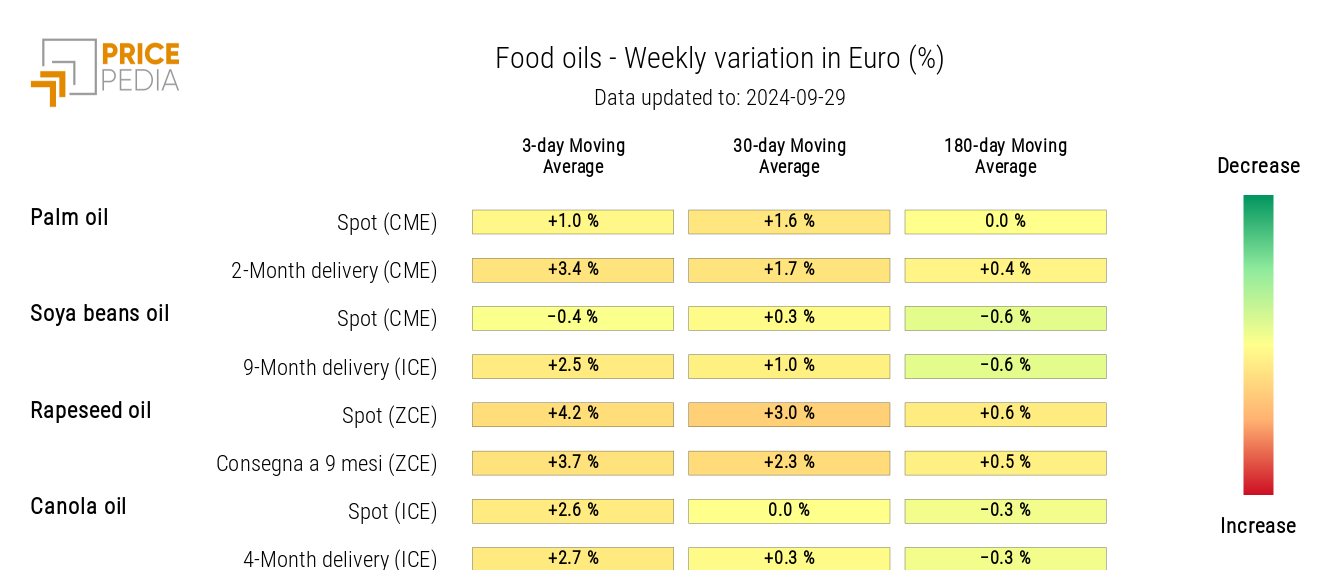
The oils heatmap is highlighted in red, showing a weekly increase in the three-day moving average of prices.
HeatMap of Edible Oils Prices in Euro
