Monthly commodity prices update for September 2024
Stability of purchasing commodity prices with downside risks
Published by Pasquale Marzano. .
EU Customs Global Economic TrendsThe updated monthly prices of PricePedia commodities for September 2024 have been released. In aggregate, commodities recorded a further decrease in prices of -3.5%, accentuating the downward trend observed in last August.
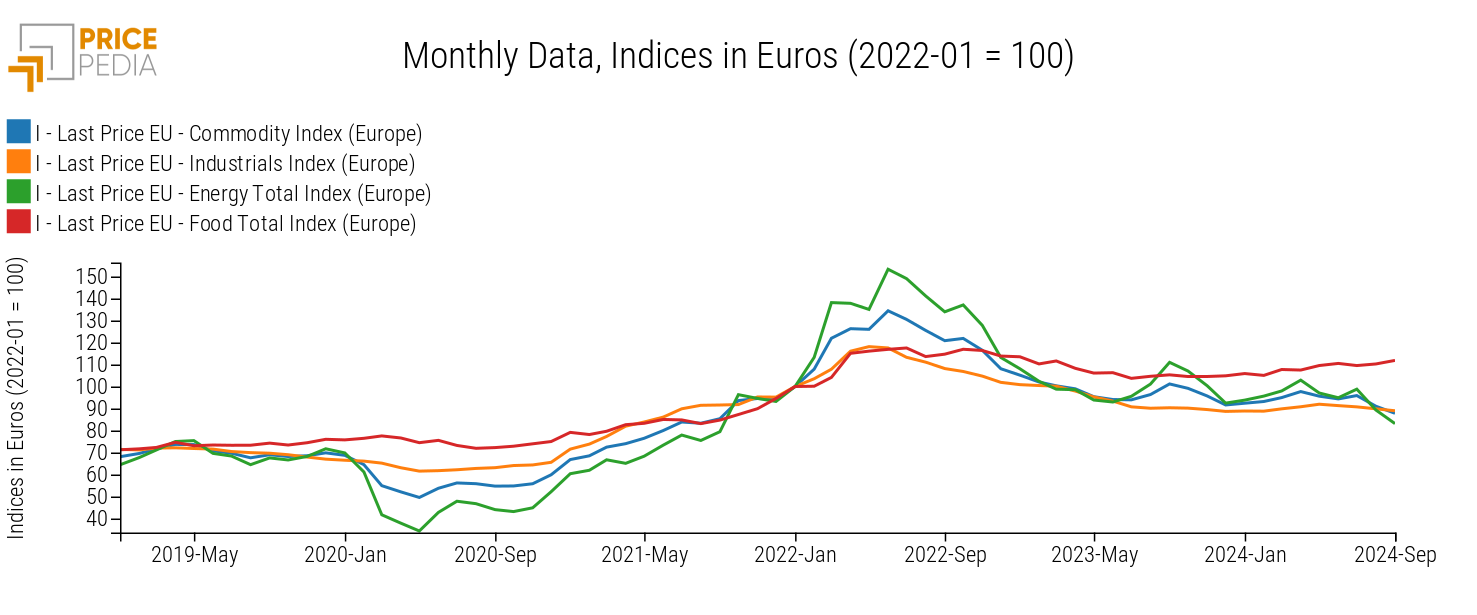
The following graph shows the evolution of raw material prices in Europe for the main PricePedia aggregates: Total Commodity[1], Industrials[2], Total Energy, and Total Food, with base 100 being the respective levels of January 2022.

Except for Food commodities, which recorded an increase of +1.5% compared to last August, all other aggregates show a decline, demonstrating the continued weakness in commodity demand in Europe.
The most evident drop is seen in the prices, in euros, of Energy, down -6.9% compared to August 2024, mainly influenced by the oil price trend, which in September fell below $70 a barrel, deviating from the target price of $80 pursued by OPEC+.
The core industrial commodities also experienced a decline in euro prices, but relatively contained and of similar intensity to that recorded in August 2024 (-1%).
Commodity Prices by Category
The weakness of manufacturing activity, as evidenced by the latest data on the European PMI, which remains below the threshold of 50, separating growth from contraction (see China's recovery measures push up industrial metal prices), continues to create uncertainty about when a new phase of demand growth for raw materials will lead to a significant price increase.
Below are the variations recorded in September 2024, compared to the previous month, in euro prices of individual categories available in PricePedia.
Graph 1: September 2024, % variations in euros compared to August 2024
Source: PricePedia
The graph shows a predominance of negative variations compared to positive ones. However, considering the intensity of the variations, most of them are below 1%, in absolute value, indicating a substantial stability in prices.
More intense price reductions in euros were recorded for Ferrous metals, -3.2%, and Organic Chemicals, -2.1%, which are among the categories most affected by the current downward pressure from Chinese prices.
This emerges from the comparison, shown in the following table, between the annual rate of change in euro prices of the two markets.
Table: Year-on-year variations (%), in euros, of the aggregated indices of Europe and China
| 2021 | 2022 | 2023 | 2024* | |
|---|---|---|---|---|
| I-Last Price EU-Ferrous Metals Total Index (Europe) | +49.02 | +19.96 | −15.86 | −6.35 |
| I-History China FOB-Ferrous Metals Total Index (China) | +40.17 | +14.32 | −22.51 | −12.80 |
| I-Last Price EU-Organic Chemicals Total Index (Europe) | +46.25 | +29.70 | −18.99 | −1.92 |
| I-History China FOB-Organic Chemicals Total Index (China) | +58.07 | +13.76 | −24.95 | −6.34 |
| I-Last Price EU-Plastics and Elastomers Total Index (Europe) | +39.11 | +21.92 | −17.42 | −3.56 |
| I-History China FOB-Plastics and Elastomers Total Index (China) | +15.87 | +16.51 | −21.36 | −7.80 |
| I-Last Price EU-Inorganic Chemicals Total Index (Europe) | +11.84 | +62.95 | −7.85 | −11.06 |
| I-History China FOB-Inorganic Chemicals Total Index (China) | +34.37 | +46.99 | −22.90 | −10.07 |
Chinese prices for Ferrous metals have dropped by -12.8%, due to the construction sector crisis, from which their largest share of demand originates. This leads, as described in the article How increased Chinese steel supply impacts European steel prices, to downward pressure from low-cost Chinese products on European market prices.
A similar dynamic is observed for Organic Chemicals and Plastics and Elastomers, whose year-on-year variations in 2024 in China are stronger than the corresponding prices in Europe.
As for Inorganic Chemicals, however, a slightly greater price reduction is recorded in Europe compared to China. This greater alignment in 2024 must be read in relation to what happened last year, when prices in China for inorganic chemical products fell by -22.9%, compared to a "mere" -7.9% decline in Europe.
1. The PricePedia Total Commodity index is the aggregation of Industrials, Food and Energy indices.
2. The PricePedia Industrials index is the aggregation of indices related to the following categories: Ferrous Metals, Non-Ferrous Metals, Wood and Paper, Chemicals: Specialty, Organic Chemicals, Inorganic Chemicals, Plastics and Elastomers, and Textile Fibers.
Pasquale Marzano
Economist and data scientist. At PricePedia he deals with the analysis of commodity markets, forecasting models for raw material prices and management of reference databases.


