Correlation between financial cereal prices
Analysis of possible causal relationships
Published by Luca Sazzini. .
Food Price DriversThe empirical analysis of weekly variations in the financial prices of cereals highlights a significant correlation among them. This correlation is confirmed both by long-term graphical analysis and by the statistical measurement of the correlation between their prices.
Graphical Analysis
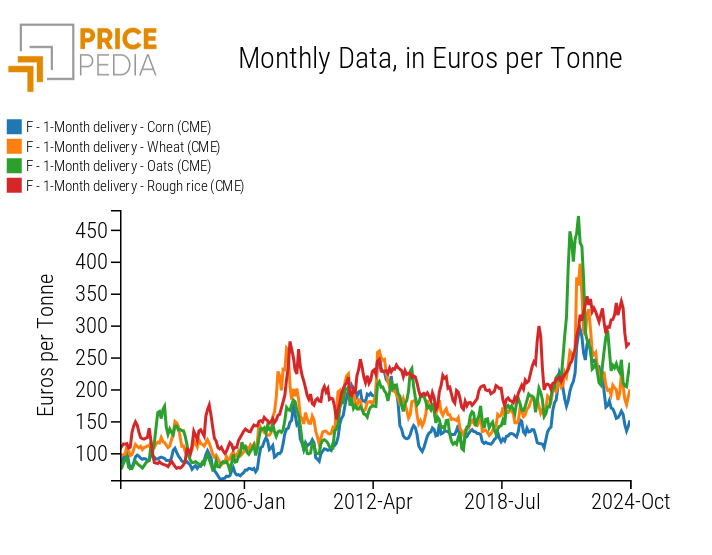
The following graph compares the monthly historical series of financial prices for corn, wheat, oats, and rough rice, quoted on the Chicago Mercantile Exchange (CME) and expressed in euros/ton.
Comparison of Financial Prices for Cereals

The analysis of the graph reveals a significant relationship in the dynamics of the financial prices of cereals.
The most intense cycle began towards the end of 2020, with a strong rise in financial prices for cereals, which reached new historical highs in the first half of 2022. After this peak, a subsequent phase of decline followed, concluding in August 2024.
Among the analyzed financial prices, rough rice deviated the most from the common price dynamics of cereals. In fact, in the last phase of decline, the drop in its price was less pronounced compared to that recorded for other cereals.
Do you want to stay up-to-date on commodity market trends?
Sign up for PricePedia newsletter: it's free!
Partial Correlations
A more precise measure of the relationship between these financial prices is given by the partial correlation matrix. This matrix, unlike the simple correlation matrix, allows us to isolate the relationship present between two prices, excluding the effects due to connections with other variables considered within the correlation analysis.
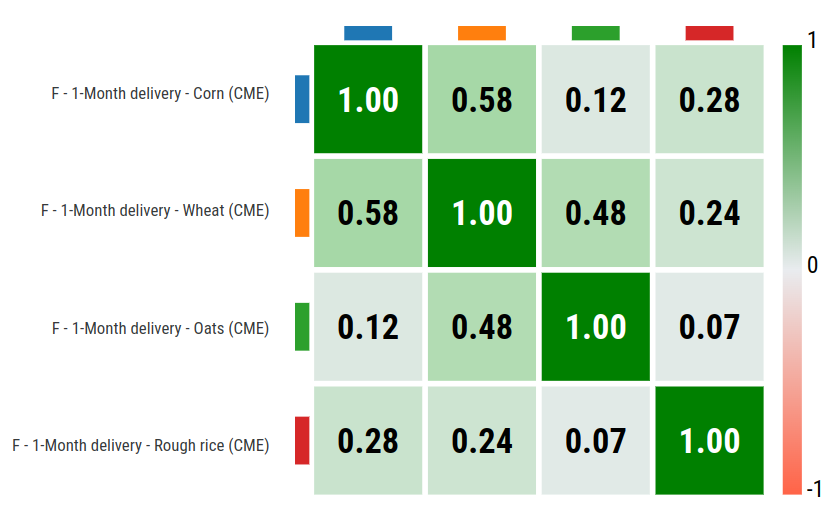
The following table presents the matrix of partial correlations for the four financial prices examined in this analysis.
Partial Correlation Matrix for Financial Prices of Cereals

The partial correlation matrix indicates that the highest correlation is between the prices of corn and wheat, with a partial correlation coefficient of 0.58 out of a maximum of 1.
The second highest coefficient is recorded between wheat and oats, with a value of 0.48.
In contrast, the cereal with the lowest partial correlations is rough rice. It is characterized by a weak partial correlation with corn (0.28) and wheat (0.24) and almost none with oats (0.07).
The correlations present between the prices of these commodities can be attributed to the impact of common factors that influence their demand, supply, and cost functions. Some examples include:
- Common Climate Shocks: Extreme weather conditions such as droughts and floods similarly affect the production of various types of cereals in major producing regions.
- Agricultural Input Shocks: Changes in the costs of agricultural inputs, such as fertilizers, tend to impact cereal prices relatively uniformly.
- Agricultural Policies and Subsidies: Many countries adopt agricultural policies and subsidies that similarly affect different cereals. This is due to the presence of common objectives such as stabilizing agricultural prices, ensuring a minimum income for farmers, food security, and promoting the sustainable use of resources.
Another element that contributes to the correlation between cereal prices, in addition to various common factors, is their substitutability from both the demand and supply sides.
In the italian article: L'elasticità incrociata dei prezzi quale strumento aggiuntivo all'analisi di mercato, the elasticity between the prices of two substitute products was analyzed. The analysis revealed that, theoretically, the elasticity between the prices of two substitute products should be positive. As the price of one of the products increases, the demand for its substitute good will increase, as using firms will tend to prefer the cheaper product. The increase in demand for the substitute good will result in a price increase, leading to a positive correlation between the variations in the two prices.
A concrete example of substitutability from the demand side is the substitutability of cereals in animal feed and processed foods. In particular, some cereals, such as corn, wheat, and oats, can be substitutes in both animal and human nutrition. Consequently, feed producers and consumers tend to substitute one cereal for another as the conditions of convenience change.
From the supply side, an example of substitutability is competition for productive resources. The varying demand for cereals impacts farmers' cropping choices, influencing the relative supply and market prices of the crops themselves. An increase in the demand for corn may lead to a larger area of land being allocated to its cultivation, at the expense of the production of other cereals. This will generate a decrease in supply, resulting in an increase in the prices of other cereals.
Statistical Regression
Studying the correlation between the different prices of multiple commodities and their determinants is the first step in verifying the possibility of using the knowledge of one price to predict the possible evolution of others.
From a statistical perspective, this verification can be done by regressing the price of one product on the possible lags of the others.
If the model that includes the lags is more effective in explaining the behavior of the dependent variable, this suggests that the explanatory variable significantly anticipates the dynamics of the dependent variable.
This approach revealed that no financial price of cereals is systematically able to predict the trends of others. The absence of a signal extractable from the dynamics of financial prices over a period of 25 years is likely due to the fact that, over time, the prices considered “leading” by financial markets have changed. A verification of this hypothesis could be developed by considering regression results on temporal subsamples. However, this analysis does not fall within the objectives of this article.
Conclusions
The empirical evidence on price correlations and the analysis of their determinants indicate the existence of significant relationships between the financial prices of cereals. It is likely that some of these prices can anticipate variations in others. However, an analysis conducted over a period of 25 years does not allow for the extraction of any clear "anticipation" signal among the financial prices of cereals.


