PricePedia commodity market risk
Out of a total of 700 commodities, 84 have a score higher than 30
Published by Luigi Bidoia. .
Strumenti Procurement Procurement Risk ManagementThe post-pandemic recovery has caused a significant shock to the supply chain, prompting many companies to recognize the high risks associated with the procurement of raw materials and basic goods. Although commodity markets are currently experiencing a phase of apparent stability, this calm is only superficial. Many of the factors that caused the shock between 2021 and 2022 are still present and could resurface at any moment. On one hand, companies’ precautionary stock policies can change abruptly, leading to significant increases or decreases in demand; on the other hand, the current geopolitical tensions and the vulnerability of the global logistics system may cause constraints on the local supply of many commodities.
It is difficult to predict when and with what intensity these factors will impact commodity markets. However, it is possible to study the characteristics of different commodity markets to define measures capable of indicating higher or lower market risks associated with each commodity.
We have thus applied the approach described in Commodity Market Risk to quantify a risk score for over 700 commodities monitored and analyzed by PricePedia.
The Market Risk Score
The commodity with the highest market risk score (60, on a scale from 0 to 100) is tellurium. Tellurium is one of the rarest elements on the planet and is considered a "critical metal" by both the European Commission and the governments of the United States and Canada. In addition to tellurium, 84 other commodities show a risk score higher than 30, which can be considered the threshold beyond which the risk becomes significant. Another 91 commodities have a score higher than 20, which indicates a notable level of risk. Overall, about 1/4 of the raw materials and basic goods purchased by European companies present a market risk that can be considered significant (warranting analysis and monitoring) or relevant (requiring careful management).
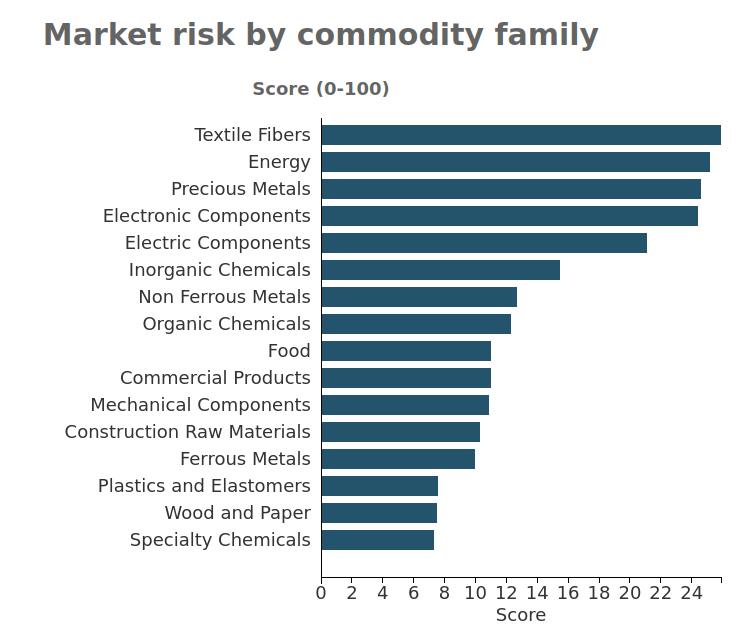
The following chart shows the various commodity families defined by PricePedia, ordered by their associated risk level [1].

The family that, on average, presents the highest level of risk is textile fibers. This positioning is naturally due to the fact that many textile fibers are produced in only a few countries, often geographically and sometimes politically distant from the EU. The most representative commodity of this situation is cashmere wool, whose supply is highly concentrated, with China holding a significant share of global trade.
Another four commodity families (Energy, Precious Metals, Electronic Components, and Electrical Components) have a representative score above 20. All other families (with the exception of inorganic chemicals, which are positioned in a middle range) show a relatively low average score, close to 10 and ranging between 7 and 13.
However, analyzing the representative score value for the different families provides only a partial view of the risk situation of the various commodity families. A much more comprehensive picture is given by the distribution of the risk score within each family. This distribution can be summarized by examining the most significant quantiles:
- Q10: represents the score value that separates the lowest 10% of cases from the remaining 90% with higher values;
- Q25: represents the score value that separates the lowest 25% of cases from the remaining 75% with higher values;
- Q50: represents the median, or the score value that divides the commodities into two numerically equal groups;
- Q75: represents the score value above which the top 25% of cases are positioned;
- Q90: represents the score value above which the top 10% of cases are positioned.
The following table shows the values of the 5 quantiles for the various commodity families. To make the table easier to interpret, the cells have been colored in shades of red that intensify as the score increases.
Quantiles of the distribution of scores by family
| Famiglia di commodity | Q10 | Q25 | Q50 | Q75 | Q90 |
|---|---|---|---|---|---|
| Specialty Chemicals | 2.5 | 3.7 | 7.3 | 17.1 | 22.8 |
| Wood and Paper | 3.3 | 4.9 | 7.5 | 11.4 | 15.2 |
| Plastics and Elastomers | 3.4 | 5.3 | 7.6 | 13.1 | 25.6 |
| Ferrous Metals | 4.8 | 7.3 | 10.0 | 16.3 | 23.8 |
| Construction Raw Materials | 5.2 | 6.5 | 10.3 | 13.2 | 17.4 |
| Mechanical Components | 6.6 | 9.3 | 10.9 | 21.4 | 23.8 |
| Food | 6.0 | 7.9 | 11.0 | 21.3 | 36.3 |
| Commercial Products | 3.8 | 7.0 | 11.0 | 15.9 | 16.8 |
| Organic Chemicals | 6.4 | 8.5 | 12.3 | 16.9 | 23.6 |
| Non Ferrous Metals | 5.6 | 7.8 | 12.7 | 26.3 | 35.1 |
| Inorganic Chemicals | 5.2 | 9.4 | 15.5 | 27.4 | 42.7 |
| Electric Components | 10.2 | 11.7 | 21.1 | 33.0 | 37.9 |
| Electronic Components | 12.0 | 18.8 | 24.4 | 32.3 | 37.9 |
| Precious Metals | 16.9 | 20.0 | 24.6 | 32.7 | 41.8 |
| Energy | 13.2 | 16.8 | 25.2 | 30.0 | 30.9 |
| Textile Fibers | 8.4 | 11.2 | 25.9 | 34.5 | 39.6 |
The analysis of the table highlights some particularly interesting aspects.
- When considering the entire distribution of scores, the commodity families that are overall less risky are Wood and Paper, Construction Materials, and Commercial Goods, characterized by having over 90% of commodities with a risk score below 20.
- Among the commodity families with significant risks, we also find Food Products and, especially, Non-Ferrous Metals. In both cases, 25% of commodities have a score above 20, and for some (10%), the score exceeds 35.
- The Inorganic Chemicals family can undoubtedly be included among the higher-risk families, as a small but significant portion (10%) of inorganic chemical commodities has a risk score exceeding 42.
Conclusions
The initial analyses for calculating a measure capable of indicating the market risk level of a commodity reveal a significant number of commodities with either relevant or significant risks.
The families grouping the most risky commodities are those of Energy Goods, Precious Goods, Electronic Components, and Electrical Components. This group also includes inorganic chemical commodities, given the high risk associated with a significant percentage of chemical products. Non-negligible risks also affect the Non-Ferrous Metals and Food families.
[1] As the representative risk value for each family, in this case, the median was chosen to neutralize potential effects from outliers or missing values.


