Only precious metals seem immune from the current phase of uncertainty
After gold and silver, possible sanctions on Russia push up palladium price
Published by Luca Sazzini. .
Conjunctural Indicators Commodities Financial WeekWeekly Summary of Financial Commodity Prices
In this historical context characterized by high geopolitical risks, financial commodity markets tend to follow short-term dynamics, with frequent fluctuations mostly driven by the latest published news. Safe-haven assets such as gold and silver, however, are an exception, managing to maintain lasting growth trends even in times of heightened uncertainty.
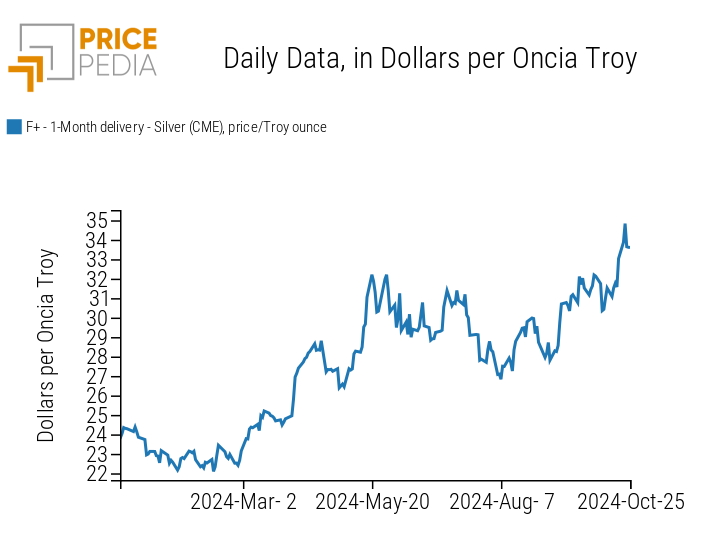
Below are the historical series for the spot prices of gold and silver, both quoted on the Chicago Mercantile Exchange (CME) financial market.
| CME Gold Spot Price, in $/troy ounce | CME Silver Spot Price in $/troy ounce |

|
|
The charts reveal significant price increases, marking the trends of these two precious metals.
Gold continues to reach new historical highs, with over 30% growth since the beginning of the year.
Silver shows even greater price increases than gold, with a 40% rise compared to January 2024 levels.
With the exception of safe-haven assets, identifying lasting trends in financial commodity markets during periods of significant uncertainty proves more challenging.
The most volatile prices are those of energy commodities, which often experience opposite fluctuations based on the latest weekly news. For instance, oil prices started the week on an upward trend due to a drone attack launched by Hezbollah from Lebanon against the private residence of the Israeli prime minister.
The greatest concern is about possible reactions from Israel against both Hezbollah and Iran itself.
Last night Israel acted on its intention to target military installations in Iran. Neither nuclear sites nor oil facilities were hit, providing hope for avoiding further escalation in the Middle East.
On Wednesday, market sentiment seemed to shift with the BRICS countries' (Brazil, Russia, India, China, and South Africa) call for an urgent ceasefire in the Gaza Strip. This new hope for a possible easing of tensions in the Middle East temporarily reversed the oil market's trend, which remains characterized by a strong demand weakness.
Unlike the oil market, no reversal occurred in the natural gas market, which continued to follow an upward path due to an incident at the Norwegian Sleipner B platform.
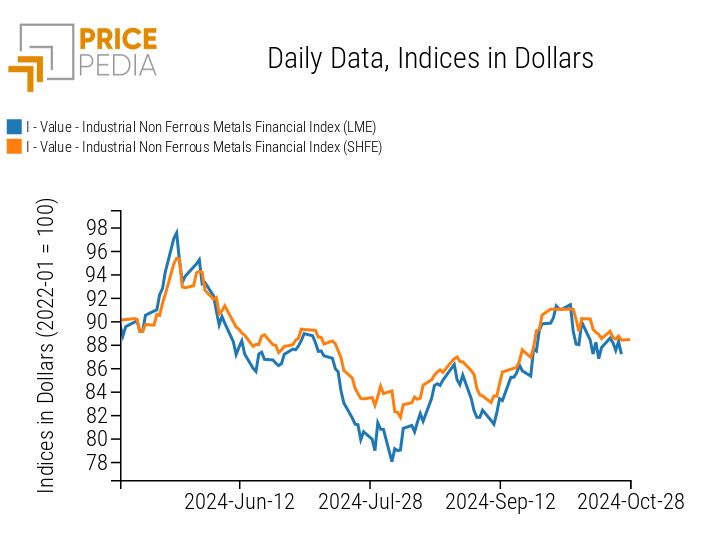
The industrial metals markets have slowed their downward trend, maintaining price levels relatively similar to those of the previous week. The latest data from the World Steel Association (WSA) indicated a decline in global steel production, partially mitigating the current phase of falling prices for ferrous metals.
The slowdown in the non-ferrous metals market is instead attributed to increased bullish bets by money managers on the financial prices of aluminum and zinc on the London Metal Exchange (LME).
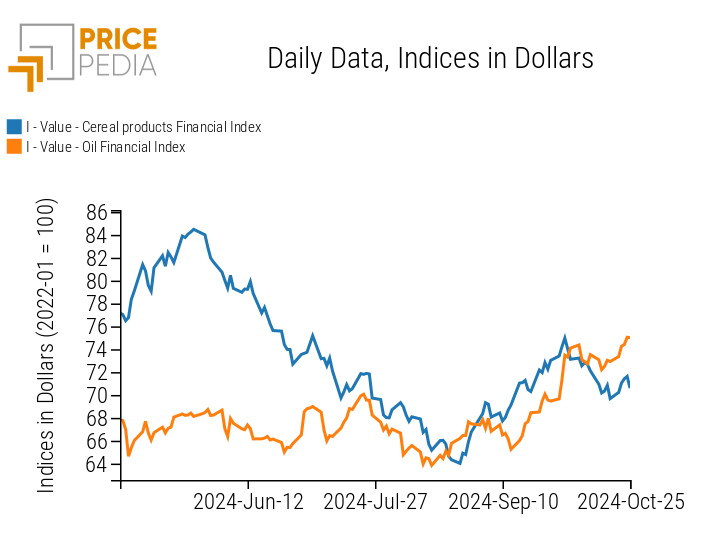
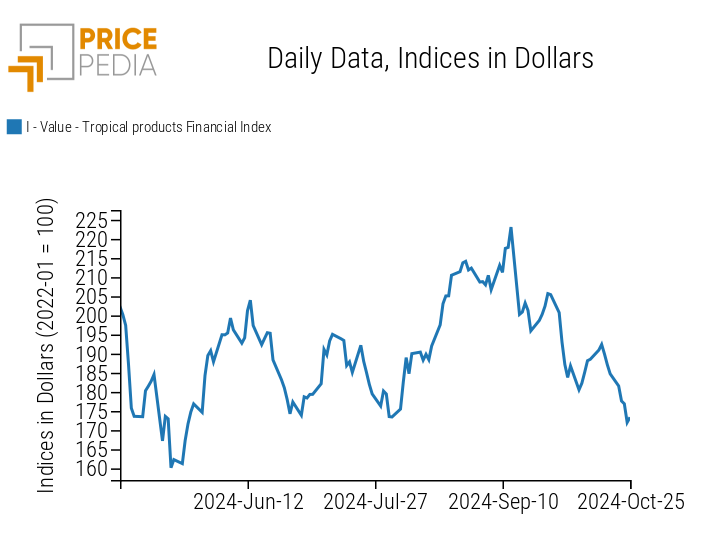
The food sector continues to show high volatility, mainly influenced by weather conditions. The prices of grains and oils have risen, contrary to tropical commodities, which have continued their downward price trend.
Possible Sanctions on Russian Palladium and Titanium
The United States intends to urge other G7 countries to consider possible sanctions on Russian palladium and titanium. Following this news, palladium, the only one of the two metals traded on regulated financial markets, recorded an increase of over 6% in a single day on Thursday.
Russian giant Nornickel controls about 40% of global palladium production: potential sanctions against Russia could lead to strong market tensions and price increases for palladium.
PMI
This week, preliminary Purchasing Managers Index (PMI) estimates for the eurozone and the United States for October were released.
Eurozone
Estimates of PMI indexes in the euro area continue to indicate stagnation in the European economy.
The weakest sector is manufacturing, with a PMI index of 45.9. This figure, although an increase from September's 45 and above analysts' estimates of 45.1, still signals a contraction in the manufacturing sector. In fact, a PMI value below the 50-point threshold is to be interpreted as a contraction phase, while a value above this threshold suggests economic expansion.
The services sector remains the eurozone's driving force, with a PMI index of 51.2.
However, services growth fell short of analysts' expectations, which had forecast a PMI of 51.4, and shows a slowdown compared to September's 51.4.
Overall, the euro area flash composite PMI was estimated at 49.7, up from September's 49.6 but below analysts' expectations of 49.8.
United States
The U.S. flash PMI data is more encouraging than the European data, indicating slight economic growth in October.
The composite PMI increased to 54.3 points, up from the previous 54.
The services PMI surprisingly rose to 55.3, while the manufacturing PMI reached 47.8 points, up from the previous 47.3.
Overall, there is an improvement in the U.S. economy, although there is still weakness in the manufacturing sector.
ENERGY
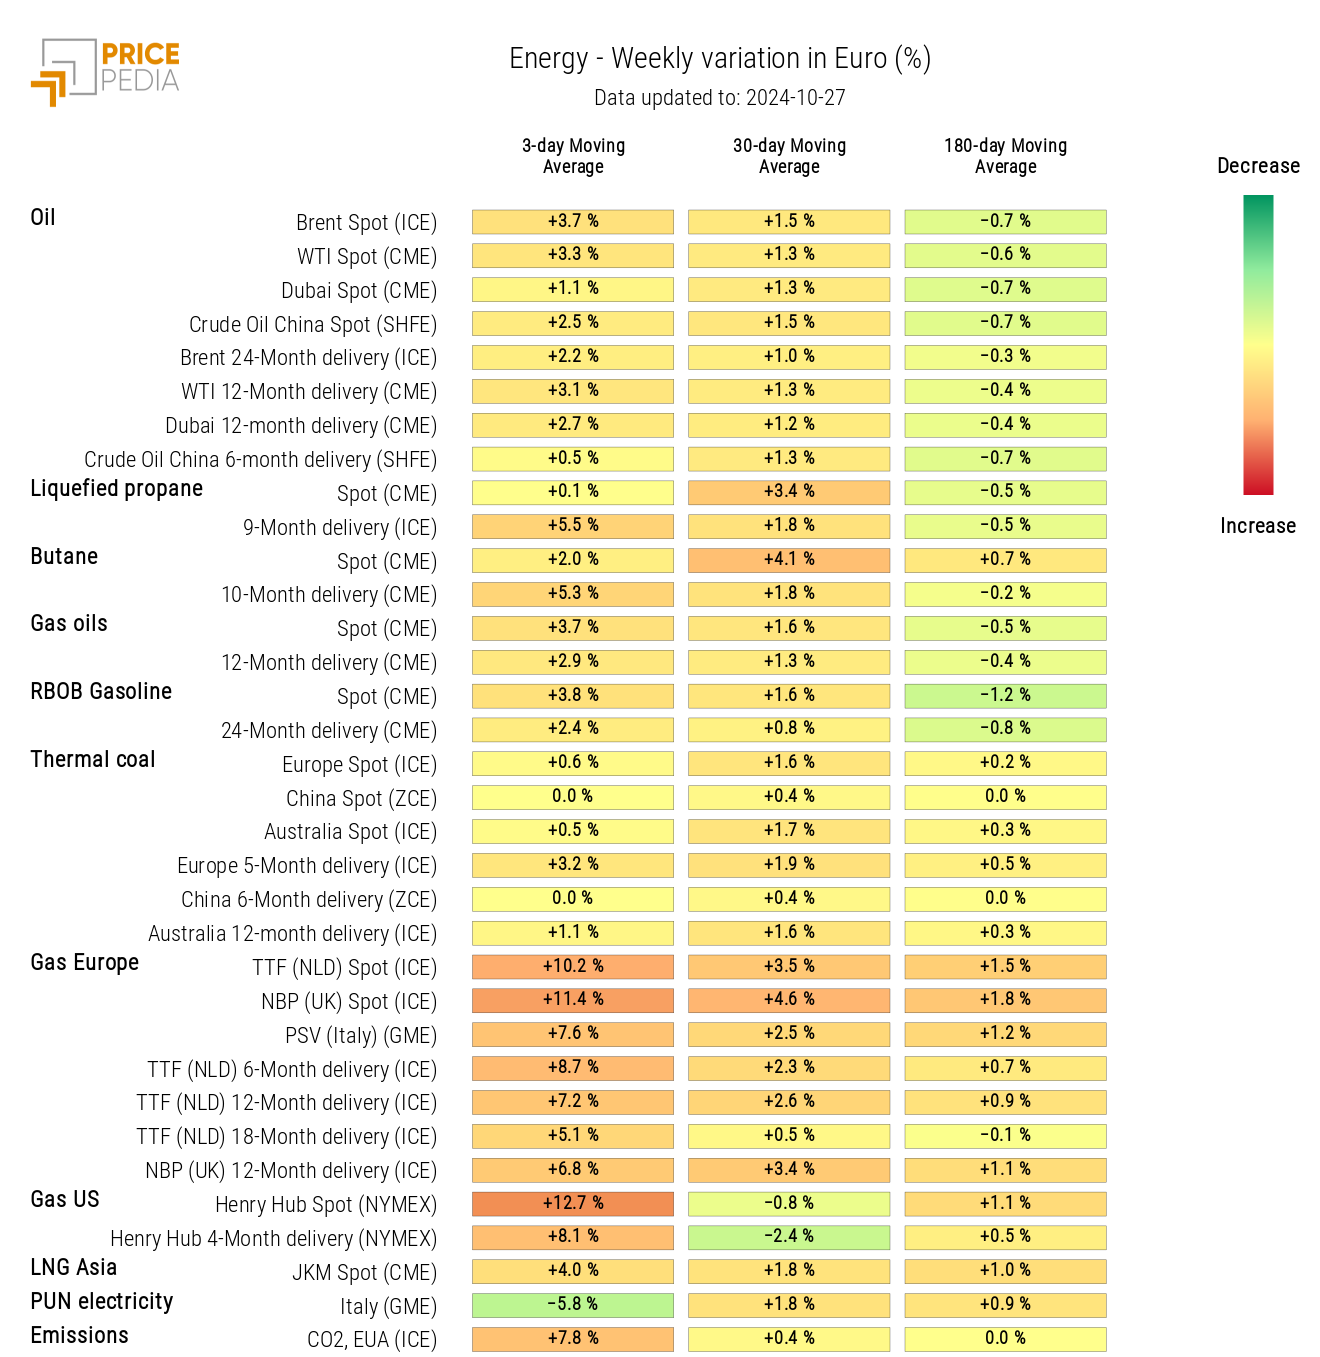
The PricePedia financial index for energy products indicates an increase in average energy prices over the past week.
PricePedia Financial Index of Energy Prices in USD
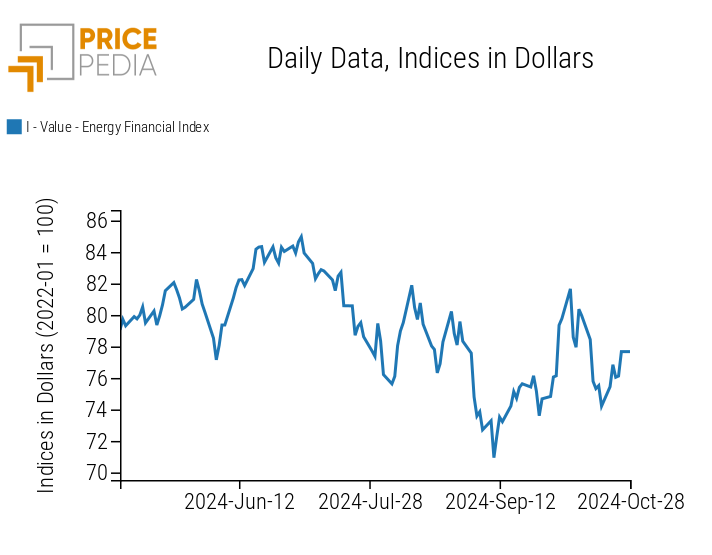
The energy heatmap highlights a generalized price increase, with higher rates for natural gas, initially caused by Hezbollah's attack on Netanyahu's residence and later exacerbated by the shutdown of production at Norway's Sleipner B platform.
HeatMap of Energy Prices in EUR
PLASTICS
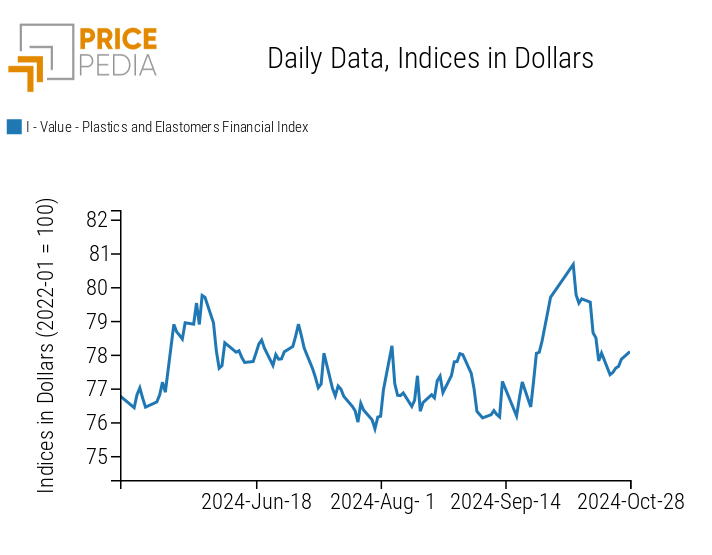
The PricePedia index for plastics and elastomers recorded a slight recovery this week, mainly due to the rise in financial prices for natural rubber.
PricePedia Financial Indices of Plastics Prices in USD
FERROUS METALS
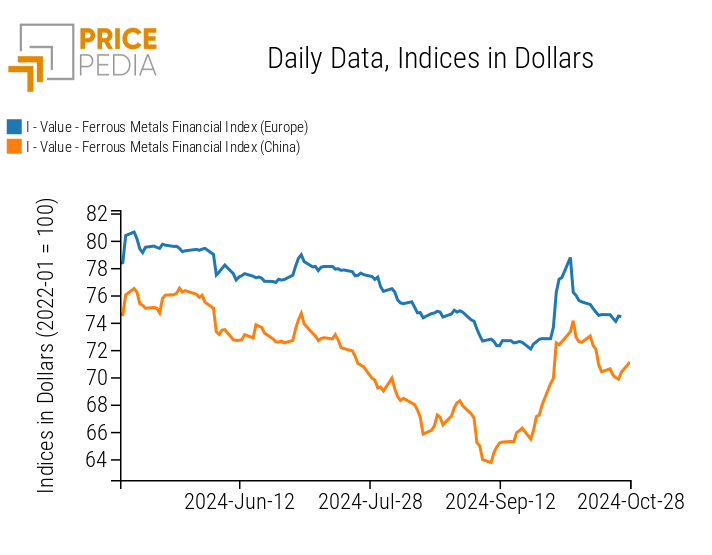
The financial indices of ferrous metals are slowing down the phase of price reduction and recorded a slight positive oscillation over the weekend.
PricePedia Financial Indices of Ferrous Metals Prices in USD
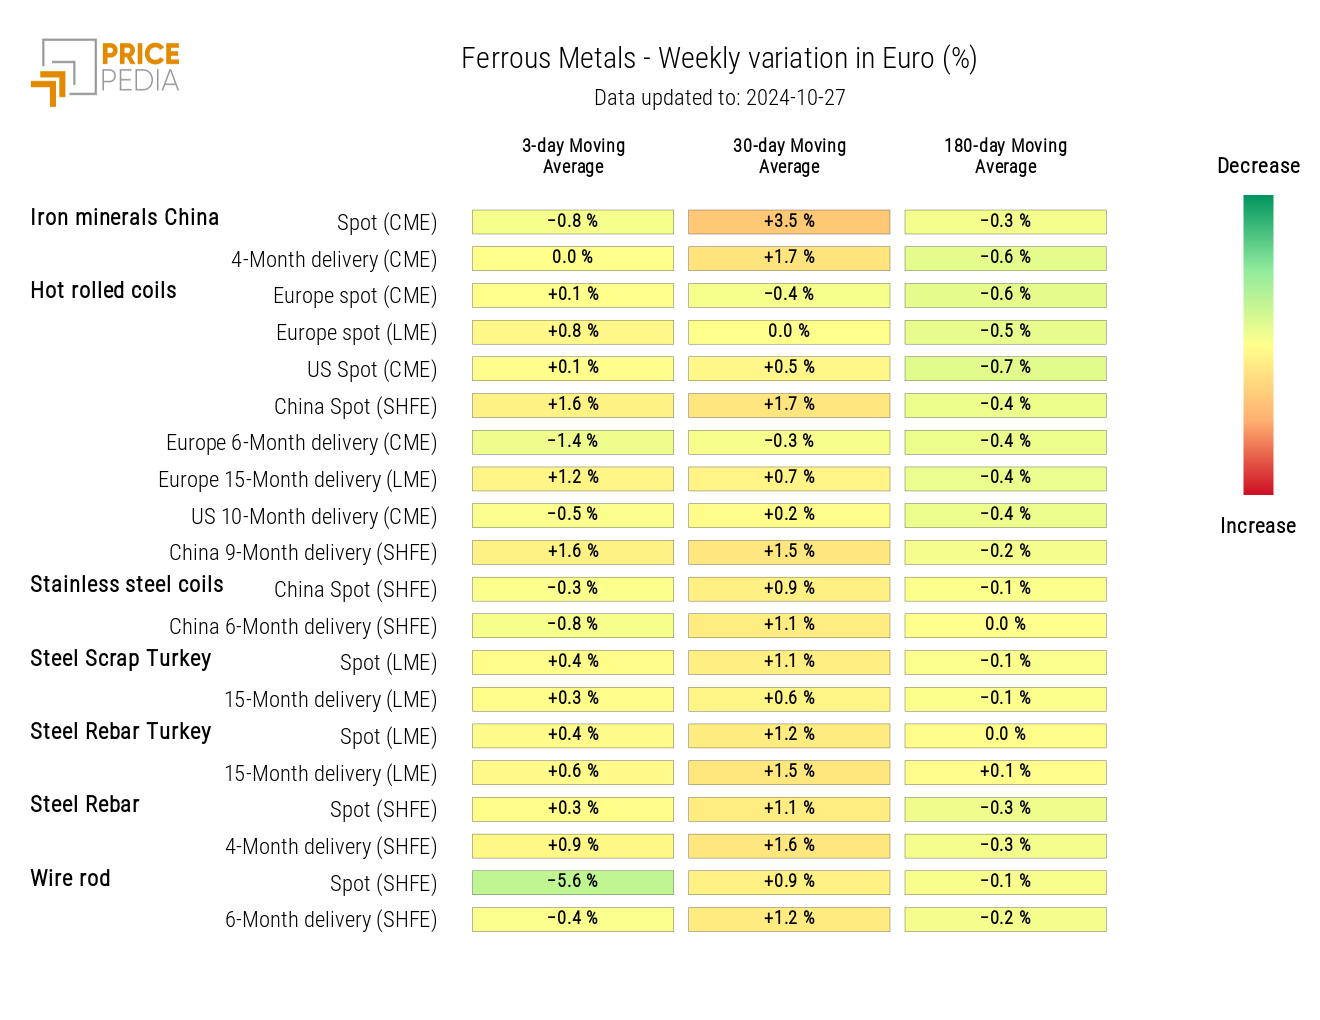
The ferrous heatmap indicates a decline in prices for steel rebar and wire rod, quoted on the Shanghai (SHFE) financial exchange.
HeatMap of Ferrous Prices in EUR
Do you want to stay up-to-date on commodity market trends?
Sign up for PricePedia newsletter: it's free!
NON-FERROUS METALS
The financial indexes of industrial non-ferrous metals recorded some fluctuations this week, which did not significantly alter their price levels.
PricePedia Financial Indexes of Industrial Non-Ferrous Metals Prices in Dollars
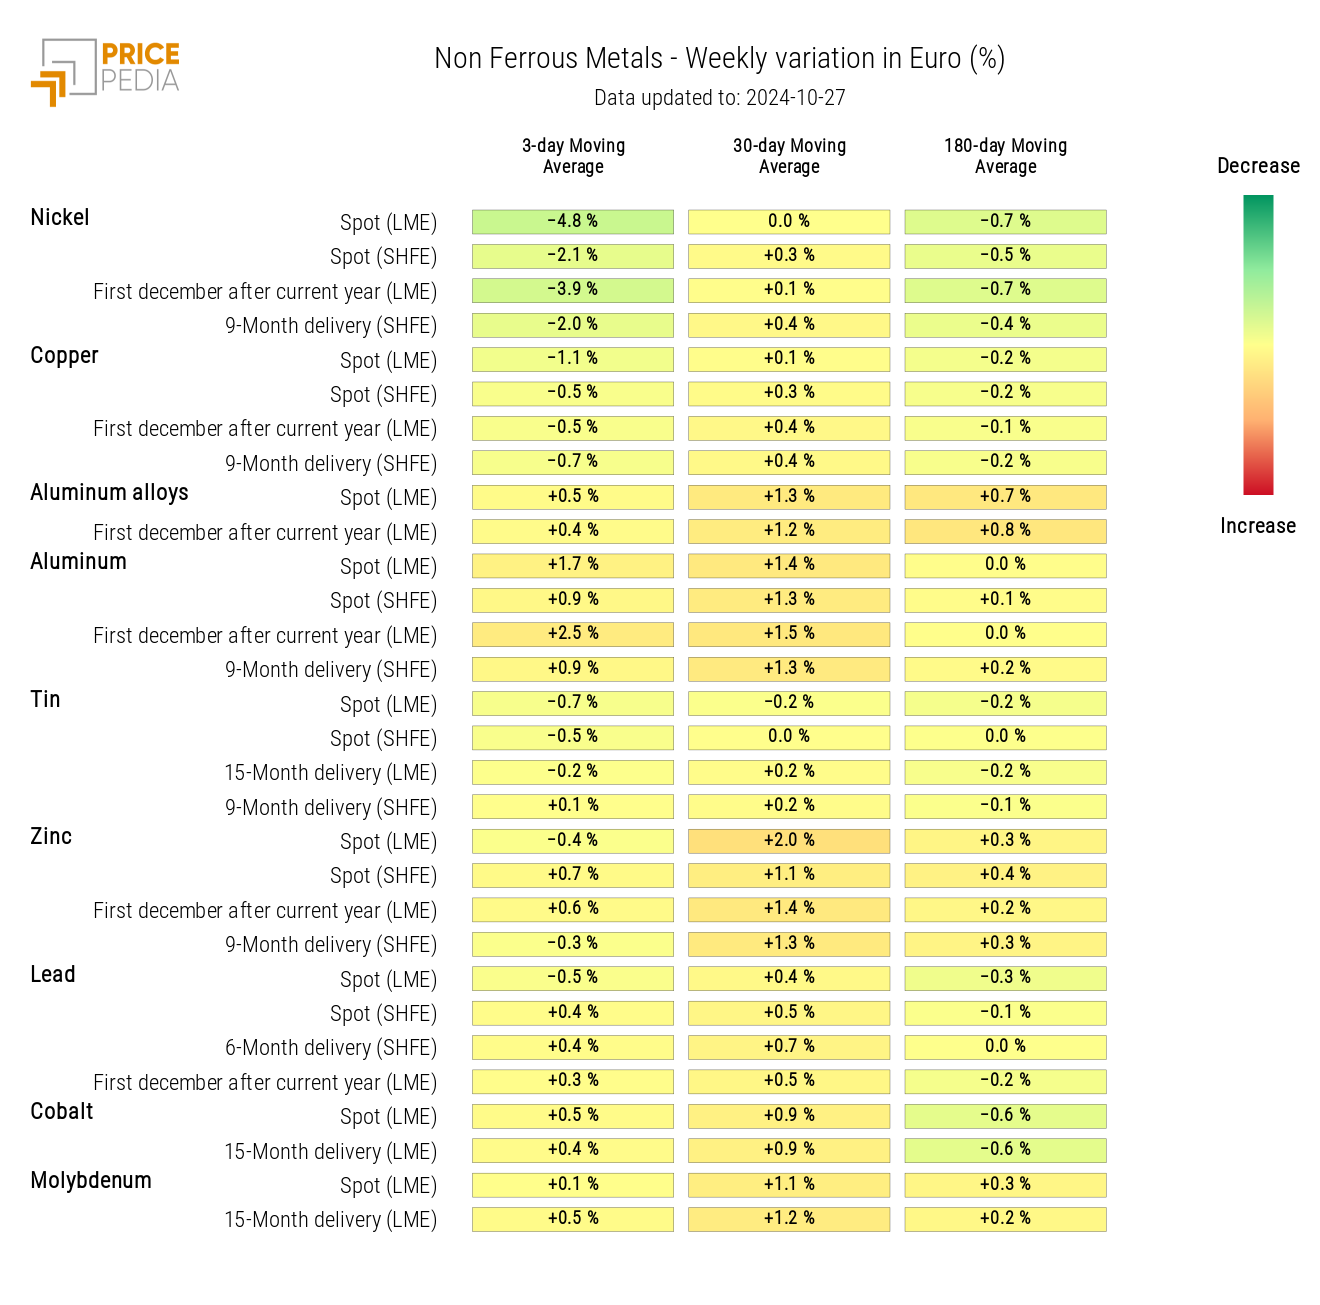
The heatmap below highlights a price reduction in nickel.
HeatMap of Non-Ferrous Prices in Euros
FOOD
The financial prices of cereals and oils registered a general weekly rise, in contrast to tropical products, which continued their price decrease phase.
| PricePedia Financial Indexes of Food Prices in Dollars | |
| Cereals and Oils | Tropical Products |
|
|
CEREALS
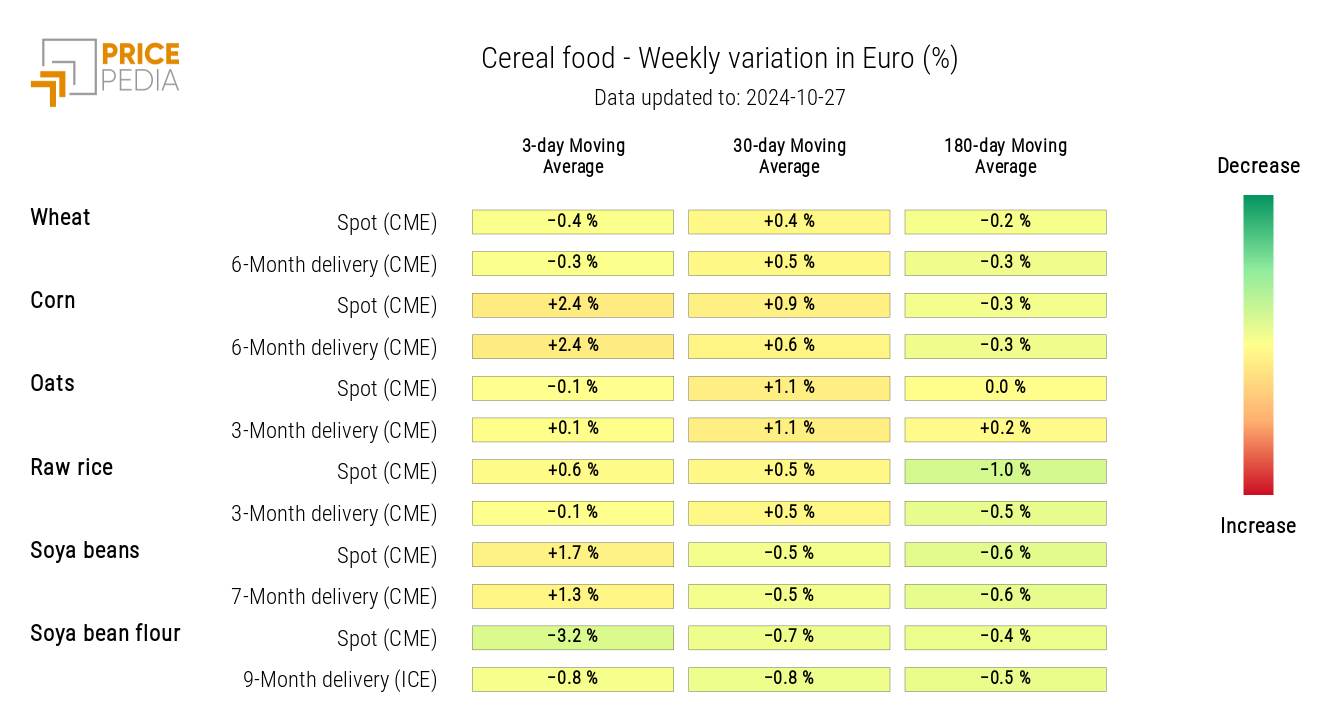
The cereals heatmap highlights an increase in corn prices, attributed to new estimates from the National Association of Cereal and Grain Exporters (ANEC) indicating a potential reduction in corn exports from Brazil.
HeatMap of Cereals Prices in Euros
TROPICAL PRODUCTS
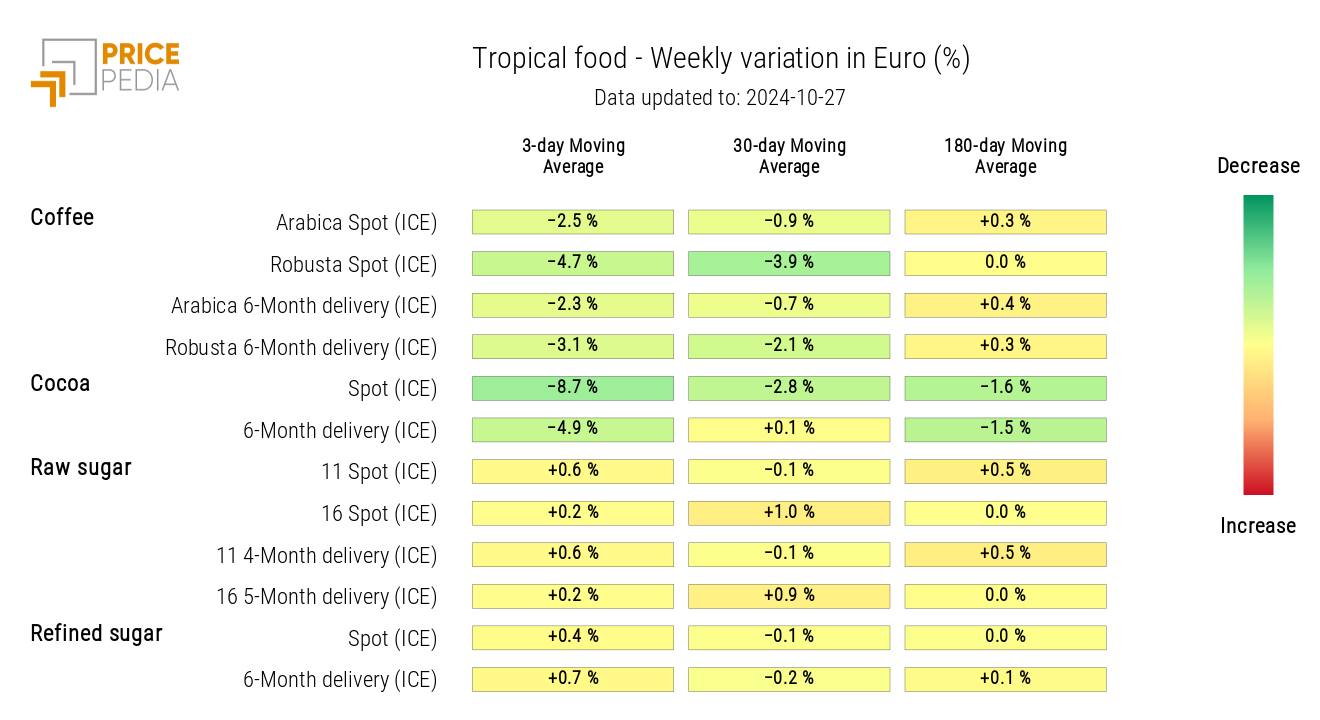
The heatmap shows a decline in financial prices for coffee and especially for cocoa.
Improved weather conditions in Ghana and the Ivory Coast have raised the estimates for the 2024/2025 harvest and enabled an increase in cocoa bean deliveries to Ivorian ports, previously hindered by flooding.
HeatMap of Tropical Food Prices in Euros
OILS
The heatmap analysis reveals a general weekly increase in the financial prices of edible oils.
HeatMap of Edible Oil Prices in Euros
