Critical raw materials: the case of Natural Graphite
Excessive dependence on China and high substitute prices impact commodity risk
Published by Pasquale Marzano. .
Natural Graphite Artificial Graphite Energy Transition Critical raw materials
In the article Friendshoring and market risk of purchasing materials, it was described how market risk can reflect the level of integration in global trade and a potential division of countries into opposing blocs (West and the Rest).
Among the products whose European supply would be most at risk in case of a sharp division between blocs is natural graphite. Not surprisingly, this raw material has been added to the list of critical raw materials by both the European Union and the United States. It is a highly versatile industrial product due to its high thermal resistance, corrosion resistance, and lubricating properties. Industrial uses in the EU are distributed as follows:
- steelmaking, as refractory material (32%) and other uses (12%);
- lithium-ion batteries (25%);
- lubricants (13%);
- friction products (9%);
- other uses (9%).
Critical issues and market risk of Natural Graphite
The criticality of natural graphite for the EU lies in its significant dependence on imports from non-EU partners considered politically distant. A measure of this criticality is provided by the score relating to the structure of international trade, developed by PricePedia as part of the project on managing market risks of procurement materials[1].
The scatter plot below shows the main net importing and exporting countries, differentiated based on their proximity to the Western area of the world.
The chart is interactive: hovering over a country displays a table with relevant informationThe x-axis shows the share of world trade[2], while the y-axis shows the country’s proximity index to the Western world area. The circle size varies only for exporting countries (colored in pink) and indicates the importance of the country as an exporter to the EU. The scatter plot also includes a horizontal line corresponding to a proximity index value of 60 to the Western area.
Do you want to stay up-to-date on commodity market trends?
Sign up for PricePedia newsletter: it's free!
The overall score for fragmentation risk in world trade for natural graphite is high, at 74.5. The chart shows that the EU's main suppliers are mostly politically distant countries. China is the world’s main supplier, with a share of over 66%. For the EU, in addition to China, Brazil, Mozambique, and Madagascar are particularly important, as they hold a larger EU market share than their corresponding share of global exports.
The role of natural graphite substitutes
Natural graphite is a particularly heterogeneous product, and thus its substitutability varies depending on the uses and desired characteristics. One of the main substitutes is artificial graphite, which can be produced from petroleum coke, coal tar pitch, or other carbon-containing precursors.
Below is the scatter plot for the main net importing and exporting countries of artificial graphite, as illustrated for natural graphite.
The chart is interactive: hovering over a country displays a table with relevant informationCompared to natural graphite, artificial graphite has a lower overall score for fragmentation risk in global trade, at 49.2. However, even in this case, China is the world and European leading supplier, with a respective share of 81% and 78%. Compared to natural graphite, there are trading partners closer politically to the Western bloc (France, Japan, Switzerland, Norway, etc.).
Price comparison
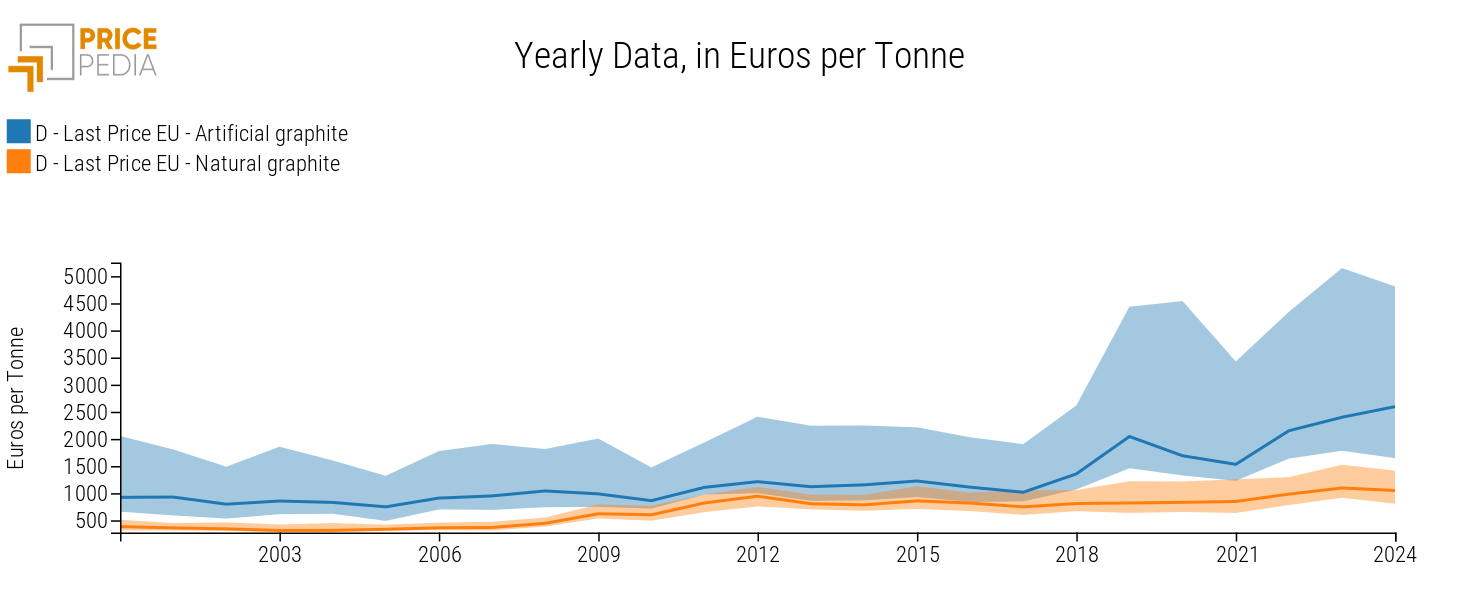
The following chart shows a comparison of average customs price levels for artificial and natural graphite, expressed in euros per ton. It also illustrates the price dispersion in the European market.
Natural and Artificial Graphite: comparison of levels and dispersion in Europe, €/Ton

Artificial and natural graphite have different price levels, with the former consistently more expensive than the latter over the illustrated time period.
Considering price dispersion, it is notable that the first quartile of the artificial graphite price distribution (which separates the 25% lowest prices of artificial graphite on the EU market) is higher than the third quartile of natural graphite prices (which separates the 25% highest prices of natural graphite on the EU market): in other words, the cheapest artificial graphite is still priced higher than the most expensive natural graphite, indicating structurally and significantly different price levels between the two materials.
In the European market, artificial graphite's price dispersion is also greater than that of its substitute and has been increasing since 2019.
Conclusions
Although natural graphite is substitutable in certain applications, such as lithium-ion batteries, with artificial graphite, the benefits of such substitution would be limited due to the EU's high dependence on China for both materials and the higher prices of artificial graphite compared to natural graphite.
1. An application of this methodology was illustrated in the article Stearic acid: market risk analysis.
2. This analysis focused on net exports and imports to gain a clearer view of a country's role in the market. A country's exports can include goods that were previously imported and then re-exported, which can distort the actual size of its contribution. By considering only net exports and imports, the effect of imported and re-exported goods is excluded, providing a more accurate assessment of each country's effective participation in the market.


