History repeats itself: uncertainty pushes up gold and silver prices
Historically silver has been more subject to speculation than gold
Published by Luca Sazzini. .
Precious Metals Price DriversIn the article published last weekend, Only precious metals seem immune from the current phase of uncertainty, the strong growth of financial prices for gold and silver was highlighted.
Current geopolitical tensions, combined with interest rate cuts by central banks and the approach of the U.S. elections, have increased demand for safe-haven assets, driving up prices. The so-called "bull run" began with the increase in gold reserves by central banks, particularly by the People's Bank of China.
When central bank demand for gold resumed its decline, the growth in prices for safe-haven assets continued, fueled by increasing geopolitical tensions that created a climate of growing uncertainty.
Private investors, trying to protect themselves from potential future market crashes indicated by some analysts and various market indicators, have increased their exposure to assets uncorrelated with the rest of their portfolios, such as gold and silver.
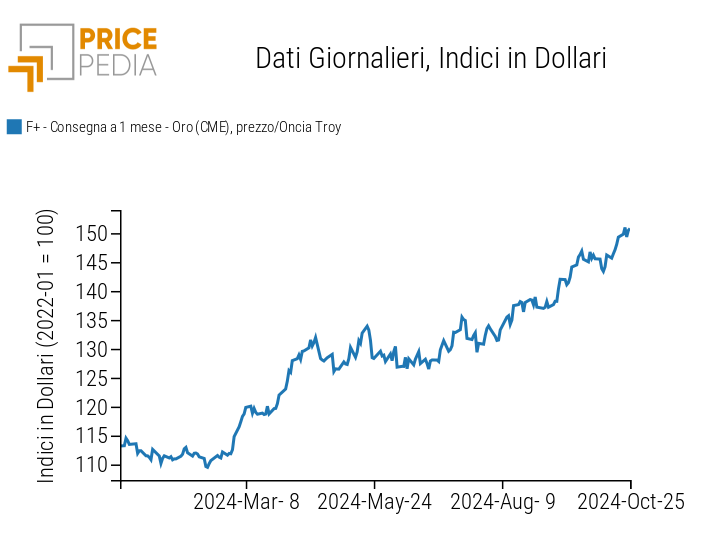
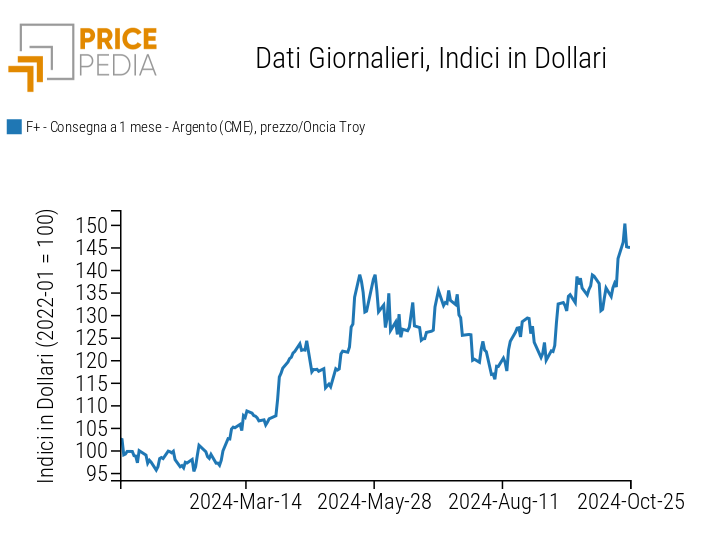
The following charts show the upward trends in the financial prices of gold and silver in 2024.
| CME Spot Price of Gold, in $/troy ounce | CME Spot Price of Silver in $/troy ounce |
|
|
From the analysis of the charts, the strong growth in prices that has characterized both precious metals is clearly evident.
Since the beginning of the year, prices for gold and silver have risen by approximately 30% and 40%, respectively.
In the last year, the greater growth of silver is attributed to both its higher demand for industrial uses and a speculative component. Unlike gold, silver has various applications in electronics, electrical engineering, photovoltaic panels, electric vehicle batteries, silverware, and photography. In particular, in recent years, demand for silver related to the energy transition has increased, especially for its use in photovoltaic panels and electric vehicle (EV) batteries.
The growth of silver supported by speculative factors is due to the fact that traders tend to prefer the silver market over the gold market for speculative actions, thanks to its greater volatility and lower trading values. The smaller market size allows speculators to maneuver the financial price of silver through coordinated purchases or sales. This type of dynamics would be more difficult to replicate within the gold market, which, in addition to being significantly larger, is more demanded by long-term investors due to its greater uncorrelation with other assets. This leads to gold maintaining greater price stability over the long term, unlike silver, which can experience more intense price fluctuations. This latter aspect is particularly evident when comparing the financial prices of gold and silver over a sufficiently long time period.
The following chart shows the comparison between the financial prices of gold and silver quoted at the London Bullion Market Association (LBMA) since 1960.
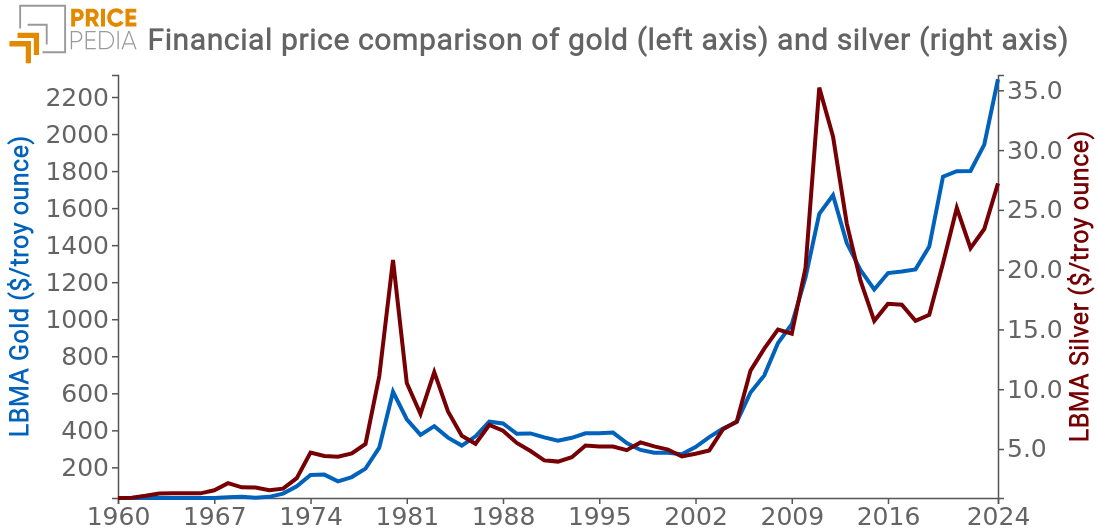
The historical comparison between the financial prices of gold and silver reveals two price cycles in which silver recorded significantly stronger variations compared to those of gold.
The first cycle began in 1979 when the Hunt brothers attempted to monopolize the silver market. The two brothers, along with a group of Arab investors, managed to control about 77% of the world's silver reserves by purchasing silver using futures contracts.
The financial bubble burst when the U.S. government sold its silver reserves to combat market turmoil caused by the Hunt brothers, who were subsequently accused of market manipulation and insider trading by the Securities and Exchange Commission (SEC).
The second bubble in the financial prices of silver began in 2010, amid the sovereign debt crisis in Europe, the sudden increase in silver demand from the photovoltaic industry, and the significant weakness of the U.S. dollar.
Speculators made extensive use of leverage to increase their exposure to the rising prices of silver, which reached historic highs during those years. The bubble burst after the FED announced the end of Quantitative Easing (QE), causing a strengthening of the U.S. dollar and a rapid wave of silver sales by traders and investment firms.
Do you want to stay up-to-date on commodity market trends?
Sign up for PricePedia newsletter: it's free!
Silver Prices, Industrial Commodities, and Non-Ferrous Metals
Historically, silver prices have often anticipated the trends of industrial commodities, particularly non-ferrous metals. The reason lies in a "mimetic" effect that silver exerts on non-ferrous metals, especially. Traders and institutional investors monitor silver to gain signals about future trends in metal markets, both during growth phases and declines. The relationship between the price dynamics of silver and non-ferrous metals appears to be probabilistic, in the sense that an increase (decrease) in the price of silver creates the conditions for an increase (or decrease) in the price of non-ferrous metals.
The following graph shows a comparison between the financial and customs prices of silver and the indices of industrial commodities[1] and non-ferrous metals in the EU.
Comparison between the financial prices of silver, industrial commodities, and non-ferrous metals
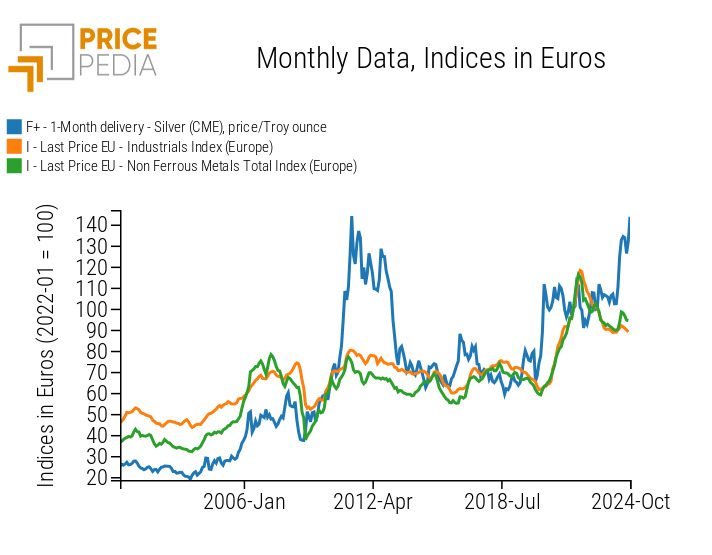
From the analysis of the graph, it is evident that silver prices have often anticipated the dynamics of the Industrial index (Europe) and the non-ferrous index (Europe).
The most obvious anticipation in terms of price reductions occurred during the 2008 crisis, while the most evident anticipation in terms of price increases characterized the mid-2020 period.
In 2024, there was also a strong increase in silver prices, but in this case, the effect seems to have stabilized the dynamics of non-ferrous metals, preventing weak demand from translating into a reduction of their prices even in 2024.
Conclusions
This analysis highlighted the main differences in the financial dynamics of gold and silver prices. Gold prices have shown greater stability, while silver prices have proven more sensitive to variations in demand for industrial uses and speculative components.
Silver has experienced periods of high volatility, such as during the cycles of 1979-1981 when the Hunt brothers attempted to monopolize the market, and of 2010-2013, characterized by the sovereign debt crisis, the sudden growth in demand from the photovoltaic industry, and the weakness of the U.S. dollar.
The analysis also highlighted how the financial and customs prices of silver tend to anticipate the trends of industrial commodity prices, particularly non-ferrous metals.
[1] The PricePedia index for the price of Industrial (Europe) results from the aggregation of indices related to the following product categories: Ferrous, Non-Ferrous, Wood and Paper, Chemicals: Specialty, Organic Chemicals, Inorganic Chemicals, Plastics and Elastomers, and Textile Fibers.
