Cotton: interconnection between financial and physical prices
Cotton financial prices anticipate customs price dynamics
Published by Luca Sazzini. .
Cotton Textile Fibers Price DriversCotton is the most widely used natural fiber worldwide and is the second most important textile fiber after polyester.
Its production is closely linked to weather conditions, which can cause significant supply-side shocks. This aspect contributes to increased price volatility for cotton, further amplified by speculative trading activities in financial markets.
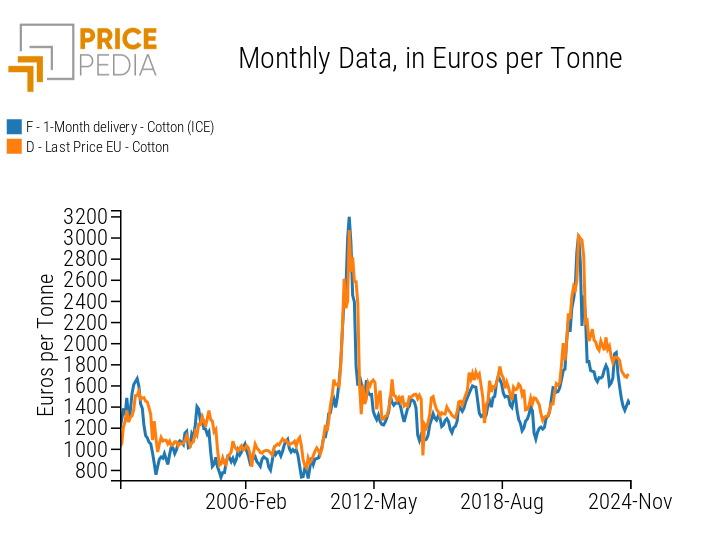
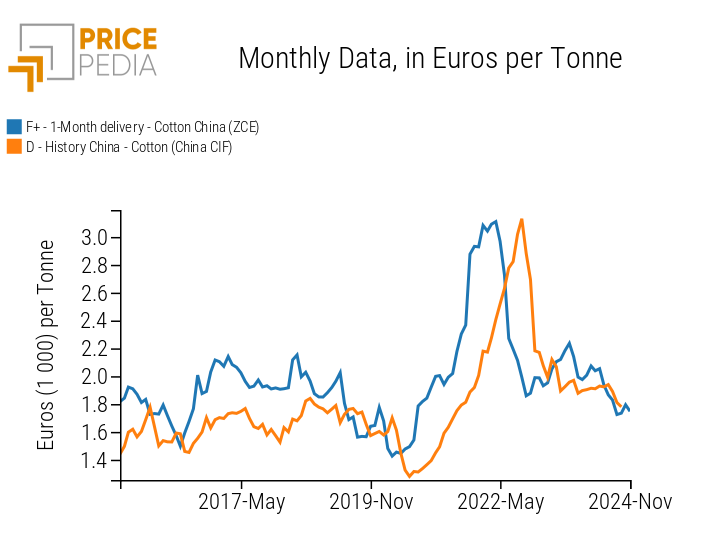
Below are the historical series of European and Chinese customs prices for cotton, compared with their respective financial benchmarks.
| Comparison of financial and customs prices for cotton, in euros/ton | |
| European prices | Chinese prices |
 |
 |
From the analysis of the historical price series, two important aspects emerge: the first concerns the price dynamics of cotton, and the second the strong interconnection between financial and physical markets. In particular, financial prices for cotton tend to anticipate the dynamics of customs prices, both in price upturns and downturns.
Cotton Price Dynamics
In the last two decades, the cotton market has been characterized by two significant price cycles: the first between 2009 and 2011, and the second between late 2020 and 2022.
In 2009, global cotton supply dropped significantly due to a combination of economic and climatic factors. Production had already been declining in previous years, as cotton’s profitability had decreased. Faced with relatively low prices and rising production costs, especially for fertilizers, many farmers had reduced the areas dedicated to cotton cultivation in favor of more profitable crops. This voluntary reduction in cotton production was compounded by an involuntary contraction due to adverse weather conditions. This supply deficit, combined with increased Chinese demand, led to a sharp rise in cotton prices, culminating in the first quarter of 2011, when financial prices more than tripled compared to early 2009 levels.
The price cycle that began in late 2020 is mainly attributable to the sudden increase in cotton demand from Brazil, India, and, especially, China. The U.S. Department of Agriculture (USDA) reported that during that period, China’s cotton stocks had run out.[1] The cotton scarcity in China, the world’s largest consumer and importer, generated a strong increase in Chinese demand, resulting in a rapid price surge.
Both of these price cycles were also characterized by strong speculative maneuvers that boosted price growth during the upward phase and led to their subsequent collapse in the downward phase.
Financial Price Anticipation
Financial cotton prices respond promptly to supply shocks in the market, from both the demand and supply sides. Their dynamics tend to anticipate those of physical prices, which react more slowly to changes in demand and supply.
To verify this aspect from a statistical point of view, the regression tool can be used.
Below is a table containing the regression outputs between customs cotton prices and their respective financial benchmarks.
To interpret the regression coefficients in terms of elasticity, prices have been considered in logarithmic form.
| Table of regression results between customs and financial cotton prices | ||||
| Dependent | Explanatory | Lag periods of the explanatory | Elasticity | R² |
| EU customs cotton price: | Cotton financial price (ICE) | 0 | 0.90 | 0.87 |
| EU customs cotton price: | Cotton financial price (ICE) | 2 | 0.92 | 0.91 |
| China customs cotton price: | Cotton financial price (ZCE) | 0 | 0.59 | 0.30 |
| China customs cotton price: | Cotton financial price (ZCE) | 5 | 0.94 | 0.77 |
From the analysis of the regression coefficients, a high elasticity between cotton financial prices and the corresponding customs prices emerges, as expected.
A 10% increase in financial prices in Europe and China causes, respectively, a delayed change in customs prices of 9.2% and 9.4%.
The analysis of the R² index, a parameter between 0 and 1 that measures the goodness of the estimated model based on its ability to capture the variability of the dependent variable, highlights that models including delays perform better than those without. In particular, in the case of China, the anticipation of financial prices is particularly relevant. Introducing delays in the model more than doubles the R² index value, highlighting the significant delay in information transmission from financial to customs markets.
Do you want to stay up-to-date on commodity market trends?
Sign up for PricePedia newsletter: it's free!
Comparison of various cotton prices
In the European customs market, cotton is traded both as raw fiber and in the form of waste and yarns.
Cotton waste represents the fiber scraps derived from spinning, weaving, and finishing processes, while cotton yarns are the result of the spinning process.
Below are two tables of annual average prices, the first showing the prices of cotton and fiber waste, and the second those of cotton derivatives.
Annual Average Prices of Cotton and Fiber Waste, in euros/ton
| 2019 | 2020 | 2021 | 2022 | 2023 | 2024 | |
|---|---|---|---|---|---|---|
| D-Last Price EU-Cotton Waste | 1142 | 1148 | 1220 | 1827 | 1782 | 1506 |
| F-1 Month Delivery-Cotton (ICE) | 1322 | 1238 | 1732 | 2349 | 1689 | 1581 |
| D-Last Price EU-Cotton | 1508 | 1382 | 1780 | 2528 | 1984 | 1775 |
| F+-1 Month Delivery-Cotton China (ZCE) | 1746 | 1597 | 2294 | 2506 | 2055 | 1900 |
| D-Historical China-Cotton (China CIF) | 1708 | 1456 | 1702 | 2626 | 2011 | 1902 |
Annual Average Prices of Cotton Derivatives, in euros/ton
| 2019 | 2020 | 2021 | 2022 | 2023 | 2024 | |
|---|---|---|---|---|---|---|
| D-Last Price EU-Cotton Yarn of Uncombed Fibers | 2275 | 2172 | 2585 | 3763 | 2928 | 2547 |
| D-Last Price EU-Cotton Yarn of Combed Fibers | 2945 | 2714 | 3673 | 5198 | 3594 | 3341 |
| F+-1 Month Delivery-Cotton Yarn China (ZCE) | 2829 | 2392 | 3271 | 3486 | 2876 | 2572 |
| D-Historical China-Cotton Yarn of Uncombed Fibers (China CIF) | 1981 | 1763 | 2175 | 2588 | 2099 | 1946 |
| D-Historical China-Cotton Yarn of Combed Fibers (China CIF) | 2820 | 2544 | 3142 | 4254 | 3239 | 3240 |
From the analysis of cotton prices, a common trend emerges that characterizes all types reported in both tables.
From 2019 to 2020, there was a general decrease in annual cotton prices, followed by a subsequent period of increase that ended in 2022. Since then, annual cotton prices have returned to decline but remain at higher levels compared to 2019.
In terms of levels, customs prices for cotton tend to be slightly higher in China, while yarn prices are slightly higher in Europe.
Conclusions
The analysis presented in this article highlighted the strong relationship between financial and customs prices of cotton, with the former significantly anticipating the dynamics of the latter.
Financial markets tend to react more quickly to sudden shocks on the demand and supply side, anticipating physical price trends in both growth and decline phases.
Net of delays, the elasticity between financial and customs prices of cotton tends to be around 0.9, meaning that a 10% increase in financial prices corresponds to a 9% increase in customs prices.
From the analysis of annual averages, a strong alignment among various cotton prices in the two analyzed geographic areas emerged, highlighting similar price dynamics. In terms of levels, customs prices for cotton tend to be slightly higher in China, while yarn prices are slightly higher in Europe.


