Hourly and Daily Effects on the PUN Price
The Variations in Hourly and Daily Electricity Demand as a Significant Component of the PUN Price
Published by Riccardo Pondini. .
Electric Power Price DriversIn the article The impact of renewable sources on the Italian PUN, a regression analysis is described that explains the variations in the hourly PUN price of Italian electricity as a function of gas price, CO2 certificate costs, and the share of electricity production from renewable sources. The results of this analysis are very significant and successfully explain the hourly PUN prices recorded over a period of more than 5 years.
The impact of demand by hour and day
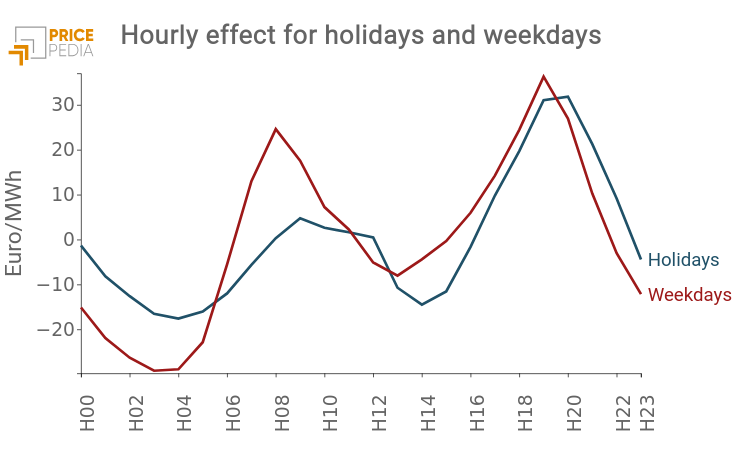
In this article, we check if these estimates can be further improved by also including variations in demand across different hours of the day and between weekdays and holidays. For this purpose, we considered the residuals of the regression described in the cited article and calculated the average residual for each hour of the day over the last 5 years, distinguishing between holidays[1] and weekdays.
The following chart shows the results obtained: each point on the two curves represents the additional (positive) or diminishing (negative) effect that the time of day has on the PUN price. For example, at 8:00 AM on weekdays, the PUN price is on average more than 20 euros/MWh higher than the average, assuming constant gas price, CO2 certificate cost, and the share of electricity production from renewable sources. This value can be considered the average contribution of electricity demand at that hour to the PUN price.

From the analysis of the chart, the following elements emerge:
- During daytime hours, the PUN price is generally higher on weekdays than on holidays, while the opposite is true during evening and night hours.
- The impact of demand reaches peaks in the evening hours, with slightly higher values after the peak on holidays.
Do you want to stay up-to-date on commodity market trends?
Sign up for PricePedia newsletter: it's free!
The impact of seasonality on PUN prices
The above chart clearly shows how variations in demand by hour and day of the week influence the PUN price. It may be useful to check if electricity demand can also affect the PUN over the months of the year. For this analysis, we calculated the monthly averages of the residuals from the basic PUN equation, previously used to calculate hourly and daily averages.
The following chart shows the results obtained.

The analysis of this chart highlights a significant seasonal effect in July, a month in which the average residual is positive with a maximum peak. This means that, due to higher demand, PUN prices in July, assuming other conditions remain constant (gas price, CO2 certificate cost, and the share of energy from renewable sources), are on average 10 euros/MWh higher than the average. On the contrary, in January and February, the demand effect on the PUN is limited, resulting in lower average prices.
A regression inclusive of hourly and daily effects
The persistence of effects at the hourly, daily, and monthly levels suggested that we re-estimate the basic PUN equation, including among the regressors some specific dummy variables capable of capturing the effects of varying demand across different hours of the day, days of the week, and months of the year.
To this end, we used the panel data technique, considering as a reference base the morning time slot, weekdays, and the summer period. We then included the following additional regressors:
- 3 specific dummies, each with a value of 1 for the afternoon, evening, and night time slots, respectively;
- 1 specific dummy with a value of 1 for holidays;
- 3 specific dummies with a value of 1 for the autumn, winter, and spring periods, respectively.
The regression coefficient results are shown in the table below. Statistically, these results are particularly valid. In addition to the high significance of the estimated parameters, the R² of the estimate is over 90%, meaning that this equation explains more than 90% of the hourly PUN price variability over a period of more than 5 years, characterized by significant turbulence in the Italian and, more broadly, European electricity market.
| Variables | coef | std err | t | P>|t| | [0.025 | 0.975] |
|---|---|---|---|---|---|---|
| const | 70.7231 | 0.972 | 72.778 | 0.000 | 68.818 | 72.628 |
| SFER | -1.1034 | 0.016 | -69.318 | 0.000 | -1.135 | -1.072 |
| PSV | 1.7839 | 0.004 | 487.168 | 0.000 | 1.777 | 1.791 |
| CO2 | 0.3908 | 0.007 | 57.367 | 0.000 | 0.378 | 0.404 |
| Holiday | -13.5522 | 0.423 | -32.044 | 0.000 | -14.381 | -12.723 |
| Night | -32.2719 | 0.450 | -71.671 | 0.000 | -33.153 | -31.389 |
| Afternoon | -1.7641 | 0.420 | -4.204 | 0.000 | -2.587 | -0.942 |
| Evening | 2.6212 | 0.467 | 5.611 | 0.000 | 1.706 | 3.537 |
| Winter | -10.8837 | 0.445 | -24.433 | 0.000 | -11.757 | -10.010 |
| Spring | -3.6981 | 0.447 | -8.274 | 0.000 | -4.574 | -2.822 |
| Autumn | -5.1265 | 0.446 | -11.498 | 0.000 | -6.003 | -4.253 |
The regression results are interesting from various perspectives. First, it is noteworthy that the introduction of hourly, daily, and monthly dummies did not change the values of the coefficients of the other variables (PSV gas price, CO2 certificate price, and SFER share of electricity produced from renewable sources), except marginally. This confirms the robustness of the results obtained.
The estimated coefficients for the various dummy variables are particularly significant, revealing the following information:
- on holidays, the PUN price is on average 13.6 euros/MWh lower than the average PUN of weekdays;
- during night hours, the PUN price is on average 32.3 euros/MWh lower than the morning time slot; this differential reduces to 1.8 euros/MWh for afternoon hours. Conversely, during evening hours, the PUN is on average 2.6 euros/MWh higher than morning prices;
- compared to average summer prices, the PUN price is on average 10.9 euros/MWh lower in winter and 3.7 and 5.1 euros/MWh lower in spring and autumn, respectively.
Conclusions
This article describes the results of an econometric estimate capable of explaining with high precision the hourly PUN prices for electricity in Italy over a period of more than 5 years. The PUN determinants are:
- on the cost and supply side: gas price, CO2 certificate price, and the share of electricity production from renewable sources;
- on the demand side: variations in demand throughout the day, between weekdays and holidays, and over the different months of the year.
The high quality of the statistical parameters obtained in this analysis suggests the possibility of continuing the study for predictive purposes.
[1] We considered as holidays the Sundays and every public holiday in the Italian calendar included in the dataset range, which goes from 2019-10-31 to 2024-09-30.


