The impact of renewable sources on the Italian PUN: a detailed analysis
In the Italian energy market, the effect of renewables becomes significant when they exceed 40% of total production
Published by Emanuele Altobel. .
Electric Power Price Drivers
Even in Italy, the phenomenon whereby the hourly National Single Price (PUN) can drop to near-zero levels has begun to be observed. As described in The impact of renewable sources on the Italian PUN, this event occurs when the share of electricity generated from renewable sources is such that the use of gas plants becomes unnecessary, allowing only plants with lower marginal costs to operate.
The aim of the analysis presented in this article is to identify the renewable production threshold beyond which significant effects on the PUN price start to manifest.
To this end, we will first analyze the characteristics of energy production from renewable sources and then use a statistical regression tool to determine the threshold level.
Monthly Renewable Energy Production
Electricity can be generated using various technologies considered renewable. Among these, the most relevant for the Italian energy market are:
- hydropower;
- wind;
- photovoltaic;
- self-consumption, i.e., renewable energy production consumed directly by the producer.
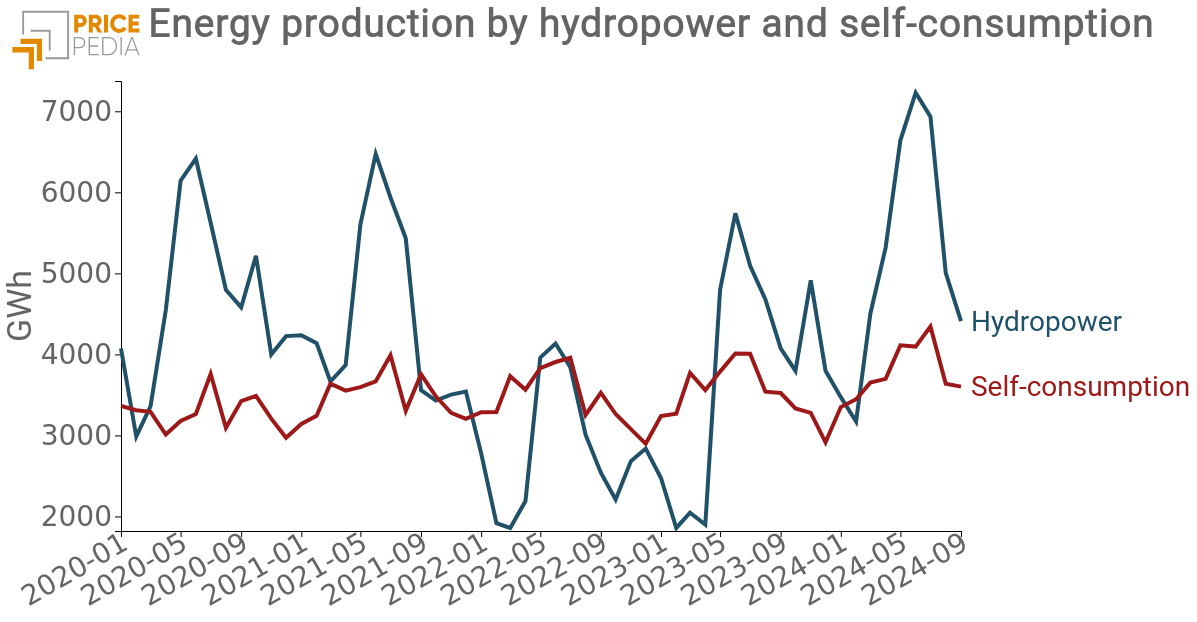
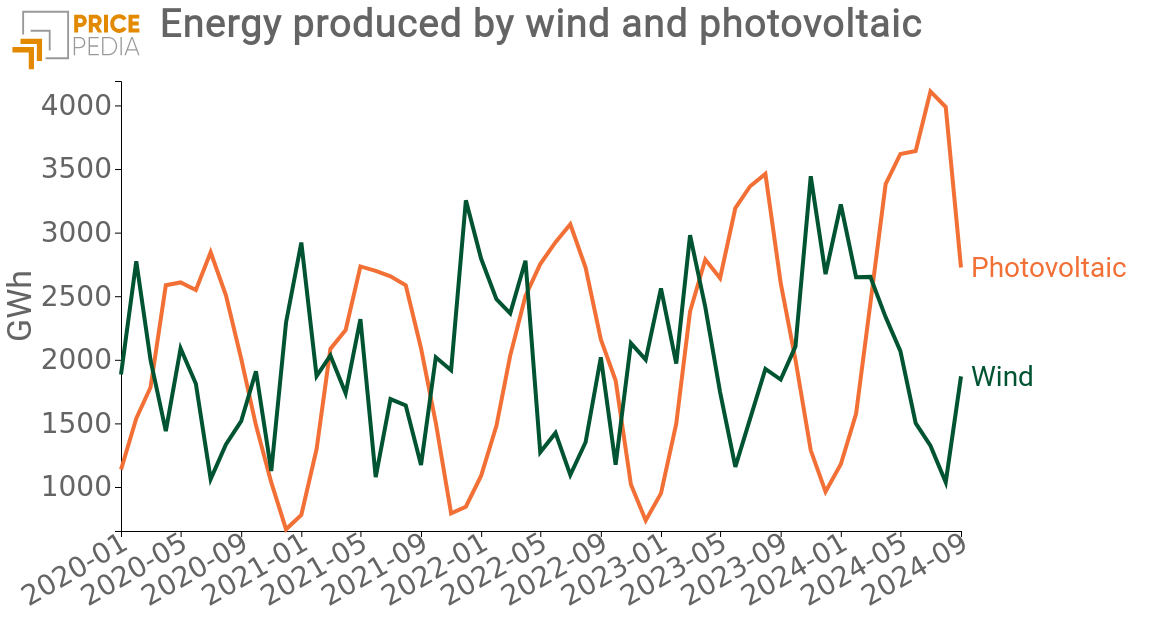
The following graphs show the monthly production of these four sources over the past 5 years: the first presents hydropower and self-consumption technologies, while the second shows wind and photovoltaic production.
 |
 |
The data analysis clearly highlights the following aspects:
- Hydropower production is the most substantial; however, the drought of 2022 significantly limited production levels that year.
- Photovoltaic and wind production shows strong complementarity. In the summer months, when photovoltaic production is at its peak, wind production is minimal. The opposite occurs in winter, with maximum wind production and minimal photovoltaic production. In spring and autumn, the two contributions tend to average out.
- The greatest variability is represented by hydroelectric production, while self-consumption from renewable sources shows relative stability throughout the period considered.
Hourly production share from renewable sources
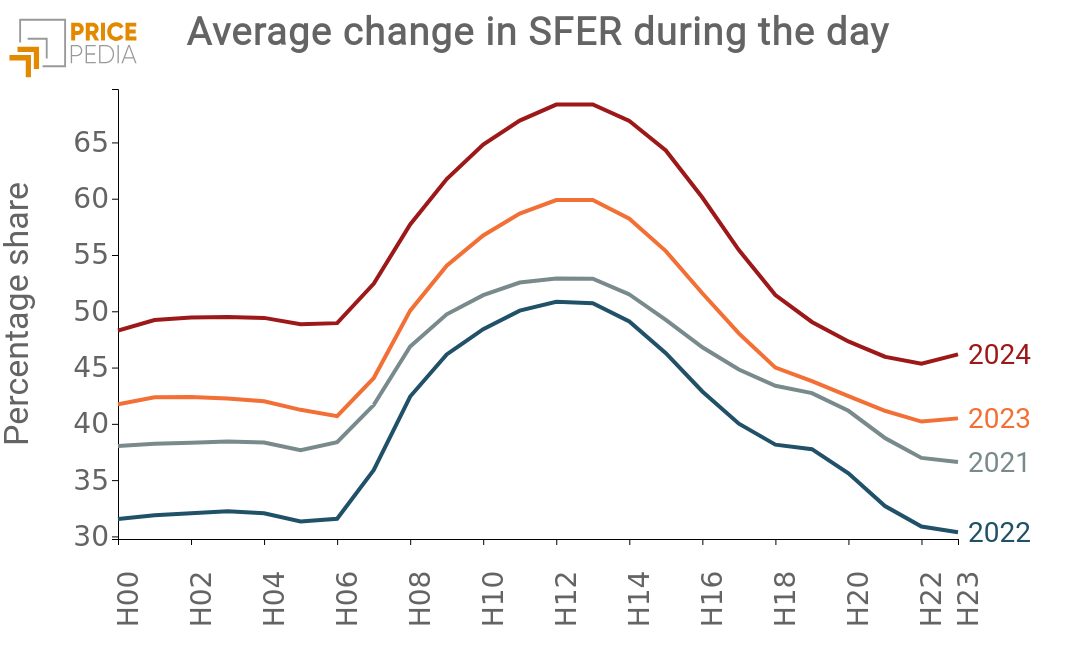
The variability of renewable sources is high not only throughout the year but also within individual days, with very different production shares at various hours. The following graph shows the average hourly production share curves from renewable sources for the years 2021, 2022, 2023, and the first 10 months of 2024.

This graph shows how hourly variability tends to remain consistent over the years. The hours of maximum hourly production from renewable sources are during the day, peaking at 12 and 1 p.m.
Moreover, the graph shows a significant increase in the share from renewables recorded this year. In particular, between 11 AM and 3 PM, the share of production from renewable sources averages above 65%.
Do you want to stay up-to-date on commodity market trends?
Sign up for PricePedia newsletter: it's free!
Impact of renewables on the PUN
The functioning of the Italian energy market aligns the PUN price with the marginal costs of the least efficient producer. This marginal producer varies according to the level of hourly demand and the supply of the most efficient producers. When renewable electricity production increases, the need to activate less efficient plants decreases. The result is an increase in the efficiency of the marginal producer and, ceteris paribus, a consequent reduction in the PUN price.
The increase in the share of energy produced from renewable sources suggests verifying if there is a threshold beyond which the reduction in PUN, due to the shutdown of less efficient plants, becomes significant.
To do so, we considered the PUN equation described in the article: "Hourly and Daily Effects on the PUN Price", which explains PUN variations not only through gas prices and CO2 certificates but also through a series of dummy variables that capture demand variation effects across different hours of the day, days of the week, and seasons of the year.
This equation has proven very precise in describing hourly PUN variations over the past 5 years. To further improve its accuracy, we also included the renewable production share among the regressors, testing various thresholds beyond which the effect is significant in explaining PUN levels. The table below shows the R² statistic value for the hypothetical thresholds.
Table 1: coefficients, p-value and R2
| SFER share | Coefficients | P-Value | R2 |
| > 55% | -1.81 | 0.000 | 0.924 |
| > 50% | -1.61 | 0.000 | 0.925 |
| > 45% | -1.51 | 0.000 | 0.926 |
| > 40% | -1.45 | 0.000 | 0.926 |
| > 35% | -1.40 | 0.000 | 0.926 |
| > 30% | -1.31 | 0.000 | 0.926 |
Based on this analysis, the threshold beyond which renewable energy production seems to produce significant effects is 40%.
Conclusions
In Italy as well, in 2024, cases are occurring where the increase in electricity production from renewable sources allows for the shutdown of less efficient plants, leading to a reduction in the PUN.
The strong variability of the renewable production share makes cases of PUN price reductions uncertain. However, it is possible to explore the existence of a threshold beyond which the probability of these reductions becomes significant, providing useful information for predictive purposes.


