Measuring the scarcity of a commodity: the case of styrene
How comparing costs and prices reveals the scarcity of a commodity
Published by Luigi Bidoia. .
Organic Chemicals basic thermoplastics Analysis tools and methodologiesThe analysis of price formation mechanisms in global commodity markets identifies three main categories of determining factors:
- production costs,
- the scarcity of the good in the market,
- expectations of future prices.
These three factors have a variable influence depending on the type of commodity. For example, in the case of oil, production costs play a relatively minor role, as the price is more significantly influenced by the scarcity of oil and, above all, by expectations of future prices.
Conversely, for non-traded commodities, the physical price is only indirectly influenced by expectations of future prices. In these cases, expectations can affect the current price only if they lead to a change in desired inventories, thus altering the scarcity of the good. Only in the presence of a structured financial market can expectations of future prices directly impact current prices through intertemporal arbitrage operations carried out by traders.
The analysis of these three main categories of factors is essential for understanding market behavior and the mechanisms behind commodity price determination. As previously mentioned, the markets for commodities traded on an exchange are more complex to analyze due to the interactions between financial prices and physical prices. In this article, we will focus exclusively on the markets for non-traded commodities, whose prices are primarily determined by production costs and the scarcity of the good.
Analysis of Non-Traded Commodity Markets
The first step in analyzing market behavior is to precisely measure the key factors influencing it. Without a reliable measurement of these factors, it becomes difficult to validate any hypothesis, making it challenging to distinguish between valid and invalid assumptions.
From a data collection perspective, prices and costs are relatively simple to measure, while estimating the scarcity of the good is far more complex. However, it is possible to obtain an indirect measure of scarcity by comparing price trends with cost trends. If prices tend to rise faster than costs, this may indicate an increase in the scarcity of the good. Conversely, if prices increase more slowly than costs or decrease more rapidly, this could suggest a reduction in scarcity.
The dynamics of the price-to-cost ratio can therefore be considered an indirect measure of changes in the scarcity of the good over time.
Estimating the production costs of a commodity is often a complex activity and subject to a certain margin of error. In some cases, however, it is possible to observe costs directly in the market by analyzing the price of an input that represents a significant share of the total production costs of the commodity in question. A relevant example is styrene, whose production costs largely depend on the price of ethylbenzene, an essential component in the production process.
Do you want to stay up-to-date on commodity market trends?
Sign up for PricePedia newsletter: it's free!
The Case of Styrene
Styrene is a key monomer used in the production of thermoplastics and engineering polymers, including polystyrene, ABS resins, SAN resins, and many other polymers. It is primarily produced through the dehydrogenation of ethylbenzene, which is itself obtained by combining ethylene and benzene. Styrene production facilities are generally integrated and use ethylene and benzene as primary inputs.
The market for ethylbenzene is significantly smaller than that for styrene, but it is not negligible. There are applications for ethylbenzene beyond styrene production, creating a physical market where supply and demand determine its price.
Since the dehydrogenation process for ethylbenzene entails relatively low costs, the market price of ethylbenzene can be considered a good approximation of styrene production costs.
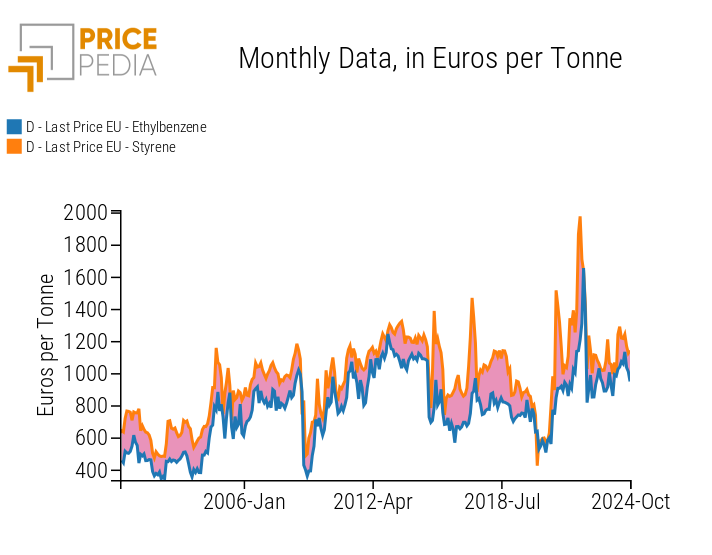
The following graph compares the customs price of styrene with that of ethylbenzene, highlighting the correlation between their price dynamics. Changes in the price of ethylbenzene tend to translate into proportional changes in the price of styrene, reflecting its strong dependence on production costs.
The graph also highlights, in pink, the area between the two prices. This visualization helps identify periods when styrene prices increased significantly more than ethylbenzene prices, indicating phases of scarcity of styrene in the European market.
Price of ethylbenzene and styrene in euro/tonne

The comparison between styrene prices and its production costs (measured through the price of ethylbenzene) highlights four significant phases of scarcity. All these phases occurred during the spring months, suggesting greater market sensitivity to potential commodity shortages during this time of the year.
The first two phases, which occurred in the springs of 2015 and 2017, were driven by increased styrene consumption in the United States, leading to a reduction in exports to the European Union. The phase in 2021 reflected the international shipping logistics crisis and strong demand from European companies, which sought to build precautionary stockpiles. Finally, the 2022 phase was closely tied to Russia's invasion of Ukraine and the subsequent European sanctions.
The Styrene Price Cycle in 2022
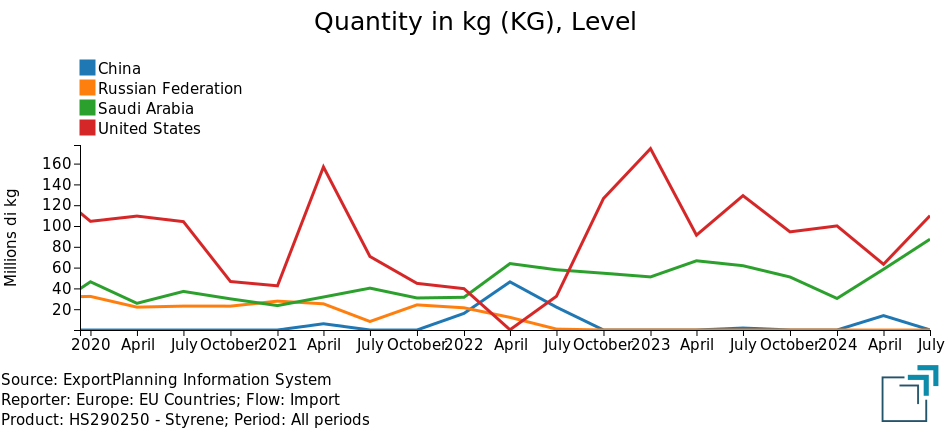
The fourth phase of a significant increase in styrene prices, disproportionate to the changes in its production costs, occurred in the aftermath of Russia's invasion of Ukraine in February 2022. By March, the European Union had introduced sanctions against Russia, including a ban on EU companies importing styrene. The effects were immediate: styrene imports from Russia to the EU quickly declined, eventually ceasing altogether (orange line in the graph shown here).
EU imports of styrene from major partners

This situation was compounded by the usual seasonal contraction of imports from the United States (red line on the graph), further exacerbating the styrene shortage in the European market. This scarcity prompted some importers to seek additional sources of styrene from Saudi Arabia (green line) and China (blue line).
Over the summer, the situation began to stabilize, but without significant price reductions due to the concurrent rise in ethylbenzene prices. Only in the autumn, with an increase in styrene imports from the United States and a decline in ethylbenzene prices, did the conditions emerge for a sharp drop in styrene prices, which occurred in September 2022.
The Situation at the End of 2024
The comparison of recent data on styrene and ethylbenzene prices indicates that the European market currently does not exhibit conditions of scarcity for styrene. This observation is supported by an analysis of import flows, which have reached historically high levels, particularly from the United States and, even more so, from Saudi Arabia.
Barring any significant increases in production costs (for example, due to rising oil prices), no substantial price increases for styrene are expected in the coming months.
Conclusions
The analysis of the factors that determine commodity prices becomes significantly easier when the various contributing elements can be reliably measured. While costs and prices are relatively straightforward to quantify, supply and demand are variables for which detailed and consistent quantitative data over extended periods are rarely available, making it difficult to interpret their dynamics.
From a market analysis perspective, it is not always necessary to have distinct measurements of supply and demand. Instead, it is often sufficient to use their combination, which can be referred to as the "scarcity of the good."
In cases where a commodity is not traded on financial markets and a reliable measure of its production costs is available, the ratio of prices to costs can serve as a valid proxy for scarcity.
The case study on styrene discussed in this article illustrates how this proxy for scarcity can be effectively used to interpret specific market dynamics. This approach provides valuable insights, such as identifying the seasons when supply shortages are most likely to occur (e.g., spring) or assessing the current balance of supply and demand in the European market.


