Effect of Russia-Ukraine escalation on commodity prices
Increased uncertainty drives up gold and energy prices
Published by Luca Sazzini. .
Conjunctural Indicators Commodities Financial WeekWeekly Summary of Commodity Financial Prices
The escalation of the conflict between Russia and Ukraine, caused by the deployment of North Korean troops to the front, the use of Western missiles by Kiev to strike Russian territory, and the first launch of a Russian intercontinental missile against Ukraine, has fueled market fears, driving up the prices of gold and energy commodities.
Concerns about a possible escalation were amplified by Vladimir Putin’s statements, calling the war between Russia and Ukraine a "world conflict" and threatening attacks on countries that have supplied weapons to Kiev. Additionally, a decree was approved authorizing Russia to use nuclear weapons in response to attacks by "non-nuclear states" supported by nuclear powers.
These tensions primarily affected energy prices, especially due to Russian attacks on Ukrainian energy infrastructure, which increased the risk of counterattacks on Russian facilities. This scenario led to a rise in oil prices, further exacerbated by the shutdown of the Norwegian Johan Sverdrup field due to a power outage and a reduction in crude oil production at the Tengiz field in Kazakhstan for maintenance work.
Although part of the Johan Sverdrup field’s production has already been restored, it will still take time before the facility can return to full operational capacity.
The natural gas market was also impacted by the escalation of geopolitical tensions.
The TTF Netherlands price continued to rise, although fears of potential disruptions to Russian gas flows to Europe did not materialize. The suspension of Gazprom supplies to the Austrian company OMV did not have a significant impact on Europe’s gas supply, as volumes originally destined for OMV were sold to other buyers or intermediaries, who subsequently resold them on the European market.
However, the highest increases in natural gas prices were recorded not in the TTF Netherlands but at the Henry Hub in the USA, which was influenced by lower storage levels and colder-than-expected temperatures in the United States.
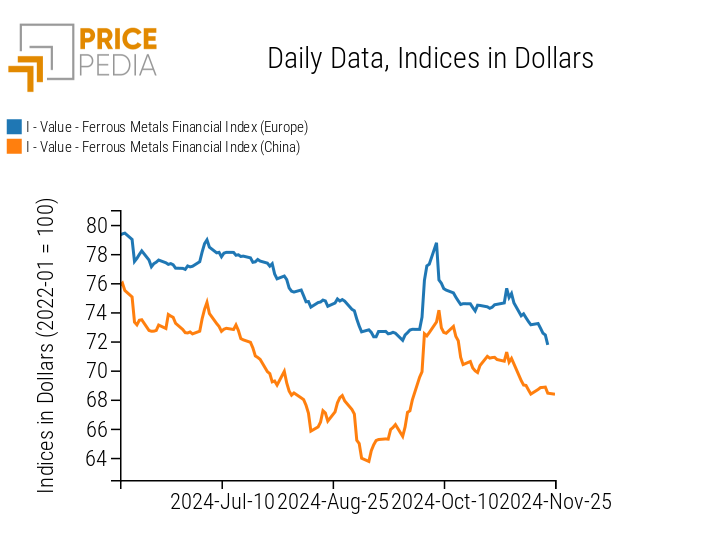
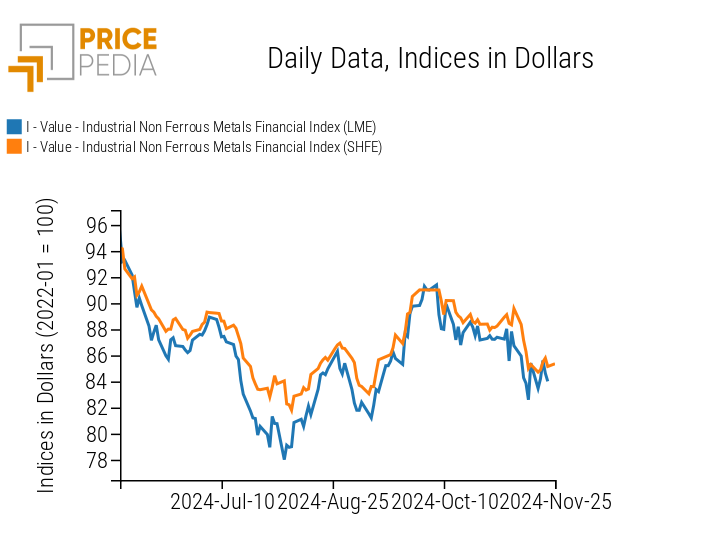
In the metals sector, the European ferrous metals market continued its gradual decline in prices, while markets for other industrial metals remained relatively stable. Last week's announcement by the Chinese finance minister to eliminate tax rebates on aluminum and copper exports was not enough to support a recovery in non-ferrous metals prices, which continue to be marked by a strong weakness in global demand.
In the food market, prices of oils have fallen, and there continues to be a phase of volatility for cereals and tropical products.
PMI
Eurozone
In November, the flash estimates of the Purchasing Managers Index (PMI) signal a contraction in the economy in the eurozone.
The flash estimate of the composite PMI stands at 48.1, down from 50 points in the final data for October.
The most concerning data relates to the manufacturing sector, which recorded a PMI of 45.2 points, down from 46 points in October. As mentioned in last week's article: "Commodity markets put under pressure by several shocks", analysts had already expected a contraction in the manufacturing sector, but the actual figure was still below their expectations, which indicated a PMI of 46 points. This data, along with the decline in industrial production reported last week, highlights a persistent weakness in the eurozone economy, which has been stagnant for some time with no signs of recovery.
The PMI for the services sector, which had previously shown modest growth, has fallen below the 50-point threshold.
The November data stands at 49.2, down from 51.6 in the previous month and below analysts' expectations (51.6).
United States
The new flash PMI data for November signals growth in the U.S. economy, which remains much stronger than that of the eurozone.
The composite PMI is estimated at 55.3, up from 54.1 in October.
The flash estimate of the manufacturing PMI is 48.8, below the 50-point threshold but in line with analysts' expectations and 0.3 points higher than the October figure.
The flash PMI for services stands at 57, higher than analysts' predictions (55.2) and the previous month's data (55).
Overall, the flash PMI data from the United States is positive. The leading sector of the U.S. economy remains services, while manufacturing continues to struggle.
Eurozone Inflation
This week, Eurostat confirmed that the Consumer Price Index (CPI) in the Eurozone increased by 2% year-on-year in October, slightly up from 1.7% in September, but significantly lower than the 2.9% recorded in the same month last year.
The most significant increase comes from the services component, which saw a price rise of 4% compared to October 2023.
The core CPI, excluding the more volatile items like energy, food, alcohol, and tobacco, showed an annual increase of 2.7%, in line with analysts' expectations.
ENERGY
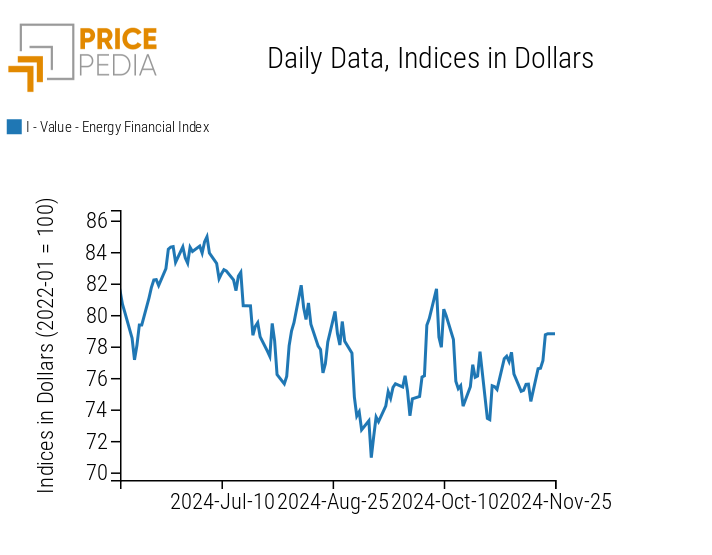
The PricePedia financial index of energy products has followed a bullish trend due to the escalation of the Russian-Ukrainian conflict.
PricePedia Financial Index of Energy Prices in Dollars
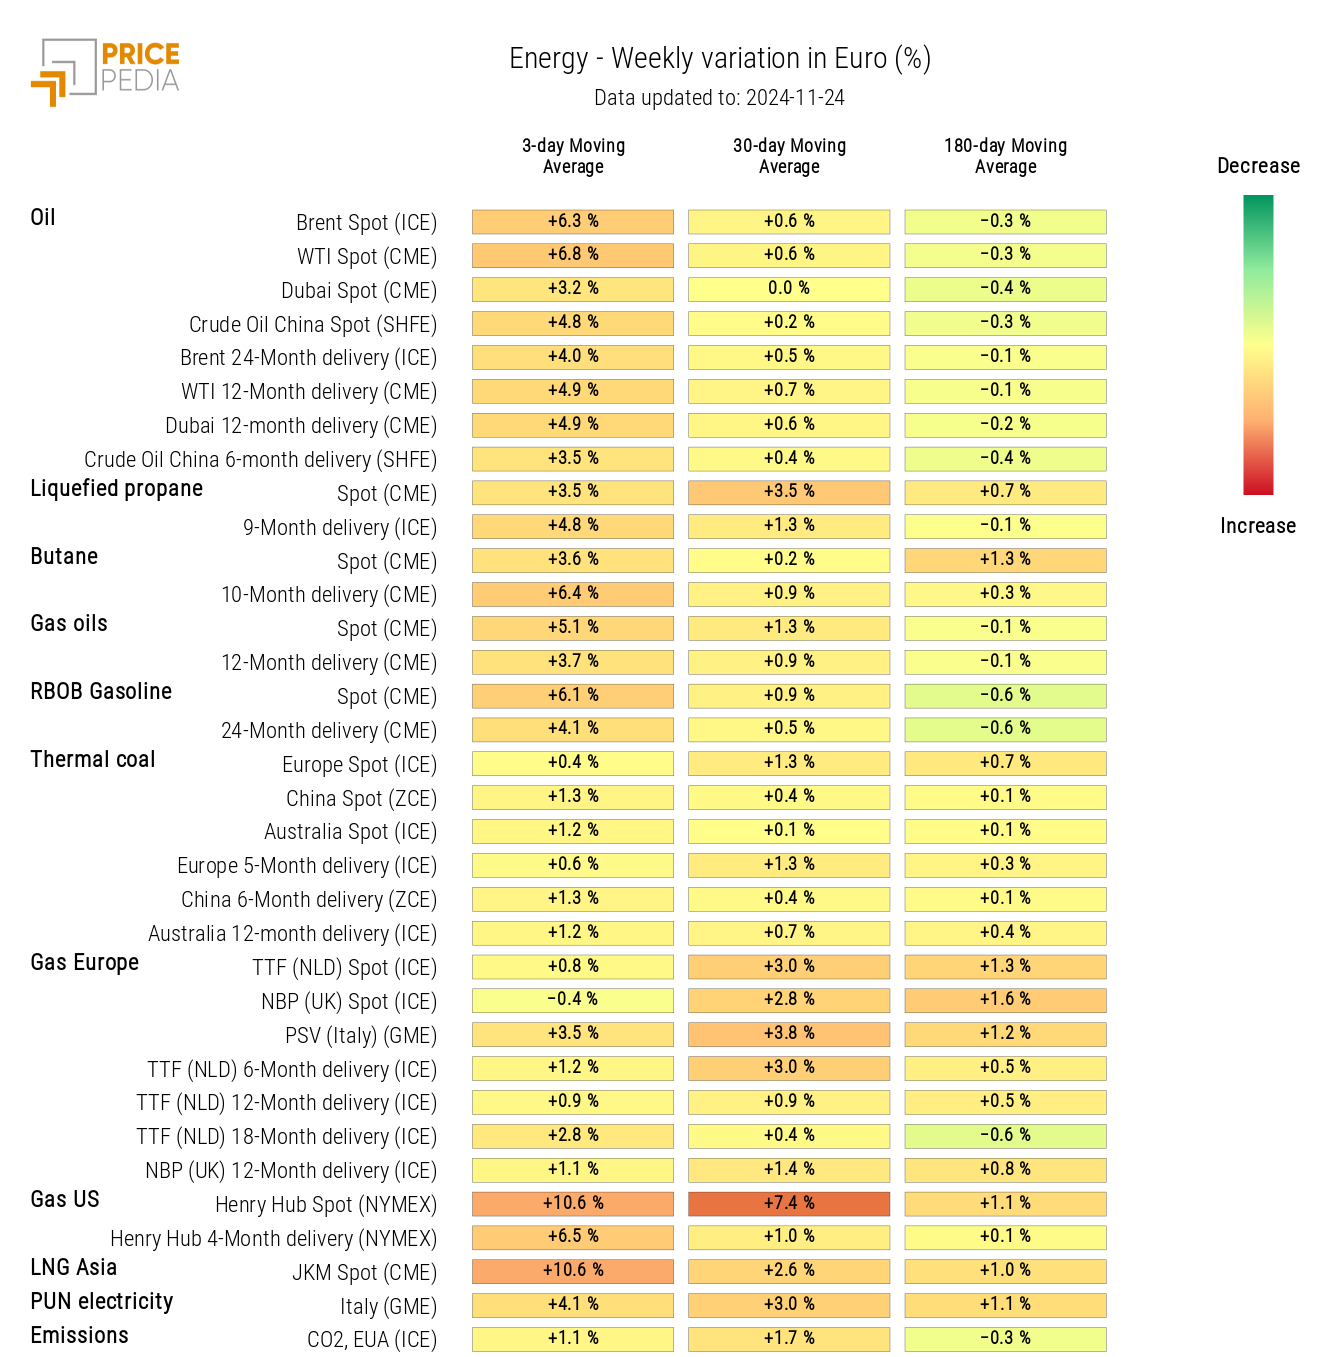
The energy heatmap highlights a general rise in energy prices, particularly for U.S. natural gas (Henry Hub).
Energy Prices HeatMap in Euro
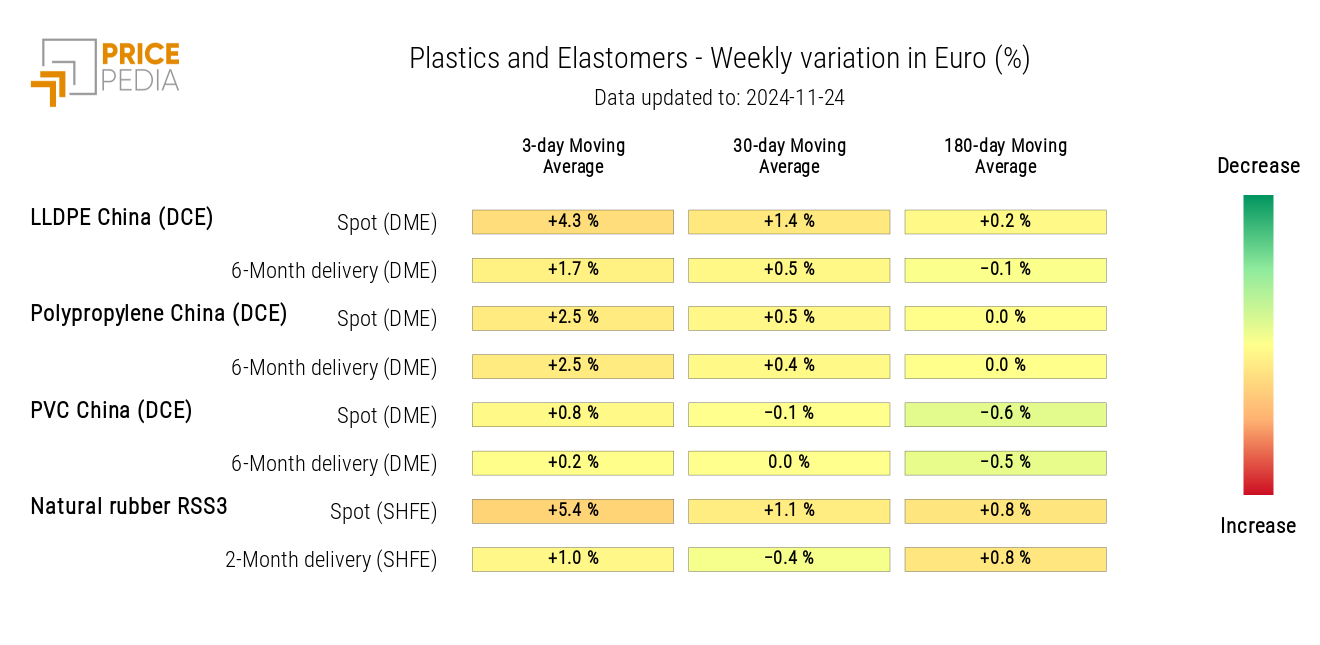
PLASTICS
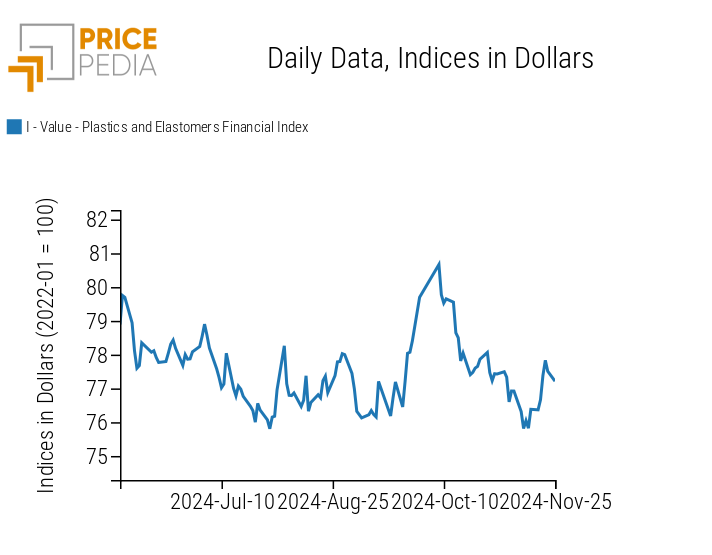
The PricePedia index for plastics and elastomers shows a rise in prices, in line with the increase in energy prices.
PricePedia Financial Indices of Plastic Prices in Dollars
The heatmap below shows an increase in the prices of LLDPE China and RSS3 natural rubber.
HeatMap of Plastic and Elastomer Prices in Euro
FERROUS METALS
The PricePedia financial index of European ferrous metals continues its downward trend, while the Chinese index remains relatively stable.
PricePedia Financial Indices of Ferrous Metals in Dollars
Do you want to stay up-to-date on commodity market trends?
Sign up for PricePedia newsletter: it's free!
NON FERROUS INDUSTRIAL METALS
The financial indices of non-ferrous industrial metals show price fluctuations that do not alter their dynamics.
PricePedia Financial Indices of Non-Ferrous Industrial Metal Prices in Dollars
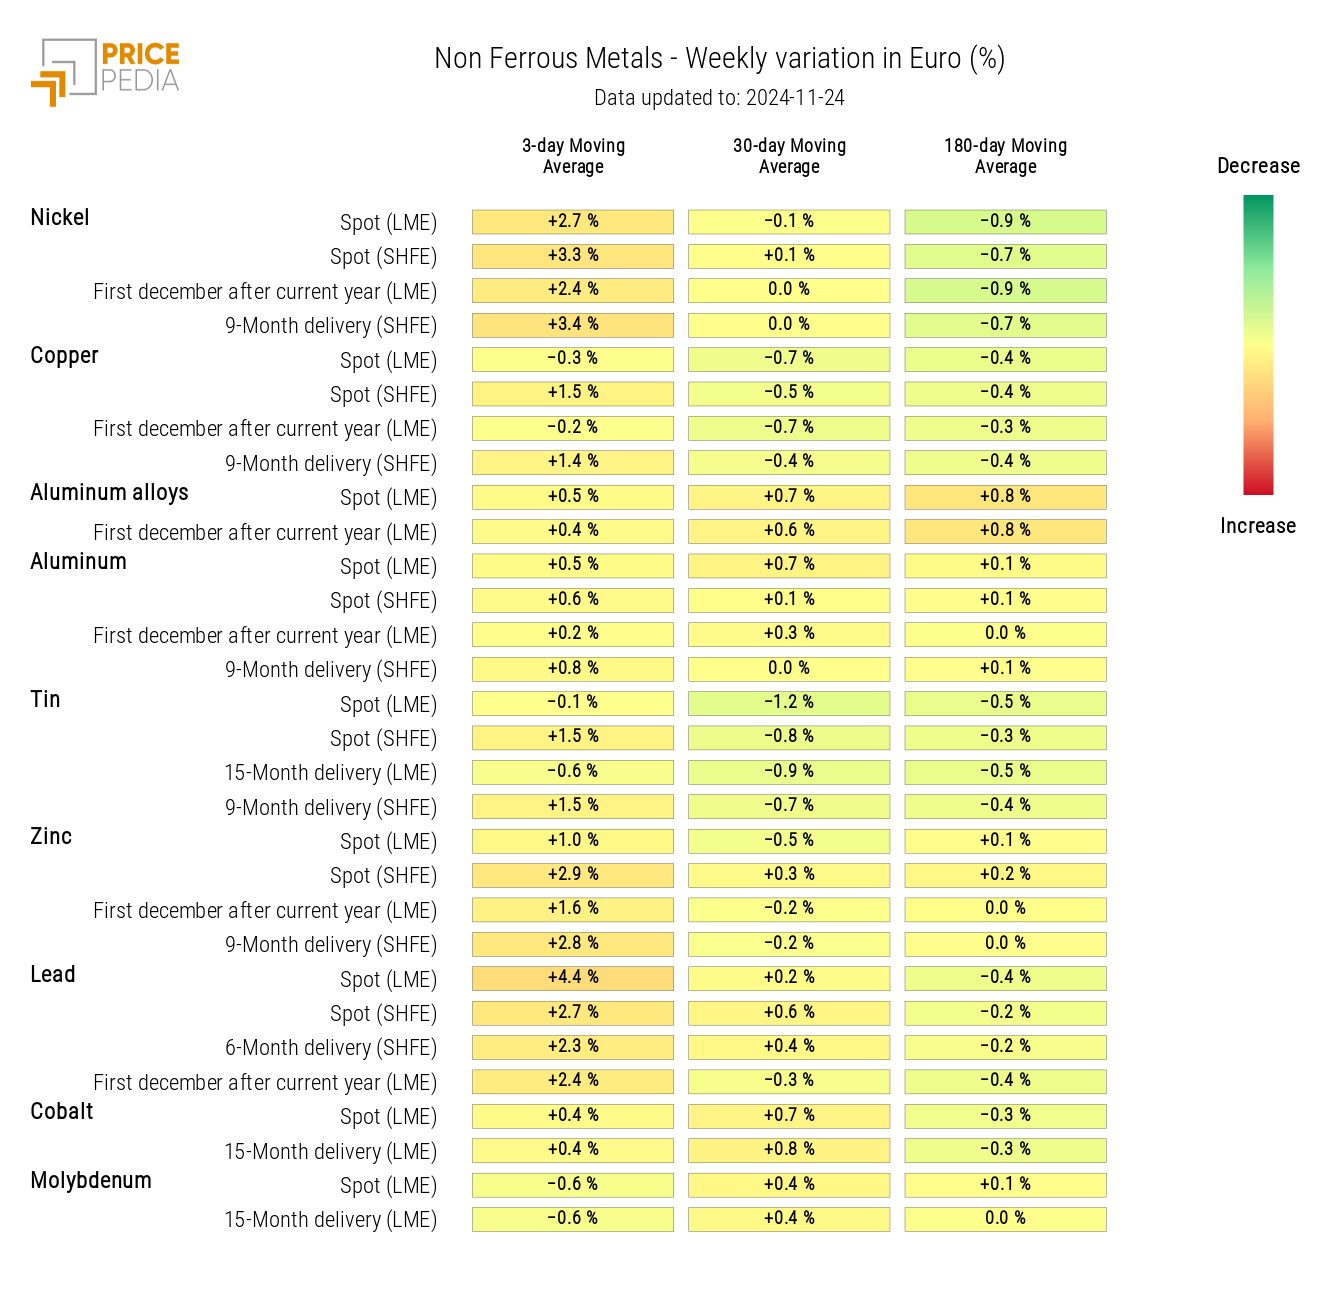
The heatmap below highlights slight increases in nickel and lead prices.
HeatMap of Non-Ferrous Prices in Euros
FOOD PRODUCTS
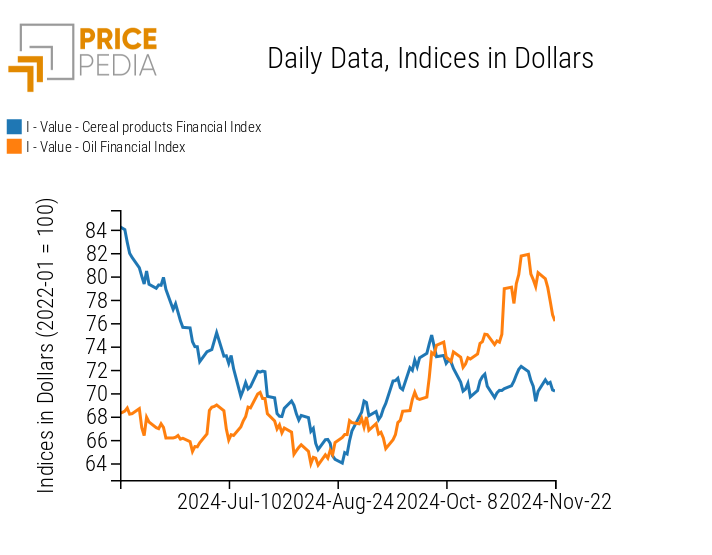
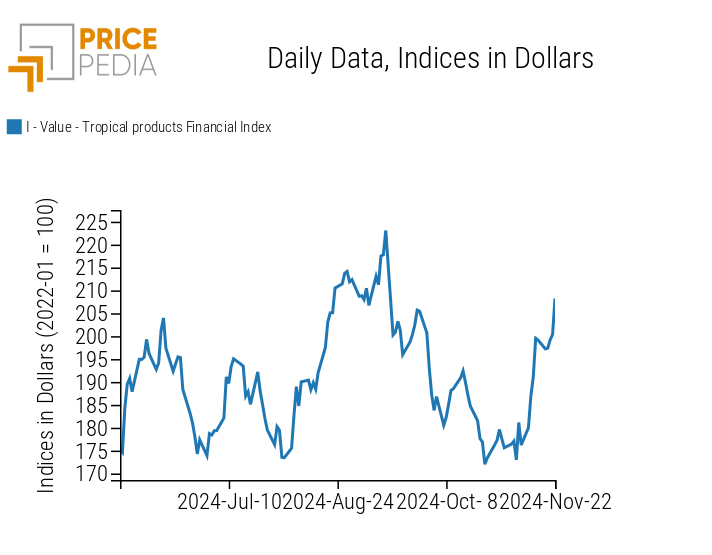
Food price indices are showing very differentiated dynamics. Specifically, there are some fluctuations in cereal indices, a continuation of the increase in tropical product prices, and a decline in the oil index.
| PricePedia Financial Indices of Food Prices in Dollars | |
| Cereals and Oils | Tropical Products |
|
|
CEREALS
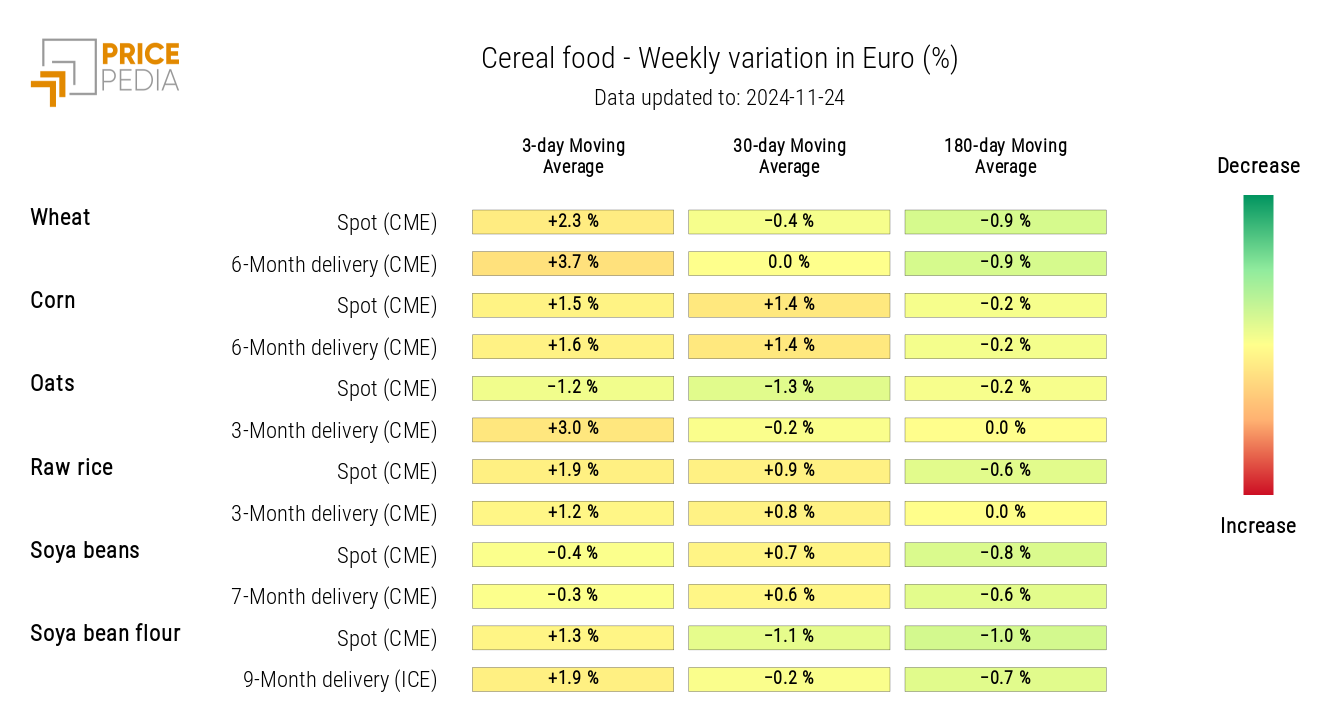
The cereal heatmap shows an increase in wheat prices, attributed to the escalation of the Russia-Ukraine conflict and a poor harvest in France.
HeatMap of Cereal Prices in Euros
TROPICAL PRODUCTS
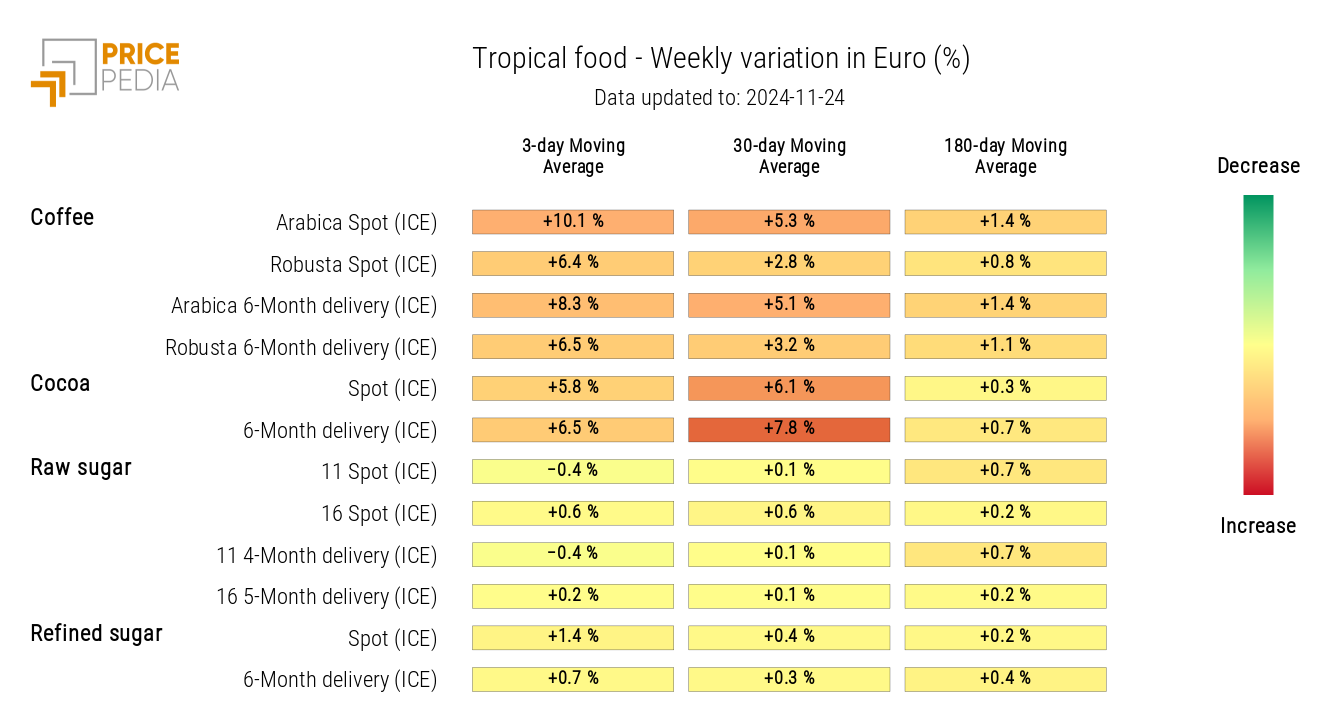
The tropical products heatmap indicates a price increase, especially for coffee and cocoa.
HeatMap of Tropical Food Prices in Euros
OILS
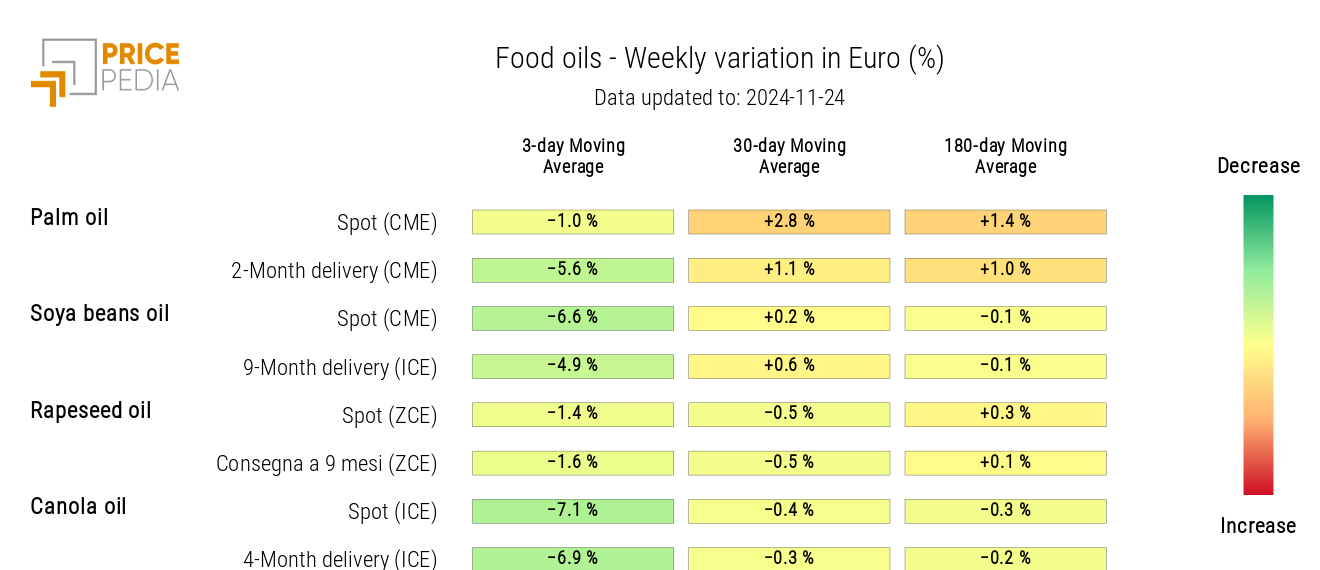
The heatmap analysis shows a general decline in food oil prices.
HeatMap of Food Oil Prices in Euros
