Update of edible oil prices to November 2024
Financial prices of edible oils and customs prices of olive oil fall again
Published by Luca Sazzini. .
Palm Oil Vegetable oils Price DriversBelow is the trend of the last 6 months of the financial price index for edible oils prepared by PricePedia.[1]
PricePedia Financial Index of Edible Oil Prices in Euros
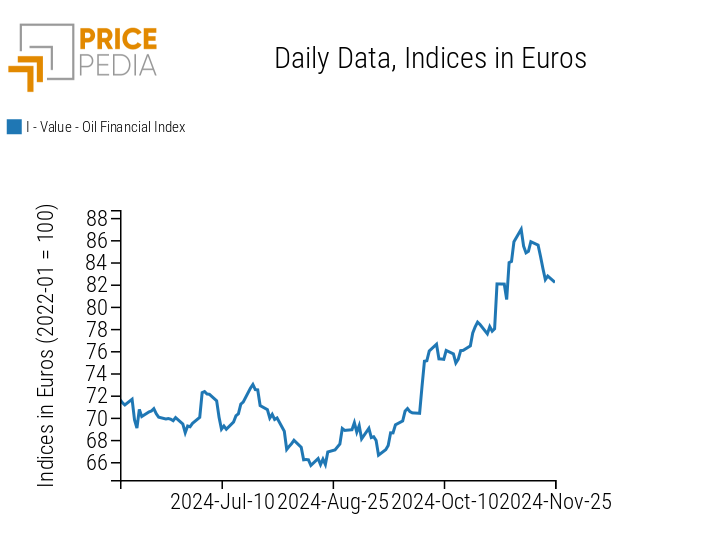
The growth phase of the edible oil index is primarily attributed to the rise in financial prices of palm oil, driven by increased domestic demand in major producing countries and the resulting reduction in exports.
Indonesia and Malaysia are the two largest global producers of palm oil, together controlling over 80% of global production.
The increase in production in Indonesia during the last season was more than offset by the growth in domestic demand for biodiesel production, which led to a contraction in exports.
In Malaysia, on the other hand, production decreased due to unfavorable weather conditions and increased demand for biodiesel aimed at reducing energy dependence on imports.
In Thailand, the third-largest exporter of palm oil, the Department of Internal Trade temporarily banned palm oil exports until December due to severe drought and plant diseases that compromised the harvest.
Other factors that influenced the growth in palm oil prices included the aging of trees, which reduces per-tree production, and ongoing disruptions in fertilizer supplies from Russia caused by the war in Ukraine.
These elements, combined with rising prices of substitute oils such as rapeseed oil and soybean oil, have driven up palm oil prices and the PricePedia financial index of edible oils.
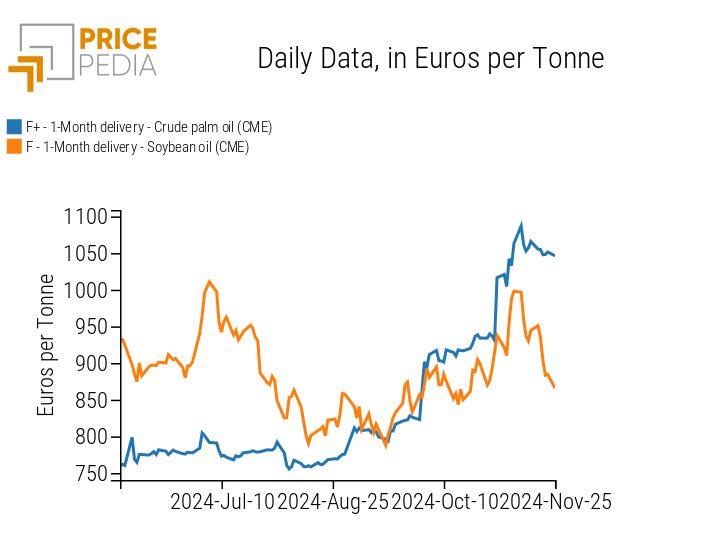
The recent phase of reduction in the financial index for edible oils is due to the decline in financial prices of soybean oil, which also impacted the decrease in palm oil prices, further exacerbated by reduced global demand in recent weeks.
Another significant factor contributing to the decline in prices was the recent postponement of the deforestation regulation by the European Council.
Financial markets had feared that the immediate enforcement of this regulation, without amendments or delays, could significantly limit imports of oil from countries with high deforestation levels.
The following chart shows the financial prices of palm oil and soybean oil, both quoted at the Chicago Mercantile Exchange (CME) and expressed in euros per ton.
Historical Series of Financial Prices for Palm Oil and Soybean Oil, Expressed in Euros/Ton
Do you want to stay up-to-date on commodity market trends?
Sign up for PricePedia newsletter: it's free!
Analysis of Monthly Average Oil Prices
Below is an analysis of the monthly price levels of oils, aimed at comparing the different price levels and their dynamics.Financial Price Analysis
The table below shows the monthly averages of financial prices of edible oils, expressed in euros per ton.
Monthly Averages of Financial Prices of Edible Oils, Expressed in Euros/Ton
| 2024-09 | 2024-10 | 2024-11 | |
|---|---|---|---|
| F+-Delivery 1 Month-Palm Oil (CME) | 812 | 917 | 1048 |
| F-Delivery 1 Month-Palm Oil CIF Rotterdam | 1037 | 1161 | 1249 |
| F+-Delivery 1 Month-Canola Oil (ICE) | 526 | 570 | 588 |
| F-Delivery 1 Month-Soybean Oil (CME) | 829 | 876 | 940 |
| F+-Delivery 1 Month-Soybean Oil China (DCE) | 992 | 1053 | 1082 |
| F+-Delivery 1 Month-Rapeseed Oil China (ZCE) | 1140 | 1232 | 1241 |
From the table analysis, it can be observed that financial oil prices, although at different levels, have all shown an upward trend over the last three months.
An analysis of the levels reveals that canola oil quoted on the Intercontinental Exchange (ICE) is relatively the cheapest, while rapeseed oil quoted on the Zhengzhou Commodity Exchange (ZCE) has the highest average levels.
Analysis of Customs Prices
Within the European Union, many different types of edible oils are traded.
The following table shows the monthly averages of European customs prices expressed in euro per ton, for 8 different edible oils, sorted by their price levels.
Monthly averages of customs prices for edible oils, expressed in euro per ton
| 2024-08 | 2024-09 | 2024-10 | |
|---|---|---|---|
| D-Last Price EU-Soybean Oil | 870 | 863 | 894 |
| D-Last Price EU-Sunflower Oil | 892 | 874 | 900 |
| D-Last Price EU-Rapeseed Oil | 902 | 947 | 958 |
| D-Last Price EU-Corn Oil | 940 | 950 | 984 |
| D-Last Price EU-Palm Oil | 993 | 986 | 986 |
| D-Last Price EU-Palm Kernel Oil | 1229 | 1227 | 1236 |
| D-Last Price EU-Refined Coconut Oil | 1636 | 1637 | 1645 |
| D-Last Price EU-Peanut Oil | 1701 | 1705 | 1681 |
From the analysis of the prices, different dynamics emerge across the various customs prices of edible oils.
In the last 3 months, the European customs prices for: rapeseed oil, corn oil, and coconut oil have shown an upward trend.
The prices for soybean oil, sunflower oil, and palm kernel oil, on the other hand, decreased in September, before rising again in October.
Conversely, peanut oil has followed an opposite trend, while the prices of palm oil showed a decrease in September before stabilizing the following month. Although customs prices for palm oil are strongly correlated with financial prices, they show a delay in adjusting to their financial benchmark. Consequently, they do not yet reflect the recent dynamics analyzed for financial prices.
The Case of Olive Oil
A primary oil in European trade is olive oil, which has experienced significant price growth in recent years.
The following chart shows the dynamics of European customs prices for olive oil, expressed in euro per ton.
Historical series of European customs prices for olive oil, expressed in euro per ton
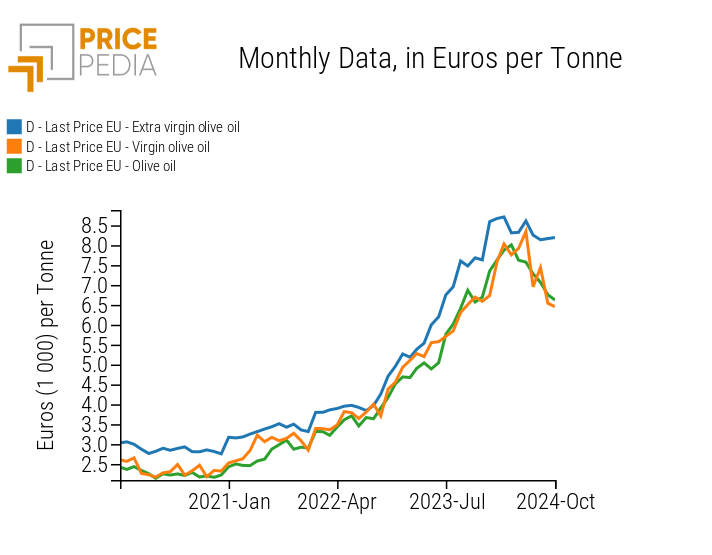
The analysis of the chart highlights the marked growth in olive oil prices in recent years.
In 2022, a significant acceleration in price growth was recorded due to a severe drought that hit the main global production areas, especially those in the Mediterranean basin. The Spanish agriculture minister declared that, in the same year, production fell by 55% compared to the previous season.
The 2023 harvest was also affected by adverse climatic conditions, characterized by prolonged high temperatures and scarce precipitation, which further contributed to rising prices.
However, in the last semester, a reduction in prices is being observed, thanks to improved prospects for the 2024/2025 harvests, which are expected to be significantly higher than those of the previous year. In particular, record harvests are forecasted in Turkey and Tunisia, two major olive oil-exporting countries, with estimates of 475,000 and 340,000 tons, respectively.
[1] The index is constructed based on the financial price trends of palm oil, canola oil, and soybean oil, quoted on the Chicago Mercantile Exchange (CME) and the Intercontinental Exchange (ICE).
