Monthly commodity prices update for November 2024
The period of absolute stability in commodity prices continues
Published by Pasquale Marzano. .
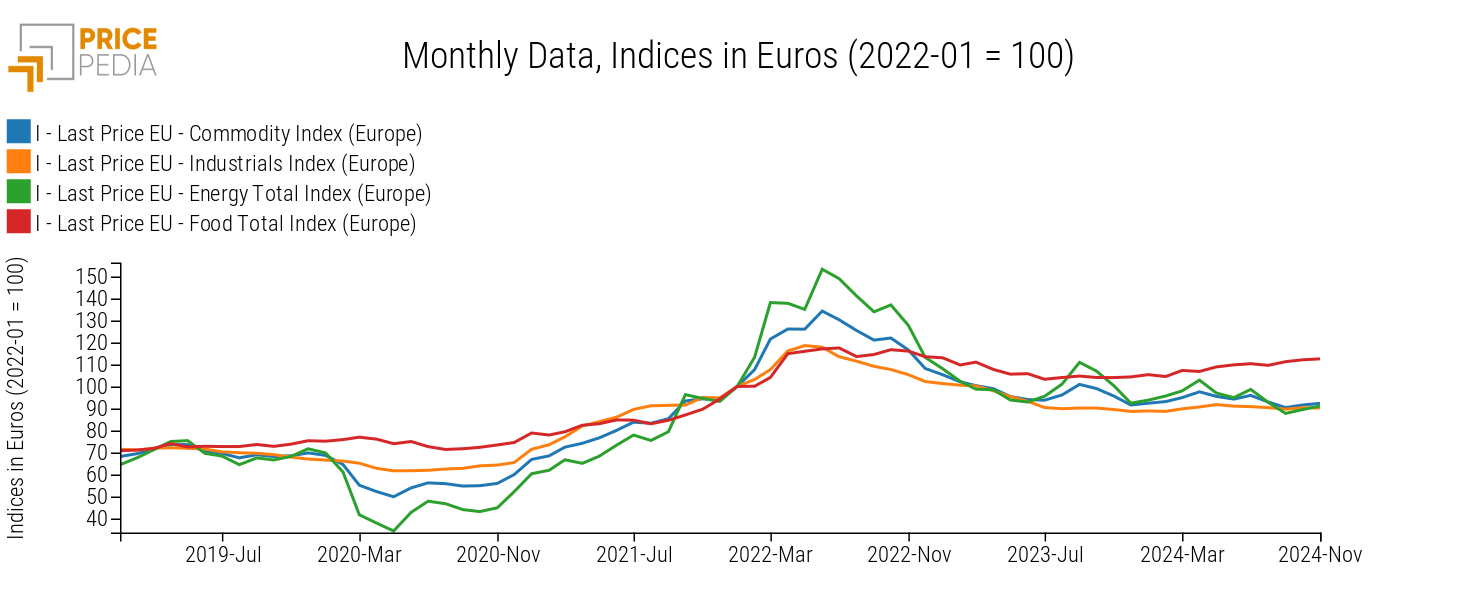
EU Customs Global Economic TrendsThe monthly update of the PricePedia commodity prices for November 2024 has been released. On a monthly basis, commodity prices, in aggregate, once again showed stability, with a slight variation of +0.8%. This movement aligns with the "lateral" dynamic that began in July 2023. Since then, the PricePedia price indices have shown minimal variability.
The following chart illustrates the price evolution of commodities in Europe for the main PricePedia aggregates: Commodity[1], Industrials[2], Energy Total, and Food Total, indexed to January 2022 levels (base 100).

The exceptions to the lateral price dynamic in euros are represented by the Food price index, which has shown an upward trend over the last 16 months, driven by price increases in tropical goods (cocoa and coffee) and oils and fats (primarily olive oil), and the Energy prices, which in the same period recorded a decrease of -4.6%.
Do you want to stay up-to-date on commodity market trends?
Sign up for PricePedia newsletter: it's free!
Regarding the core industrial commodities index, the past 16 months have seen absolute stability, unprecedented until now, with a cumulative variation of only -0.2% and a variability below 1%[3]. This means the index, over the period considered, has consistently remained within -1% and +1% of its average value.
To find a somewhat similar phase, one has to go back to the European sovereign debt crisis period, between August 2011 and December 2012, when the European Industrials price index recorded a cumulative decrease of -5% and variability between 1% and 2%.
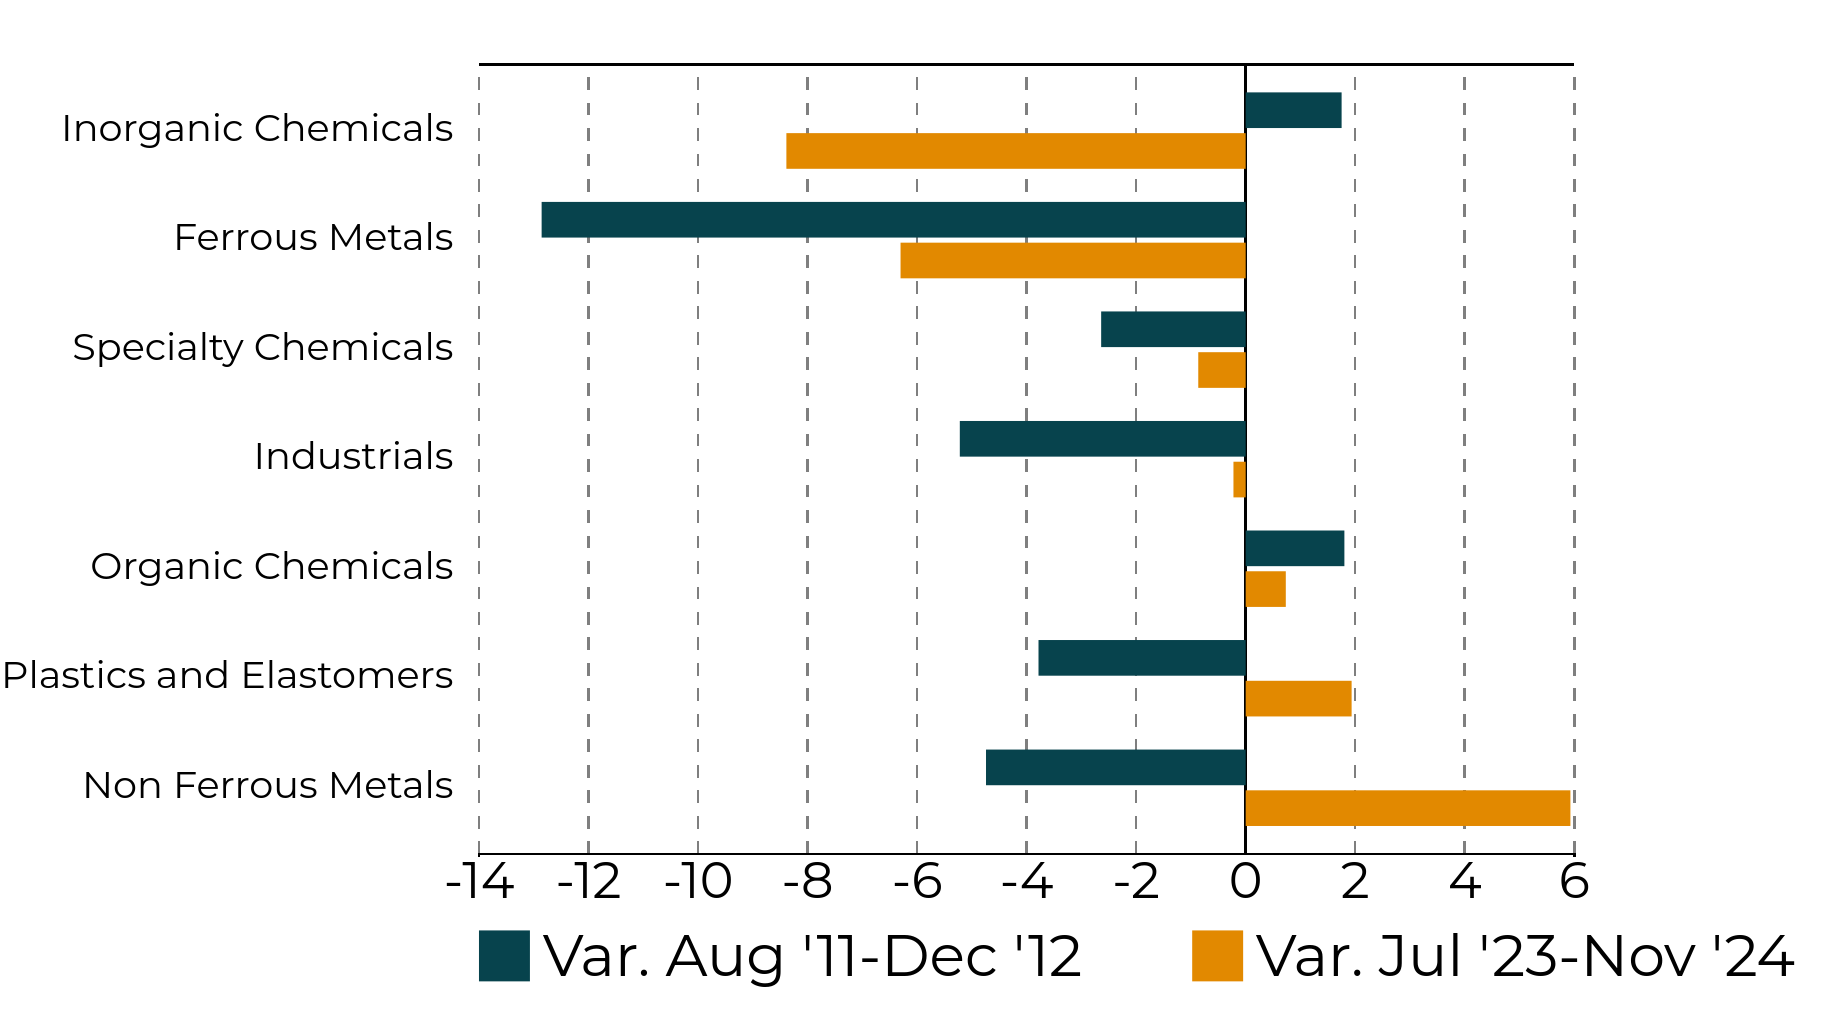
The following chart compares the percentage price variations in euros during the two periods for the aggregated Industrials index and its main components: Ferrous and Non-Ferrous Metals, Plastics and Elastomers, Organic Chemicals, Inorganic Chemicals, and Specialty Chemicals.
Cumulative Variations (%) August '11-December '12 and July '23-November '24

The comparison highlights greater heterogeneity in the price trends of different categories during the current phase: increases in some categories (e.g., Non-Ferrous Metals with a +6%) contrast with decreases in others (e.g., Inorganic Chemicals with an -8%), resulting in the overall equilibrium of the Industrials index.
In contrast, during the sovereign debt crisis period, there was greater convergence in price decreases.
The common factor between the two periods is the prolonged weakness of European commodity demand, within a context of reduced industrial activity levels. The average manufacturing PMI in Europe during the two periods, August 2011-December 2012 and July 2023-November 2024, was 46.6 and 45.1, respectively, well below the neutrality threshold of 50.
Comparison with Chinese Market Prices
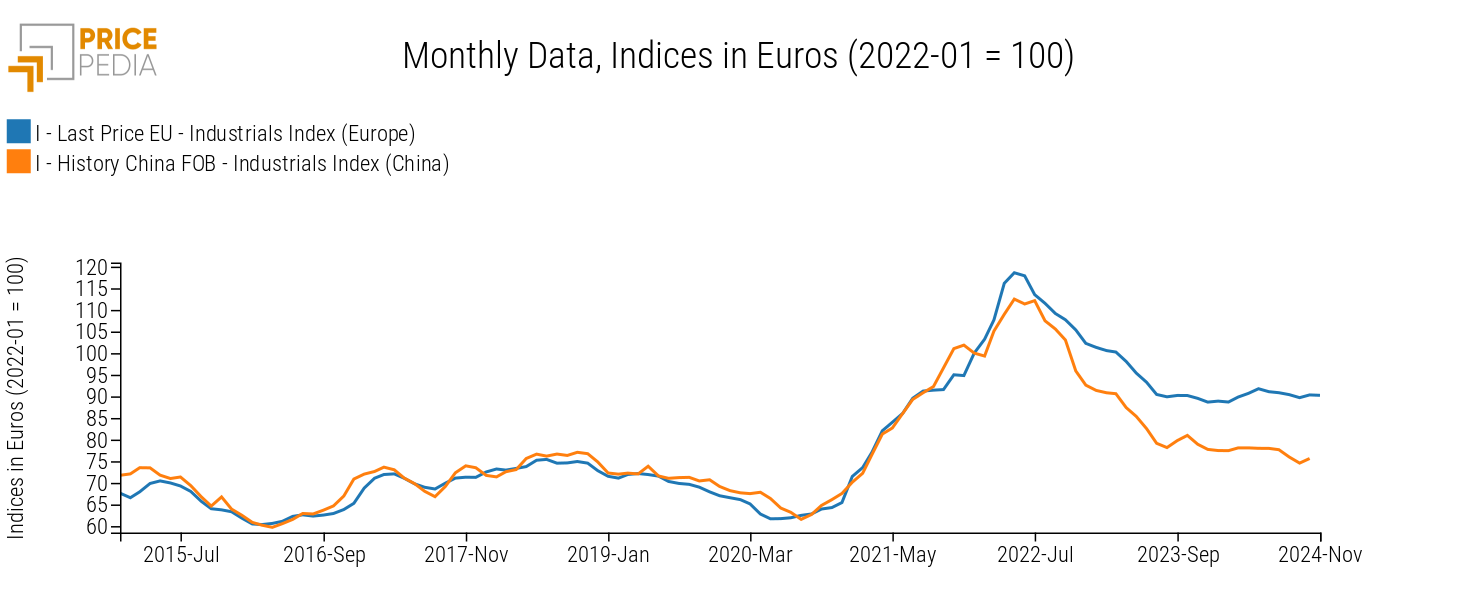
When comparing EU price indices with those in euros for the Chinese market over the past 16 months, high stability is also observed, although the cumulative price reduction is more pronounced, at -4.4%.

In addition to the factor of weak commodity demand, the price trends in China have also played a role in containing prices in the European market.
1. The PricePedia Commodity index is the aggregation of Industrials, Food and Energy indices.
2. The PricePedia Industrials index is the aggregation of indices related to the following categories: Ferrous Metals, Non-Ferrous Metals, Wood and Paper, Chemicals: Specialty, Organic Chemicals, Inorganic Chemicals, Plastics and Elastomers, and Textile Fibers.
3. Variability is measured for the period 2023-07 / 2024-11 as normalized standard deviation, calculated as the ratio of the standard deviation to the index average, multiplied by 100.


